| Param | Original file | Final file |
|---|---|---|
| Filename | modeM0/AS1A05_212T07_9000002746_18507cztM0_level2.evt | modeM0/AS1A05_212T07_9000002746_18507cztM0_level2_quad_clean.evt |
| Size (bytes) | 518,774,400 | 73,687,680 |
| Size | 494.7 MB | 70.3 MB |
| Events in quadrant A | 3,631,056 | 425,262 |
| Events in quadrant B | 3,666,542 | 439,873 |
| Events in quadrant C | 3,590,463 | 429,143 |
| Events in quadrant D | 4,321,001 | 422,504 |
| Mode M9 | |||
|---|---|---|---|
| Quadrant | BADHDUFLAG | Total packets | Discarded packets |
| A | 0 | 16 | 0 |
| B | 0 | 16 | 0 |
| C | 0 | 16 | 0 |
| D | 0 | 16 | 0 |
| Mode M0 | |||
|---|---|---|---|
| Quadrant | BADHDUFLAG | Total packets | Discarded packets |
| A | 0 | 15477 | 2 |
| B | 0 | 15587 | 2 |
| C | 0 | 15343 | 2 |
| D | 0 | 17878 | 2 |
| Mode SS | |||
|---|---|---|---|
| Quadrant | BADHDUFLAG | Total packets | Discarded packets |
| A | 0 | 152 | 0 |
| B | 0 | 152 | 0 |
| C | 0 | 152 | 0 |
| D | 0 | 152 | 0 |
| Quadrant | Total seconds | Saturated seconds | Saturation percentage |
|---|---|---|---|
| A | 7388 | 123 | 1.664862% |
| B | 7388 | 110 | 1.488901% |
| C | 7388 | 142 | 1.922036% |
| D | 7388 | 435 | 5.887926% |
Noise dominated data is calculated using 1-second bins in cleaned event files. If a bin has >2000 counts, and if more than 50% of those come from <1% of pixels, then it is considered to be noise-dominated and hence unusable.
| Quadrant | # 1 sec bins | Bins with >0 counts | Bins with >2000 counts | High rate bins dominated by noise | Noise dominated (total time) | Noise dominated (detector-on time) | Marked lightcurve |
|---|---|---|---|---|---|---|---|
| A | 9013 | 7388 | 13 | 13 | 0.14% | 0.18% | 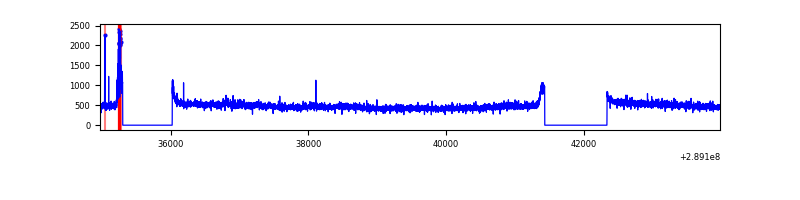 |
| B | 9013 | 7388 | 3 | 3 | 0.03% | 0.04% | 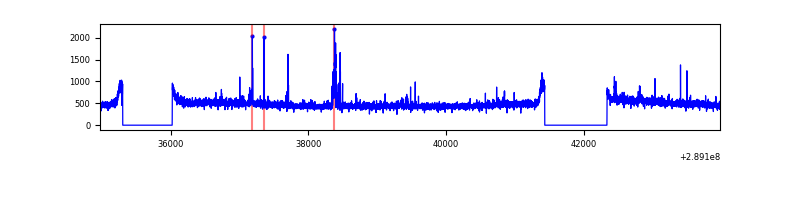 |
| C | 9013 | 7388 | 0 | 0 | 0.00% | 0.00% | 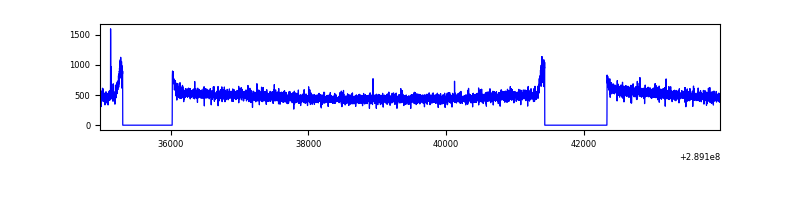 |
| D | 9013 | 7388 | 314 | 314 | 3.48% | 4.25% | 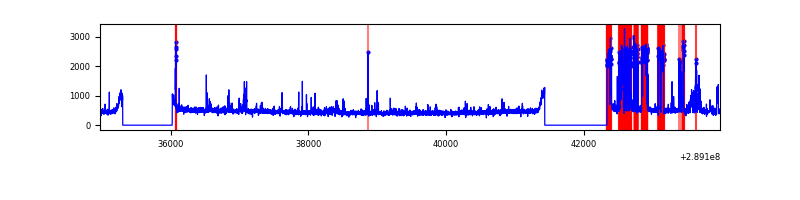 |
Top three noisy pixels from each quadrant. If the there are fewer than three noisy pixels in the level2.evt file, extra rows are filled as -1
| Pixel properties | Quadrant properties | ||||||
|---|---|---|---|---|---|---|---|
| Quadrant | DetID | PixID | Counts | Sigma | Mean | Median | Sigma |
| A | 0 | 13 | 75783 | 404.45 | 908 | 890 | 185.2 |
| A | 15 | 174 | 45723 | 242.11 | 908 | 890 | 185.2 |
| A | 13 | 254 | 11229 | 55.83 | 908 | 890 | 185.2 |
| B | 6 | 36 | 53251 | 296.49 | 911 | 889 | 176.6 |
| B | 12 | 111 | 21369 | 115.96 | 911 | 889 | 176.6 |
| B | 11 | 111 | 18446 | 99.41 | 911 | 889 | 176.6 |
| C | 14 | 238 | 136491 | 656.8 | 883 | 890 | 206.5 |
| C | 9 | 54 | 6816 | 28.7 | 883 | 890 | 206.5 |
| C | 13 | 61 | 6181 | 25.63 | 883 | 890 | 206.5 |
| D | 1 | 52 | 888348 | 4139.46 | 873 | 848 | 214.4 |
| D | 7 | 38 | 40703 | 185.89 | 873 | 848 | 214.4 |
| D | 2 | 234 | 30958 | 140.44 | 873 | 848 | 214.4 |
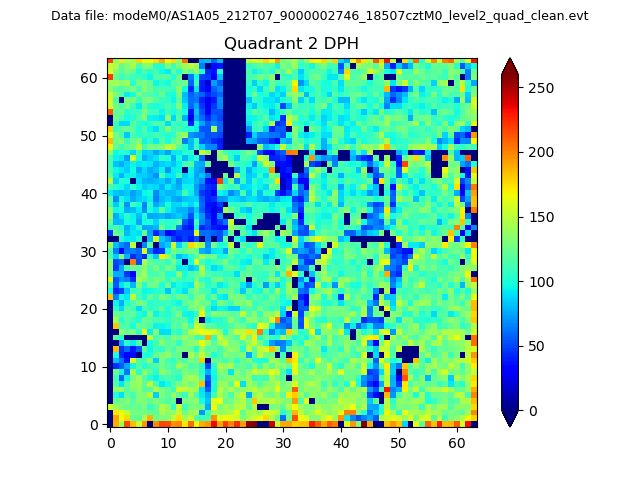
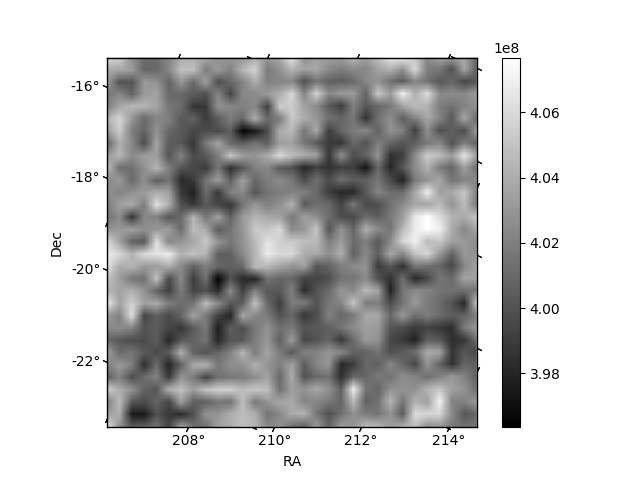
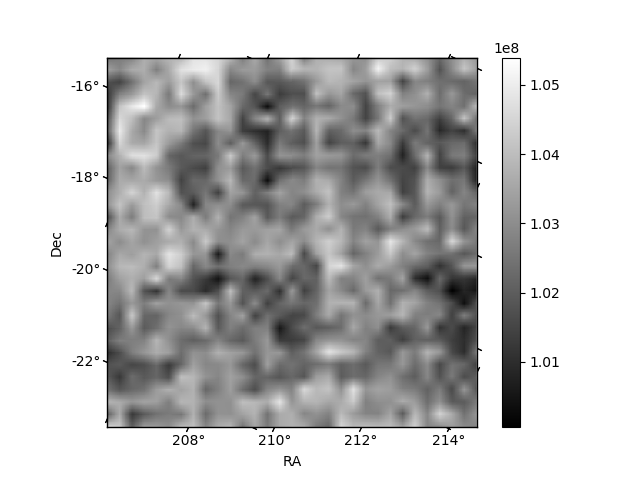
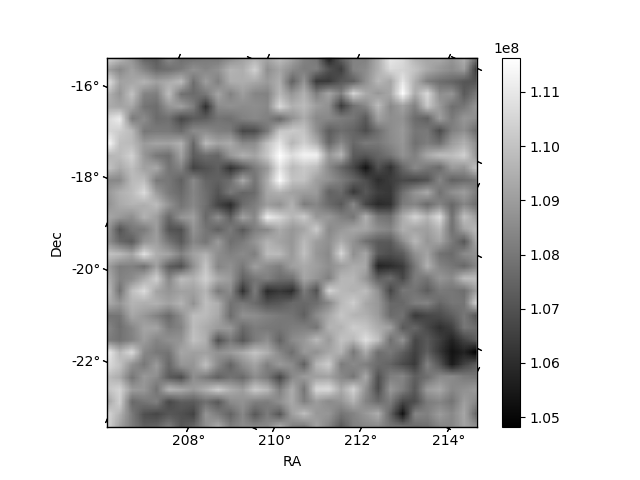
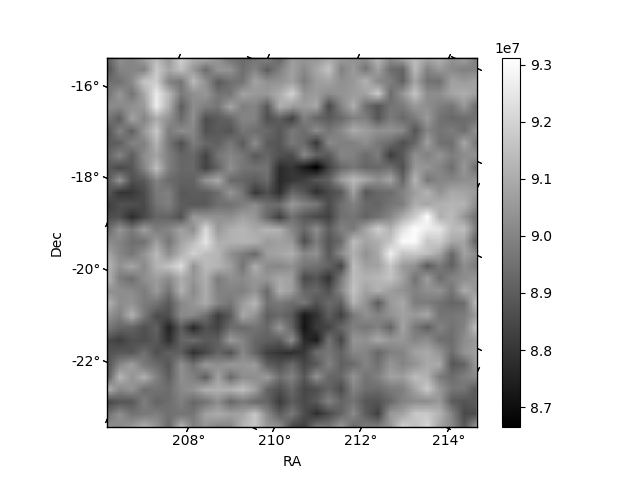
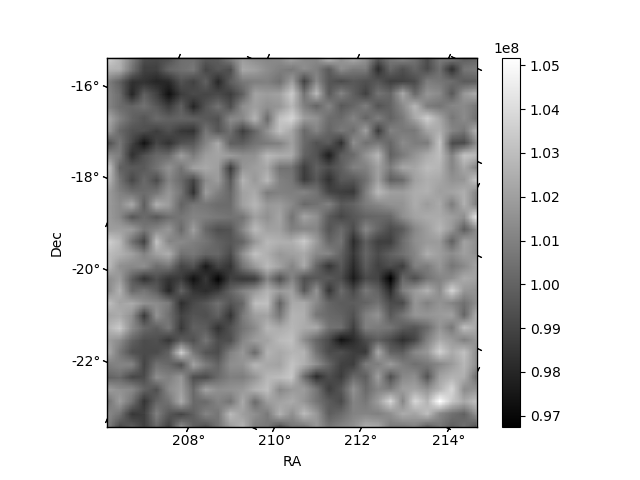
Histogram calculated using DETX and DETY for each event in the final _common_clean file
| Quadrant A | 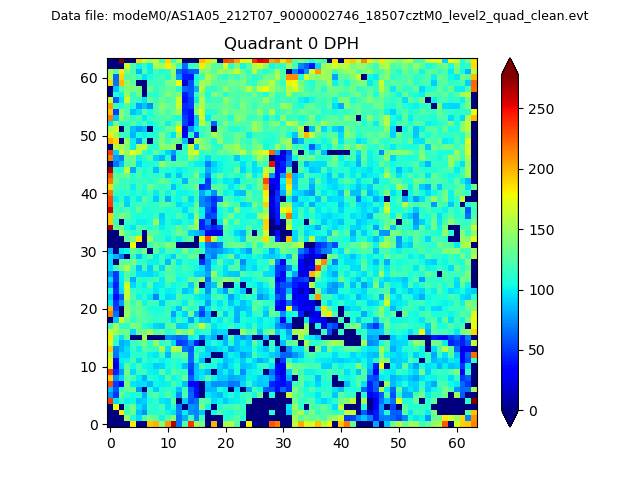 |
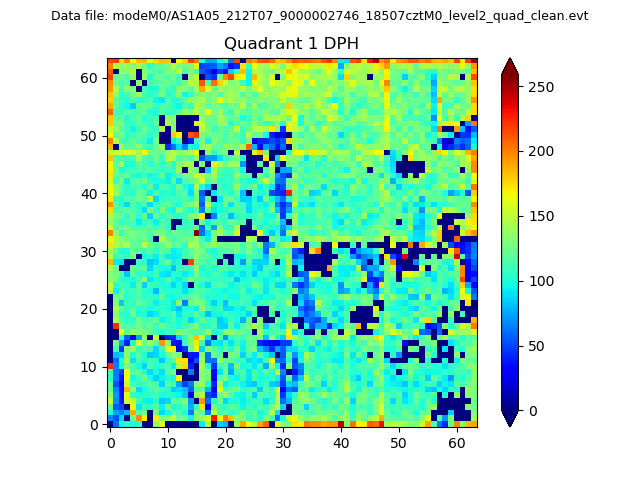 |
Quadrant B |
|---|---|---|---|
| Quadrant D | 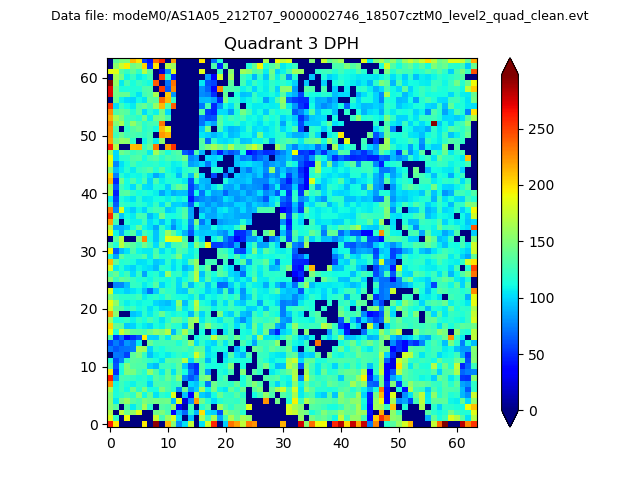 |
 |
Quadrant C |
| Plot type | Count rate plots | Images |
|---|---|---|
| Comparison with Poisson distribution Blue bars denote a histogram of data divided into 1 sec bins. Red curve is a Poisson curve with rate = median count rate of data. |
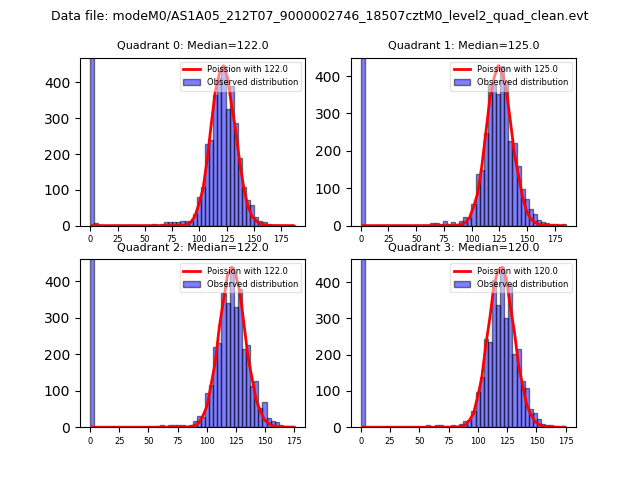 |
 |
| Quadrant-wise count rates Data is divided into 100 sec bins |
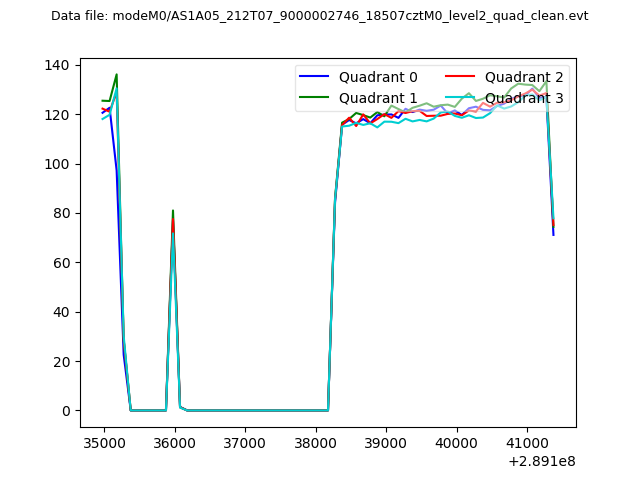 |
|
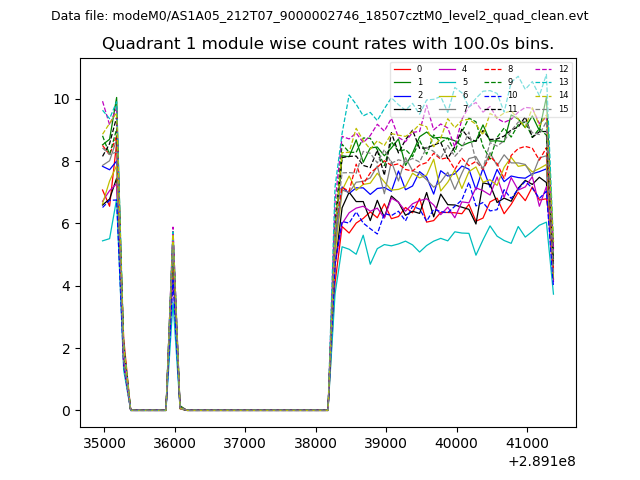
| Module-wise count rates for Quadrant A Data is divided into 100 sec bins |
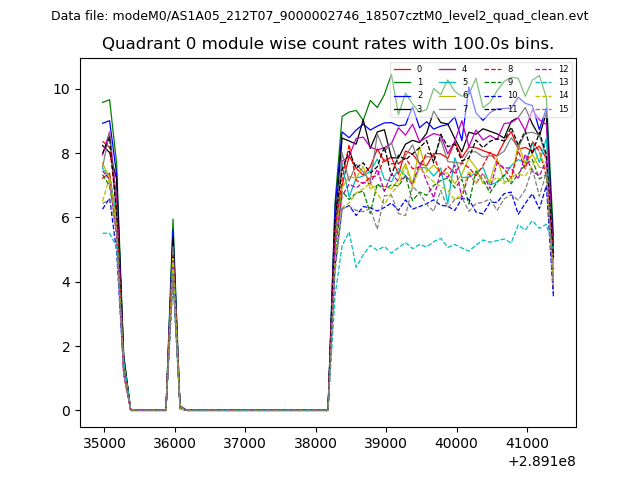 |
 |
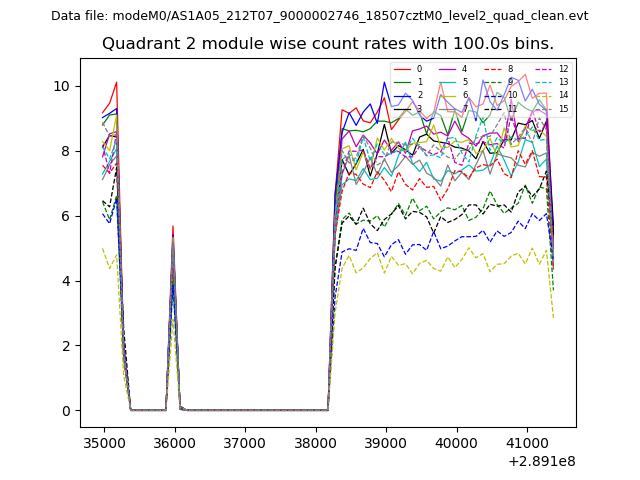
| Module-wise count rates for Quadrant B Data is divided into 100 sec bins |
 |
 |
| Module-wise count rates for Quadrant C Data is divided into 100 sec bins |
 |
 |
| Module-wise count rates for Quadrant D Data is divided into 100 sec bins |
 |
 |
| Parameter | Plot |
|---|---|
| CZT HV Monitor | 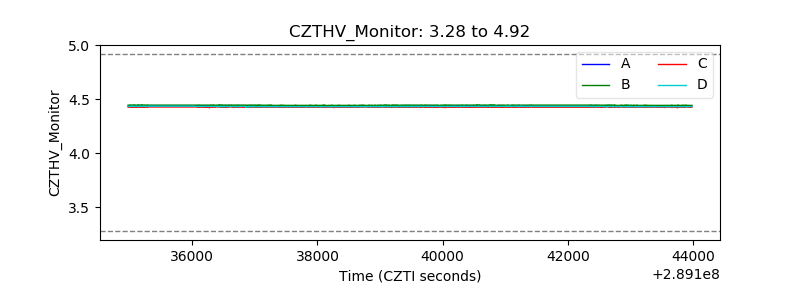 |
| D_VDD | 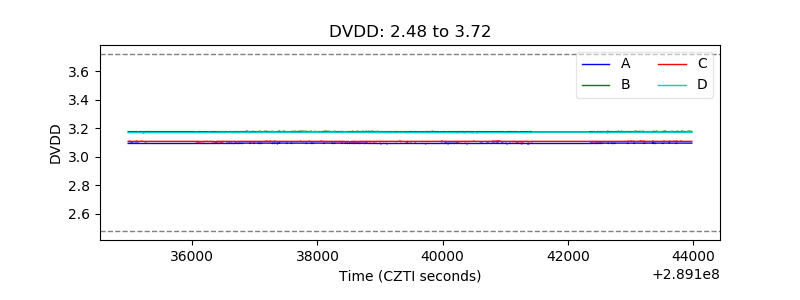 |
| Temperature 1 | 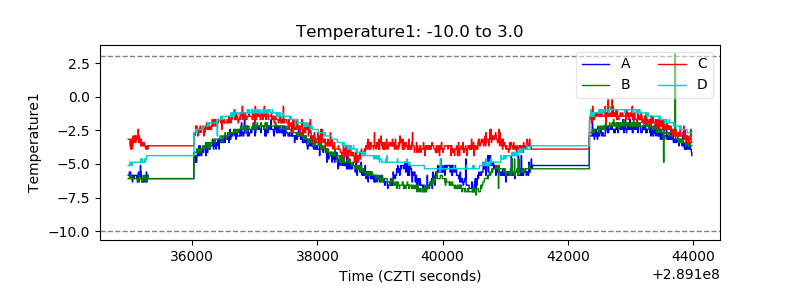 |
| Veto HV Monitor | 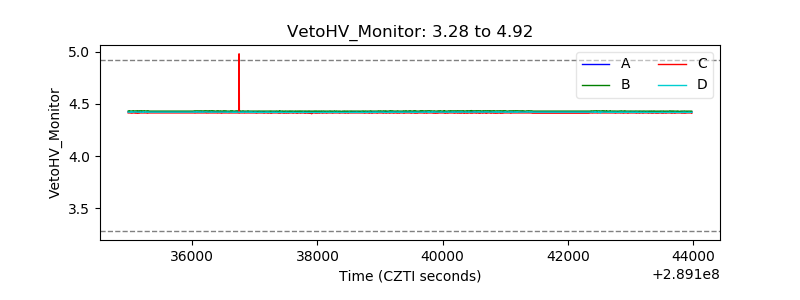 |
| Veto LLD | 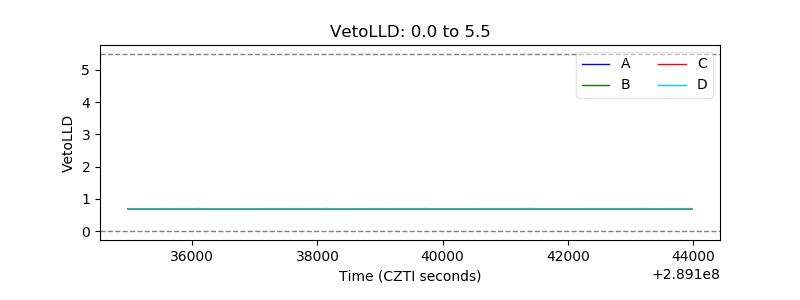 |
| Alpha Counter | 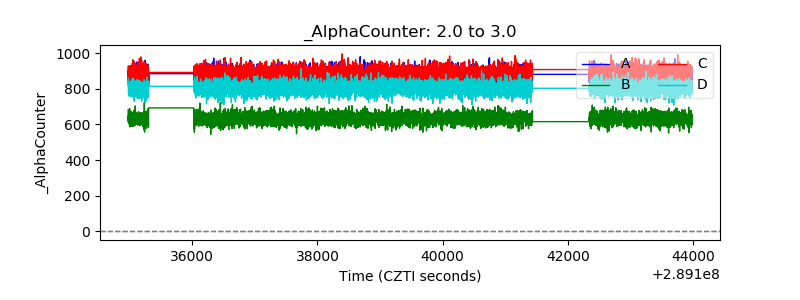 |
| _CPM_Rate | 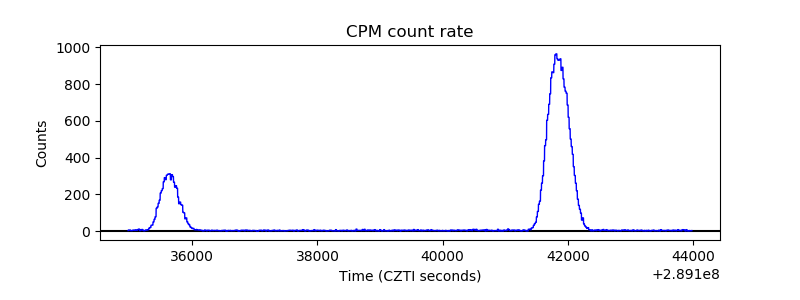 |
| CZT Counter | 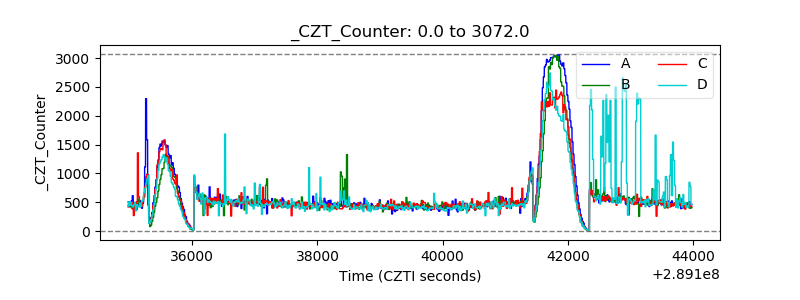 |
| +2.5 Volts monitor | 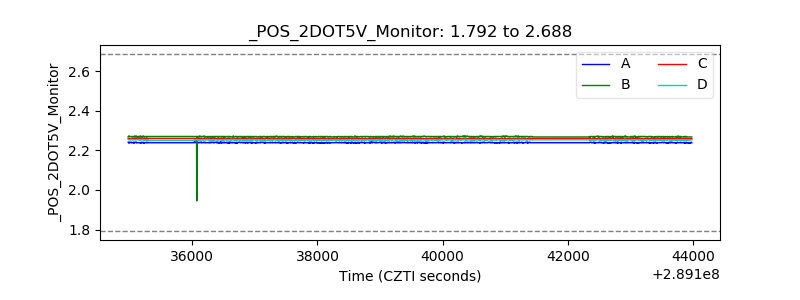 |
| +5 Volts monitor |  |
| _ROLL_ROT | 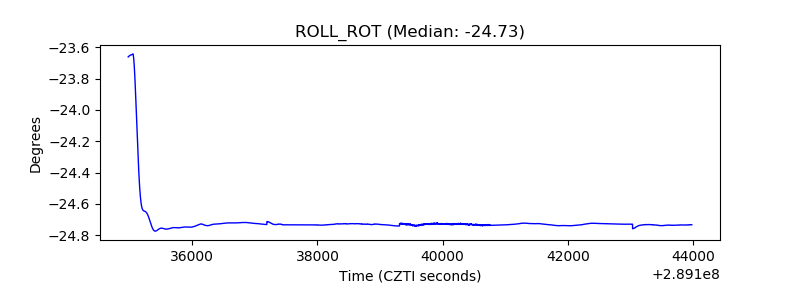 |
| _Roll_DEC | 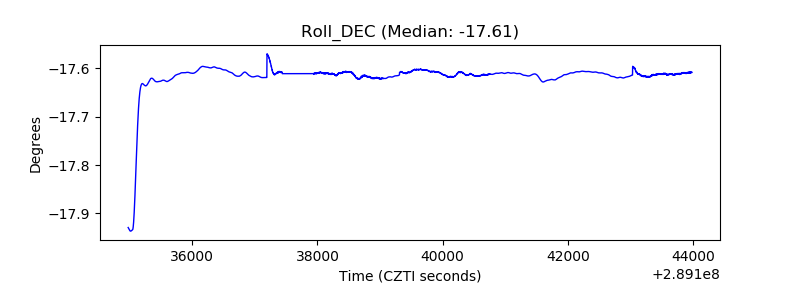 |
| _Roll_RA | 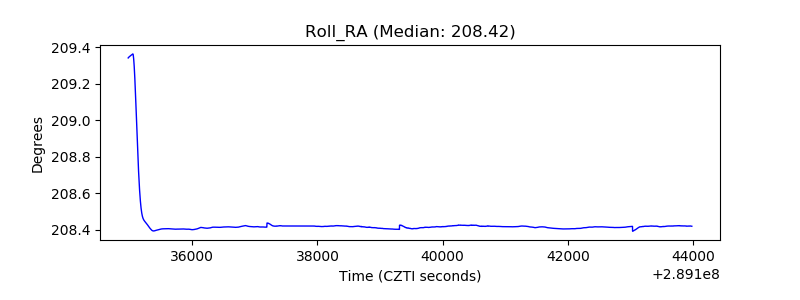 |
| Veto Counter | 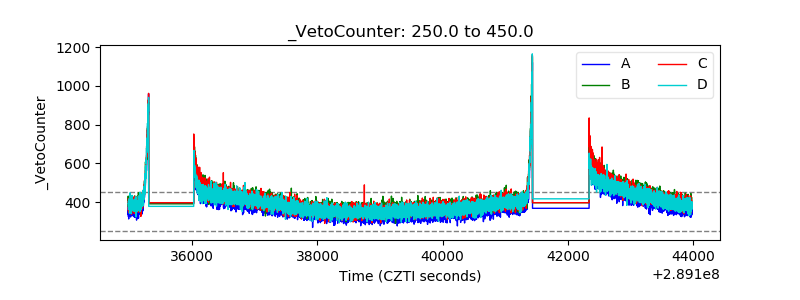 |