| Param | Original file | Final file |
|---|---|---|
| Filename | modeM0/AS1A05_212T07_9000002746_18508cztM0_level2.evt | modeM0/AS1A05_212T07_9000002746_18508cztM0_level2_quad_clean.evt |
| Size (bytes) | 447,379,200 | 70,960,320 |
| Size | 426.7 MB | 67.7 MB |
| Events in quadrant A | 3,043,022 | 428,821 |
| Events in quadrant B | 3,137,013 | 436,925 |
| Events in quadrant C | 3,072,106 | 424,865 |
| Events in quadrant D | 3,868,464 | 418,199 |
| Mode M9 | |||
|---|---|---|---|
| Quadrant | BADHDUFLAG | Total packets | Discarded packets |
| A | 0 | 11 | 0 |
| B | 0 | 11 | 0 |
| C | 0 | 11 | 0 |
| D | 0 | 11 | 0 |
| Mode M0 | |||
|---|---|---|---|
| Quadrant | BADHDUFLAG | Total packets | Discarded packets |
| A | 0 | 13180 | 1 |
| B | 0 | 13418 | 1 |
| C | 0 | 13144 | 1 |
| D | 0 | 15758 | 1 |
| Mode SS | |||
|---|---|---|---|
| Quadrant | BADHDUFLAG | Total packets | Discarded packets |
| A | 0 | 128 | 0 |
| B | 0 | 128 | 0 |
| C | 0 | 128 | 0 |
| D | 0 | 128 | 0 |
| Quadrant | Total seconds | Saturated seconds | Saturation percentage |
|---|---|---|---|
| A | 6301 | 47 | 0.745913% |
| B | 6300 | 63 | 1.000000% |
| C | 6300 | 79 | 1.253968% |
| D | 6301 | 279 | 4.427869% |
Noise dominated data is calculated using 1-second bins in cleaned event files. If a bin has >2000 counts, and if more than 50% of those come from <1% of pixels, then it is considered to be noise-dominated and hence unusable.
| Quadrant | # 1 sec bins | Bins with >0 counts | Bins with >2000 counts | High rate bins dominated by noise | Noise dominated (total time) | Noise dominated (detector-on time) | Marked lightcurve |
|---|---|---|---|---|---|---|---|
| A | 7361 | 6301 | 0 | 0 | 0.00% | 0.00% | 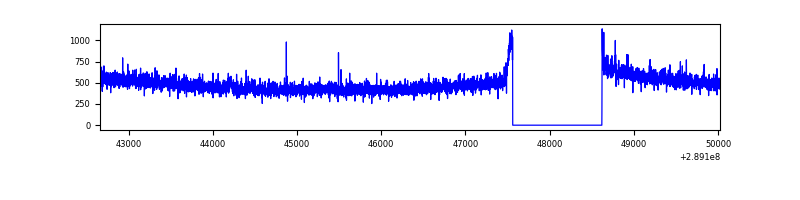 |
| B | 7360 | 6300 | 7 | 7 | 0.10% | 0.11% | 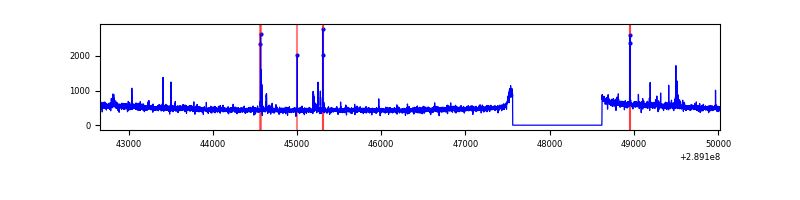 |
| C | 7360 | 6300 | 1 | 1 | 0.01% | 0.02% | 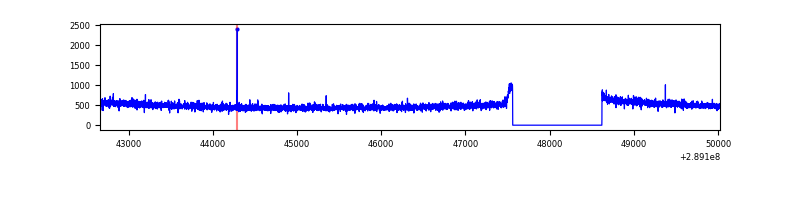 |
| D | 7361 | 6301 | 228 | 228 | 3.10% | 3.62% | 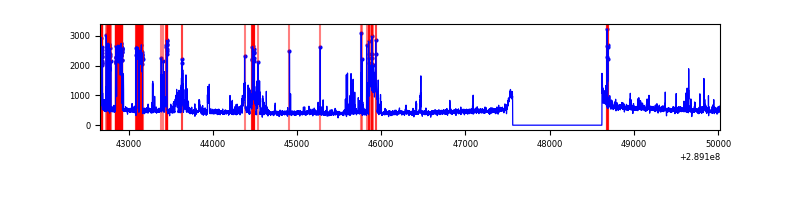 |
Top three noisy pixels from each quadrant. If the there are fewer than three noisy pixels in the level2.evt file, extra rows are filled as -1
| Pixel properties | Quadrant properties | ||||||
|---|---|---|---|---|---|---|---|
| Quadrant | DetID | PixID | Counts | Sigma | Mean | Median | Sigma |
| A | 13 | 254 | 9540 | 54.8 | 784 | 766 | 160.1 |
| A | 4 | 2 | 8111 | 45.88 | 784 | 766 | 160.1 |
| A | 0 | 226 | 7103 | 39.58 | 784 | 766 | 160.1 |
| B | 3 | 64 | 26664 | 171.76 | 784 | 766 | 150.8 |
| B | 12 | 111 | 17622 | 111.79 | 784 | 766 | 150.8 |
| B | 11 | 111 | 15197 | 95.71 | 784 | 766 | 150.8 |
| C | 14 | 238 | 117125 | 660.32 | 755 | 760 | 176.2 |
| C | 5 | 112 | 6290 | 31.38 | 755 | 760 | 176.2 |
| C | 13 | 61 | 5380 | 26.22 | 755 | 760 | 176.2 |
| D | 1 | 52 | 938217 | 5146.59 | 749 | 728 | 182.2 |
| D | 7 | 238 | 41376 | 223.15 | 749 | 728 | 182.2 |
| D | 13 | 168 | 30167 | 161.61 | 749 | 728 | 182.2 |
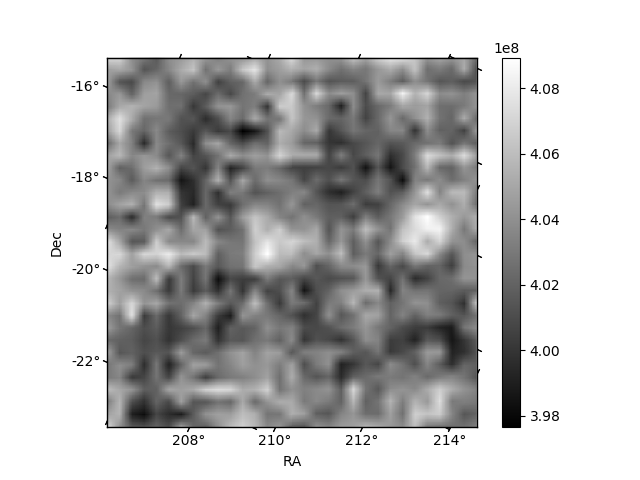
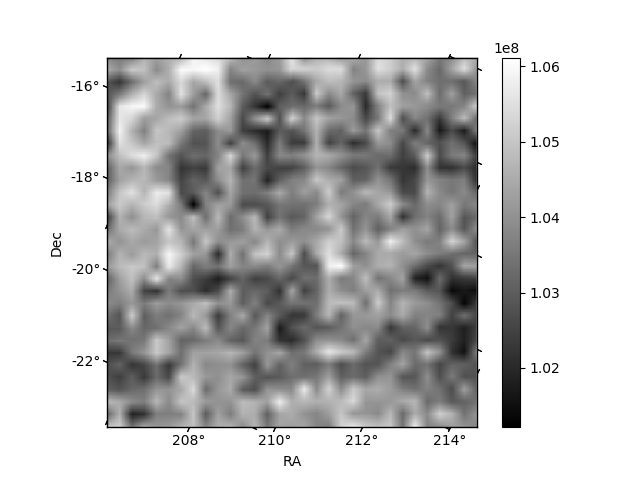
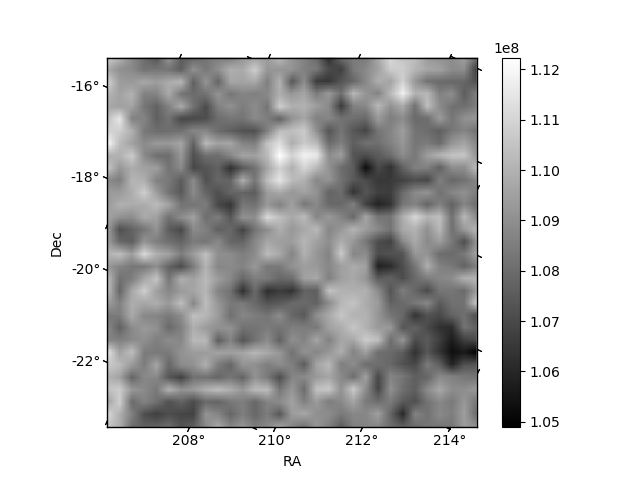
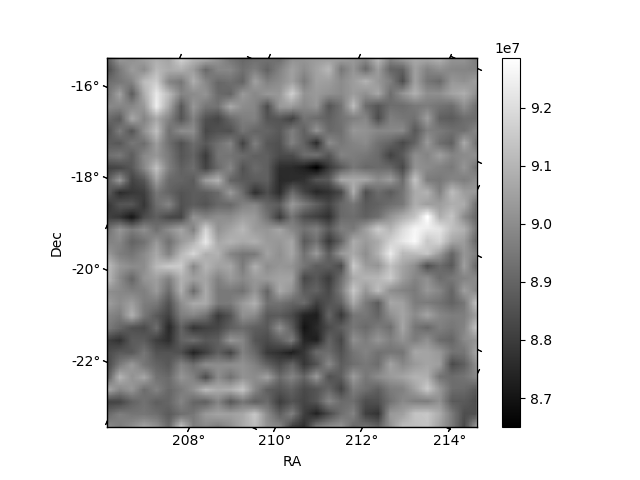
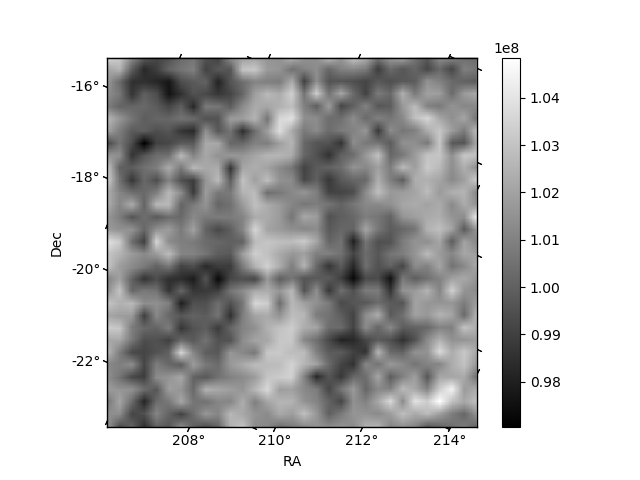
Histogram calculated using DETX and DETY for each event in the final _common_clean file
| Quadrant A | 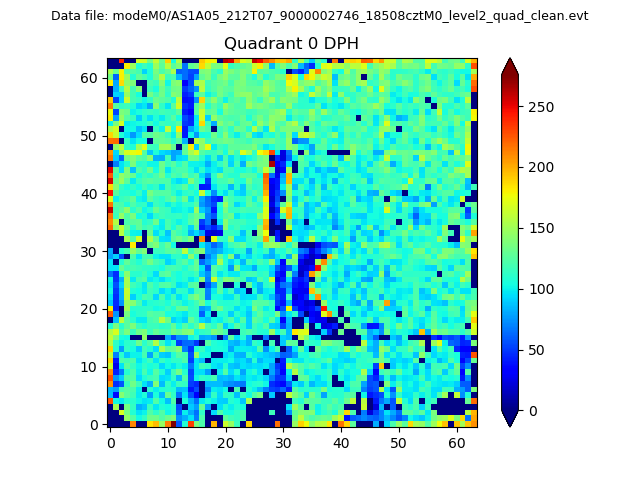 |
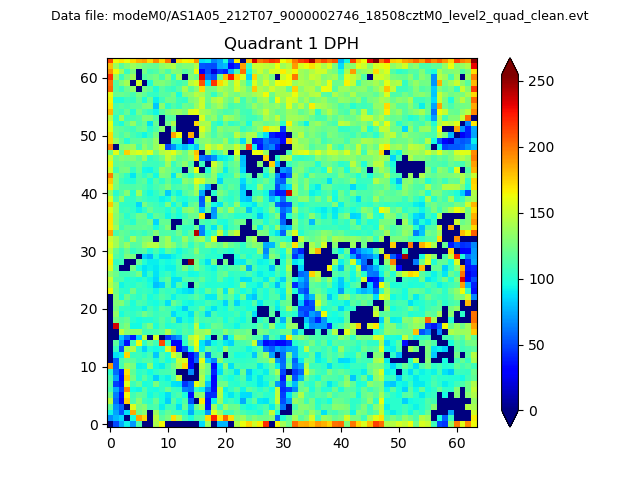 |
Quadrant B |
|---|---|---|---|
| Quadrant D | 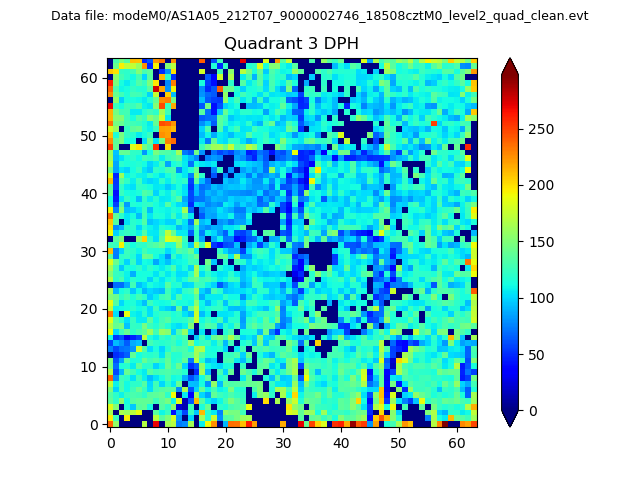 |
 |
Quadrant C |
| Plot type | Count rate plots | Images |
|---|---|---|
| Comparison with Poisson distribution Blue bars denote a histogram of data divided into 1 sec bins. Red curve is a Poisson curve with rate = median count rate of data. |
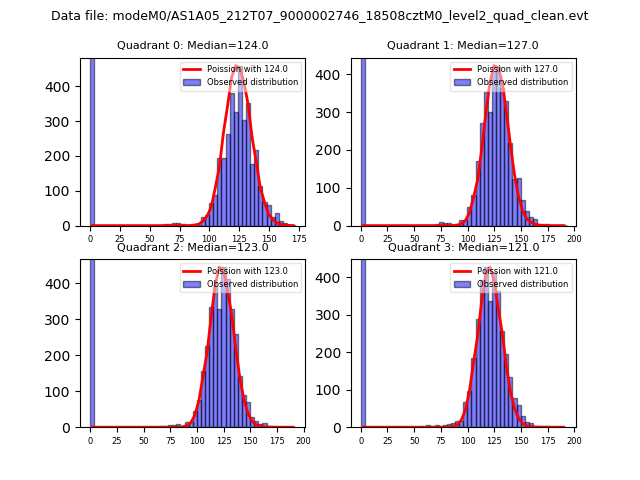 |
 |
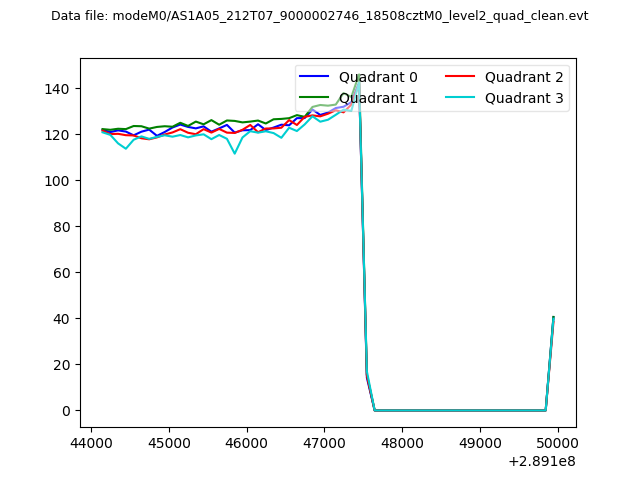
| Quadrant-wise count rates Data is divided into 100 sec bins |
 |
|
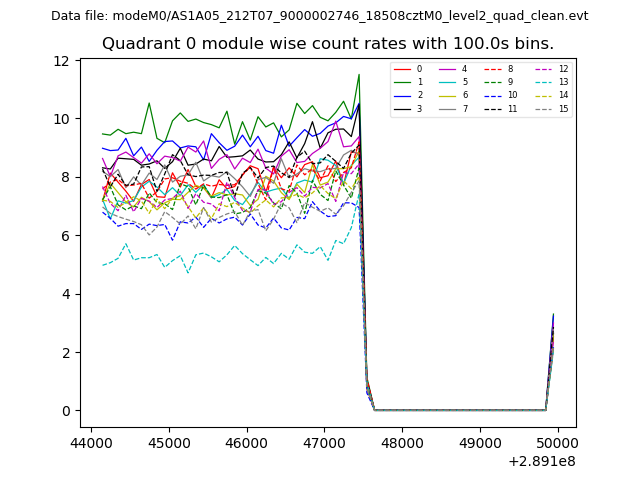
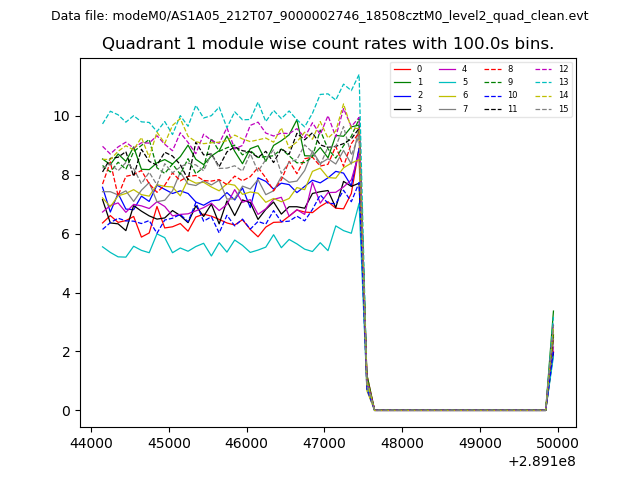
| Module-wise count rates for Quadrant A Data is divided into 100 sec bins |
 |
 |
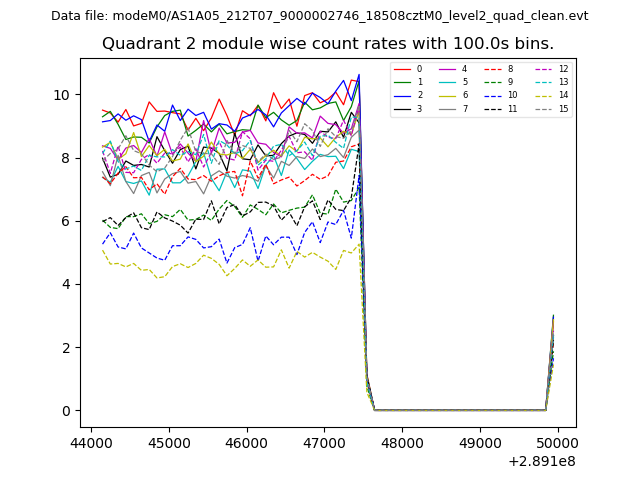
| Module-wise count rates for Quadrant B Data is divided into 100 sec bins |
 |
 |
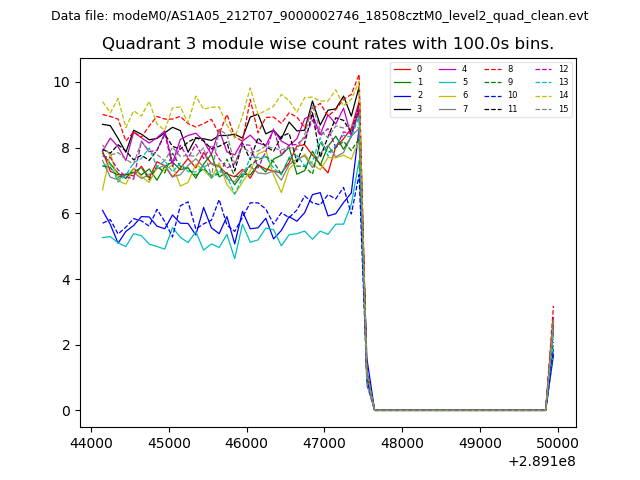
| Module-wise count rates for Quadrant C Data is divided into 100 sec bins |
 |
 |
| Module-wise count rates for Quadrant D Data is divided into 100 sec bins |
 |
 |
| Parameter | Plot |
|---|---|
| CZT HV Monitor | 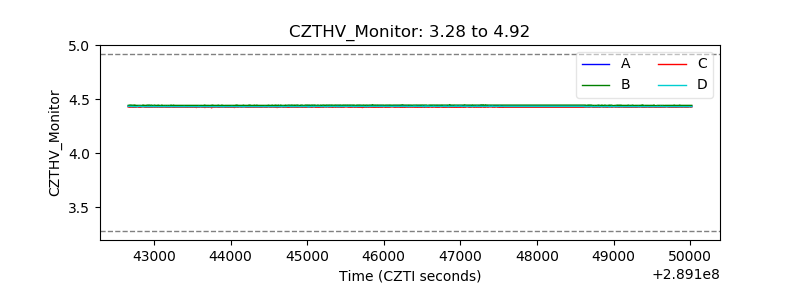 |
| D_VDD | 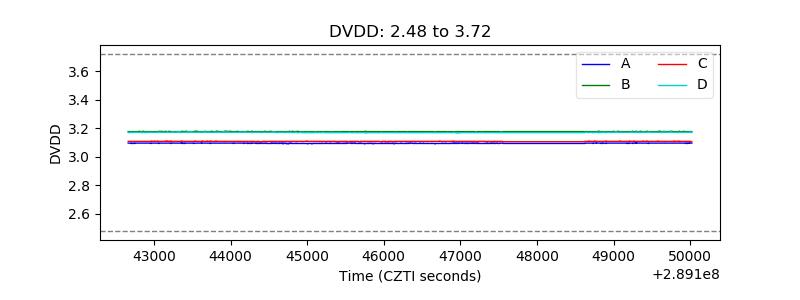 |
| Temperature 1 | 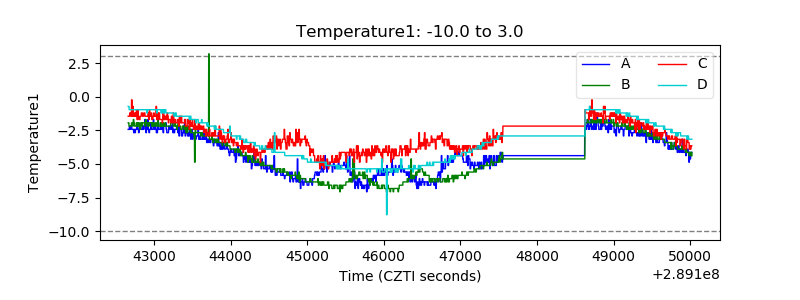 |
| Veto HV Monitor | 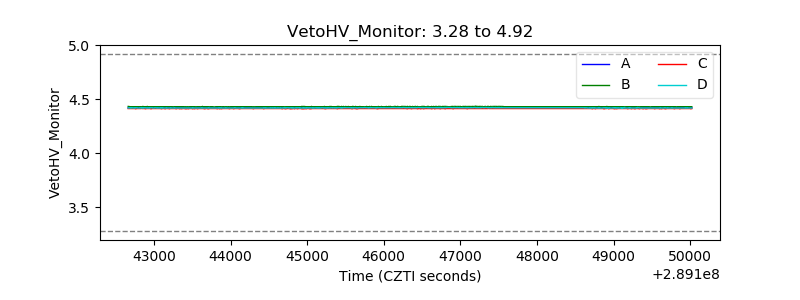 |
| Veto LLD | 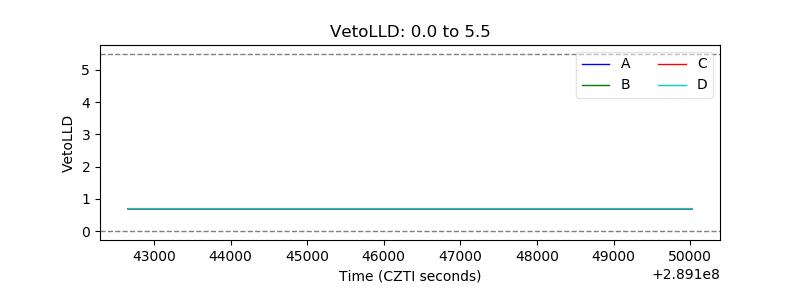 |
| Alpha Counter | 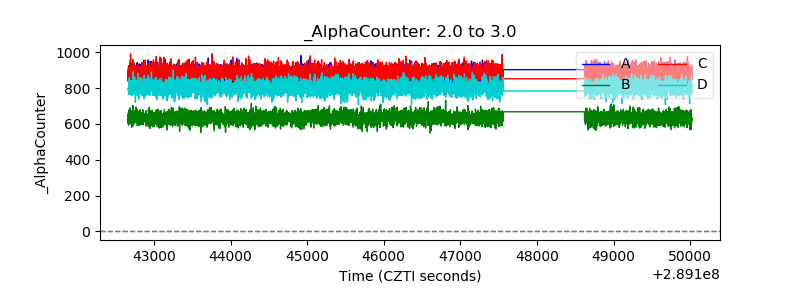 |
| _CPM_Rate | 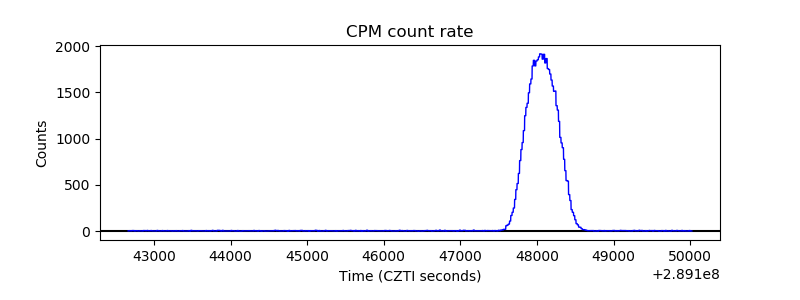 |
| CZT Counter | 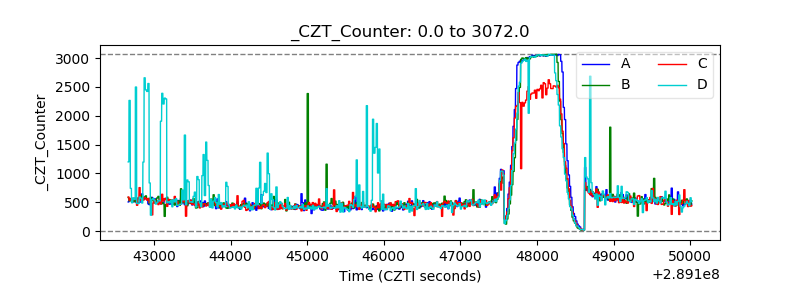 |
| +2.5 Volts monitor | 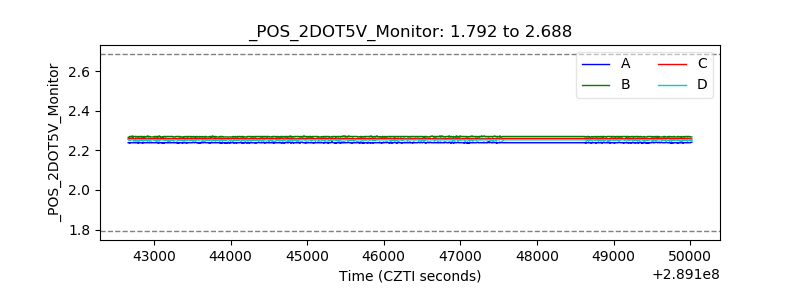 |
| +5 Volts monitor | 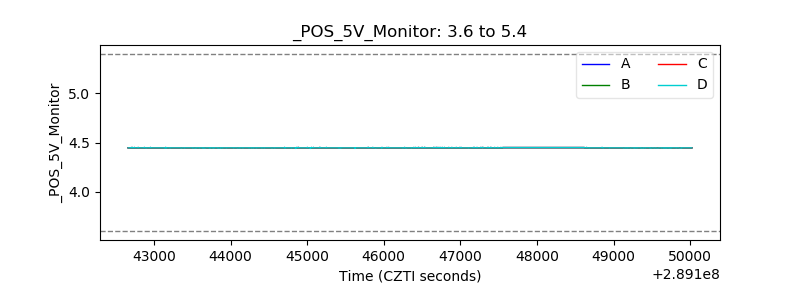 |
| _ROLL_ROT | 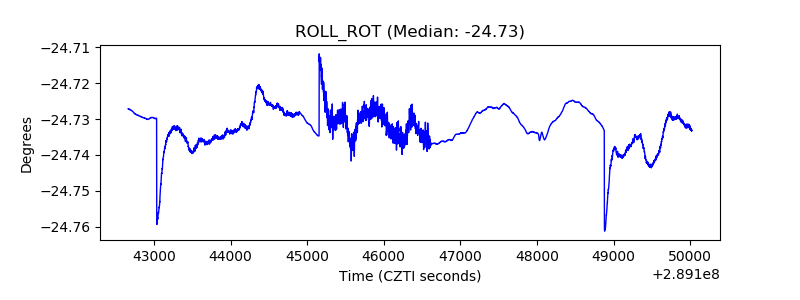 |
| _Roll_DEC | 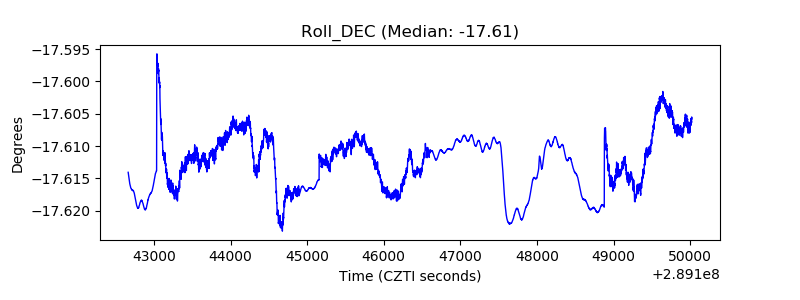 |
| _Roll_RA | 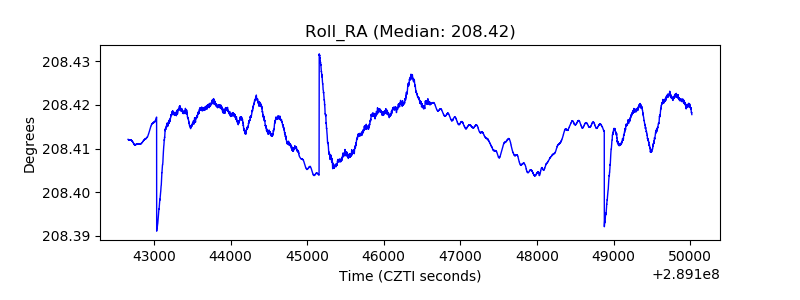 |
| Veto Counter | 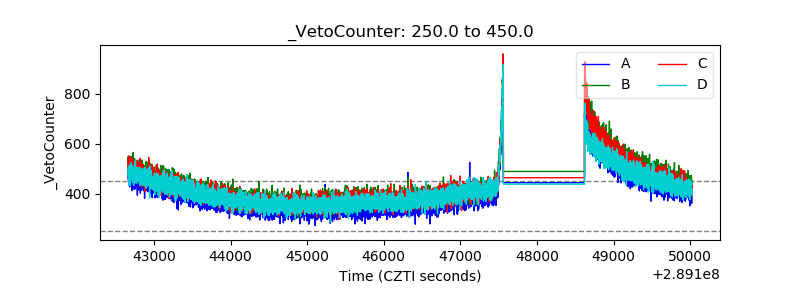 |