| Param | Original file | Final file |
|---|---|---|
| Filename | modeM0/AS1A05_212T07_9000002746_18510cztM0_level2.evt | modeM0/AS1A05_212T07_9000002746_18510cztM0_level2_quad_clean.evt |
| Size (bytes) | 458,844,480 | 83,845,440 |
| Size | 437.6 MB | 80.0 MB |
| Events in quadrant A | 3,399,953 | 526,961 |
| Events in quadrant B | 3,338,708 | 538,437 |
| Events in quadrant C | 3,263,597 | 517,460 |
| Events in quadrant D | 3,455,694 | 506,131 |
| Mode M9 | |||
|---|---|---|---|
| Quadrant | BADHDUFLAG | Total packets | Discarded packets |
| A | 0 | 19 | 0 |
| B | 0 | 20 | 0 |
| C | 0 | 20 | 0 |
| D | 0 | 20 | 0 |
| Mode M0 | |||
|---|---|---|---|
| Quadrant | BADHDUFLAG | Total packets | Discarded packets |
| A | 0 | 14394 | 2 |
| B | 0 | 14153 | 2 |
| C | 0 | 13860 | 2 |
| D | 0 | 14537 | 2 |
| Mode SS | |||
|---|---|---|---|
| Quadrant | BADHDUFLAG | Total packets | Discarded packets |
| A | 0 | 132 | 0 |
| B | 0 | 132 | 0 |
| C | 0 | 132 | 0 |
| D | 0 | 132 | 0 |
| Quadrant | Total seconds | Saturated seconds | Saturation percentage |
|---|---|---|---|
| A | 6447 | 72 | 1.116799% |
| B | 6447 | 88 | 1.364976% |
| C | 6447 | 96 | 1.489065% |
| D | 6447 | 81 | 1.256398% |
Noise dominated data is calculated using 1-second bins in cleaned event files. If a bin has >2000 counts, and if more than 50% of those come from <1% of pixels, then it is considered to be noise-dominated and hence unusable.
| Quadrant | # 1 sec bins | Bins with >0 counts | Bins with >2000 counts | High rate bins dominated by noise | Noise dominated (total time) | Noise dominated (detector-on time) | Marked lightcurve |
|---|---|---|---|---|---|---|---|
| A | 7612 | 6447 | 11 | 11 | 0.14% | 0.17% | 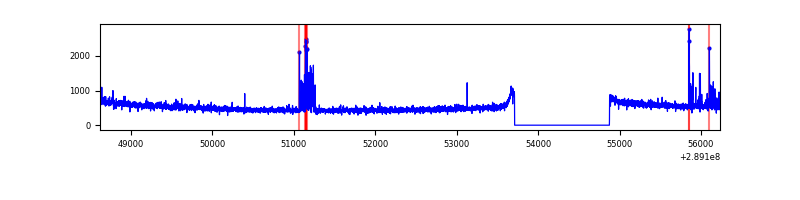 |
| B | 7612 | 6447 | 5 | 5 | 0.07% | 0.08% | 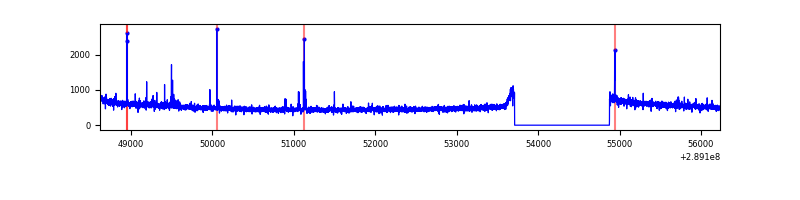 |
| C | 7612 | 6447 | 0 | 0 | 0.00% | 0.00% | 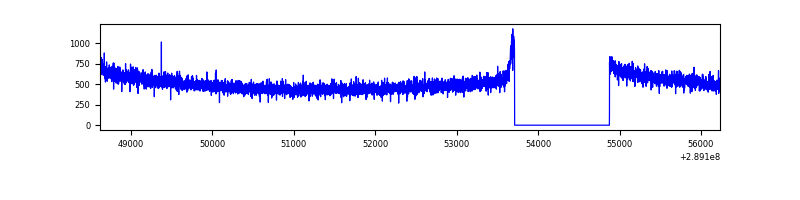 |
| D | 7612 | 6447 | 8 | 8 | 0.11% | 0.12% | 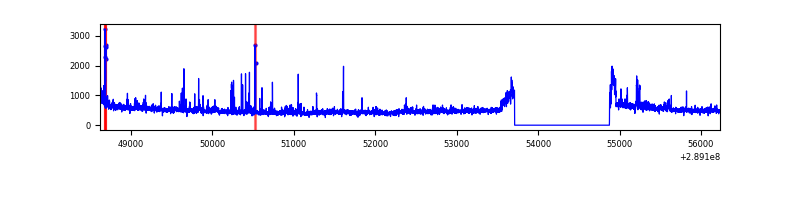 |
Top three noisy pixels from each quadrant. If the there are fewer than three noisy pixels in the level2.evt file, extra rows are filled as -1
| Pixel properties | Quadrant properties | ||||||
|---|---|---|---|---|---|---|---|
| Quadrant | DetID | PixID | Counts | Sigma | Mean | Median | Sigma |
| A | 0 | 13 | 151160 | 889.05 | 840 | 824 | 169.1 |
| A | 13 | 254 | 9334 | 50.33 | 840 | 824 | 169.1 |
| A | 4 | 2 | 8184 | 43.53 | 840 | 824 | 169.1 |
| B | 12 | 111 | 18356 | 111.68 | 841 | 824 | 157.0 |
| B | 11 | 111 | 15751 | 95.09 | 841 | 824 | 157.0 |
| B | 0 | 230 | 15745 | 95.05 | 841 | 824 | 157.0 |
| C | 14 | 238 | 125168 | 660.82 | 804 | 810 | 188.2 |
| C | 13 | 61 | 5701 | 25.99 | 804 | 810 | 188.2 |
| C | 3 | 233 | 4010 | 17.0 | 804 | 810 | 188.2 |
| D | 1 | 52 | 214510 | 1089.09 | 809 | 787 | 196.2 |
| D | 7 | 238 | 74320 | 374.71 | 809 | 787 | 196.2 |
| D | 13 | 168 | 65306 | 328.78 | 809 | 787 | 196.2 |
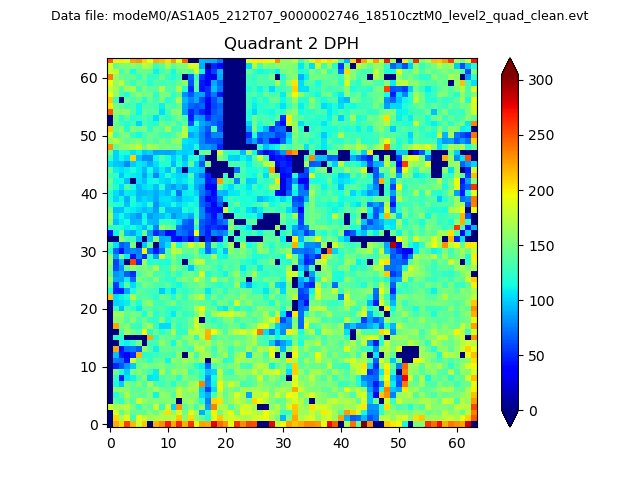
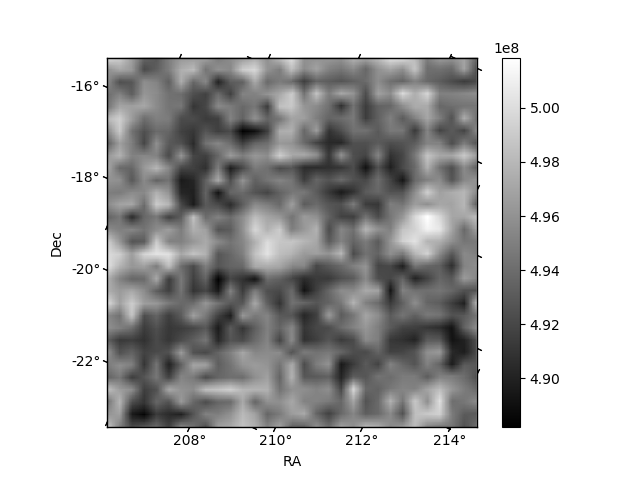
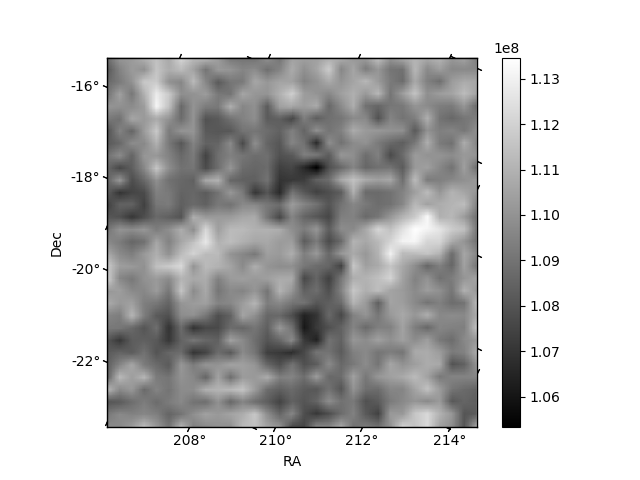
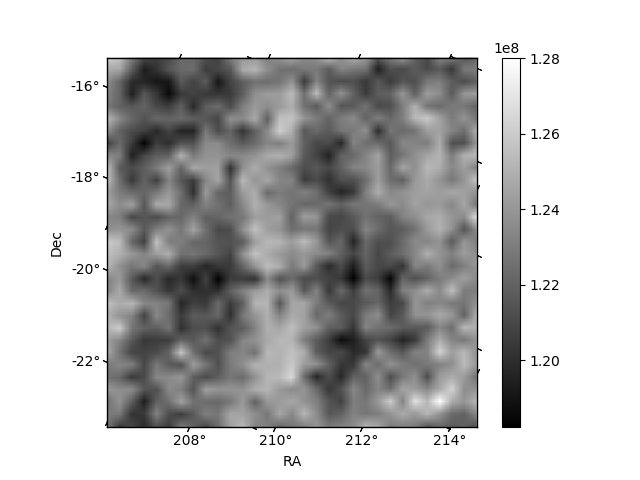
Histogram calculated using DETX and DETY for each event in the final _common_clean file
| Quadrant A | 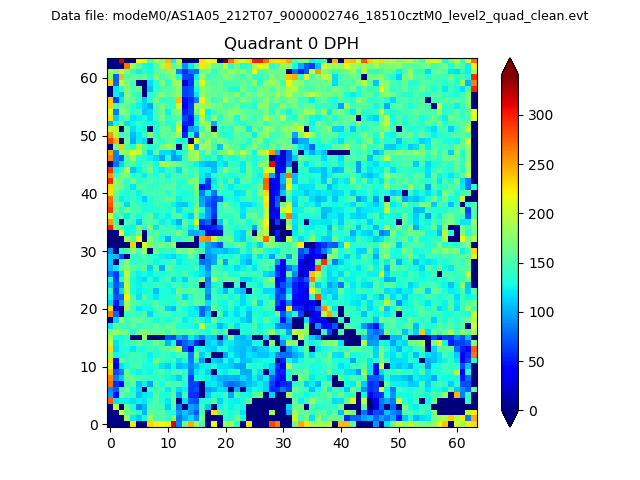 |
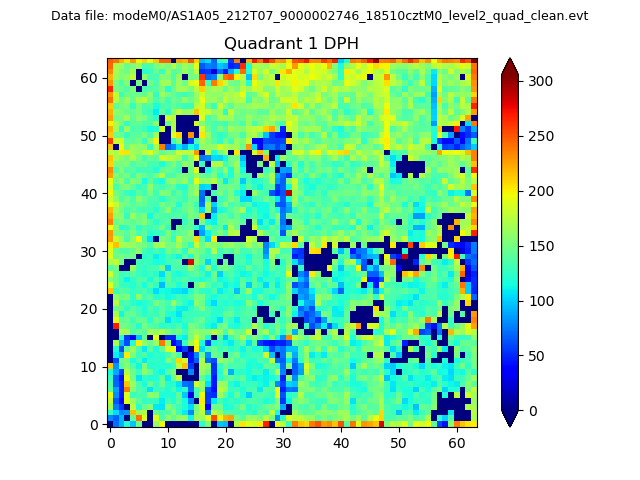 |
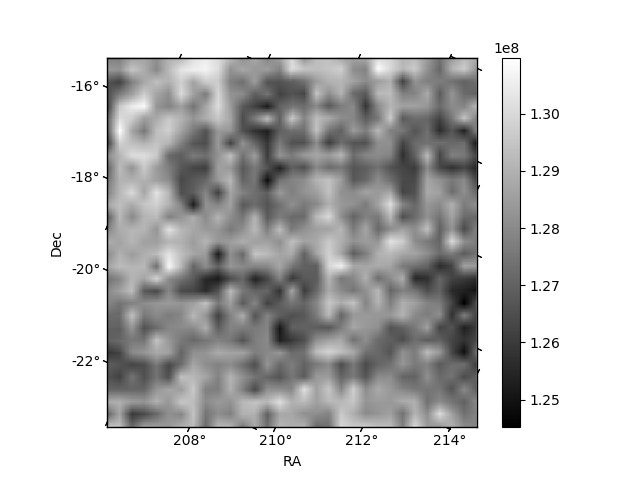
Quadrant B |
|---|---|---|---|
| Quadrant D | 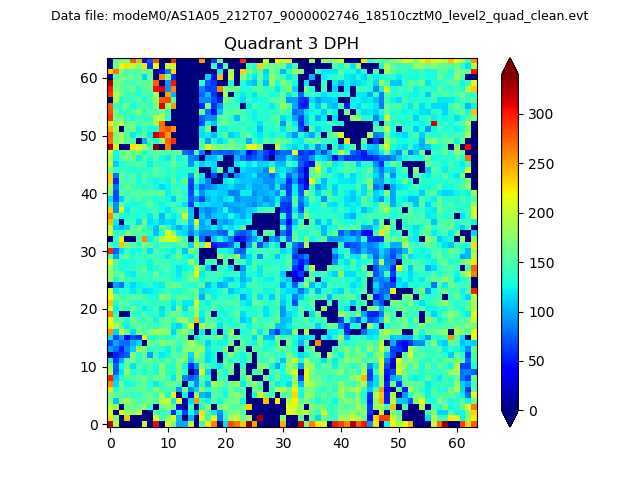 |
 |
Quadrant C |
| Plot type | Count rate plots | Images |
|---|---|---|
| Comparison with Poisson distribution Blue bars denote a histogram of data divided into 1 sec bins. Red curve is a Poisson curve with rate = median count rate of data. |
 |
 |
| Quadrant-wise count rates Data is divided into 100 sec bins |
 |
|
| Module-wise count rates for Quadrant A Data is divided into 100 sec bins |
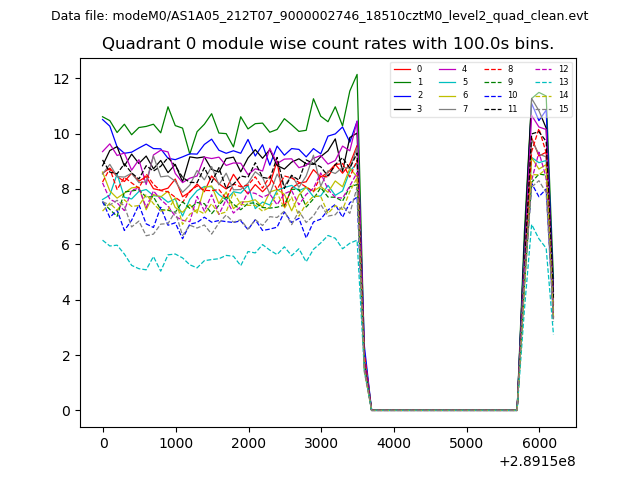 |
 |
| Module-wise count rates for Quadrant B Data is divided into 100 sec bins |
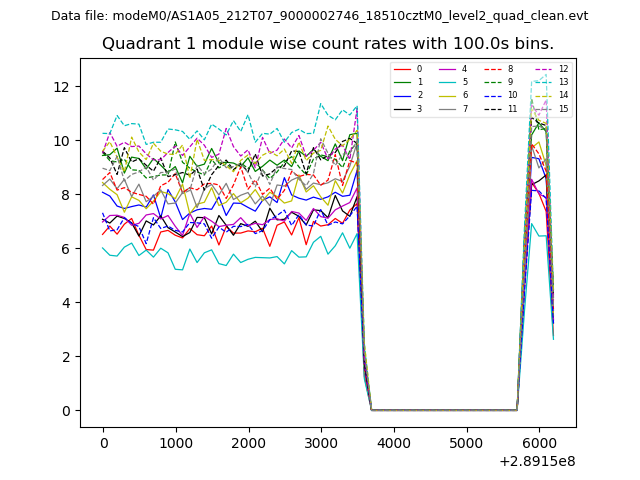 |
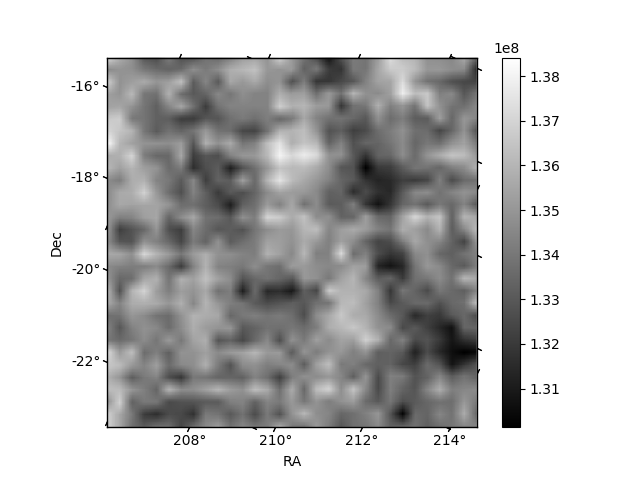 |
| Module-wise count rates for Quadrant C Data is divided into 100 sec bins |
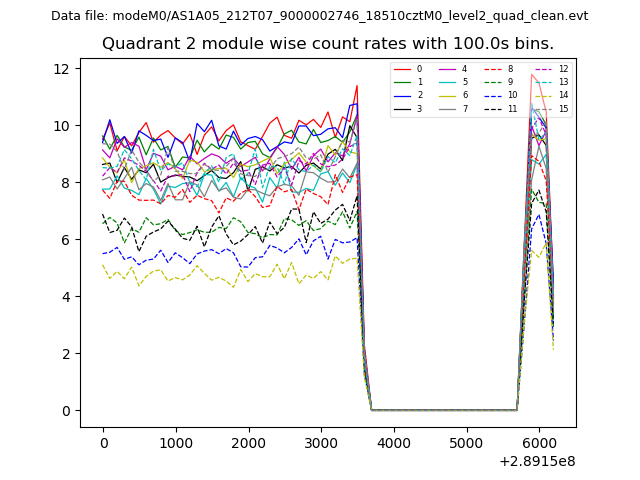 |
 |
| Module-wise count rates for Quadrant D Data is divided into 100 sec bins |
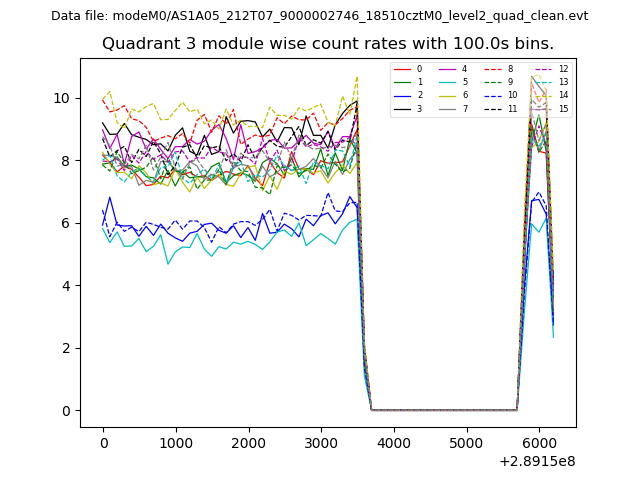 |
 |
| Parameter | Plot |
|---|---|
| CZT HV Monitor | 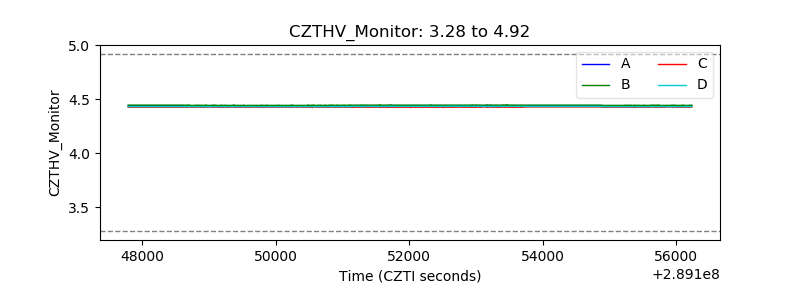 |
| D_VDD | 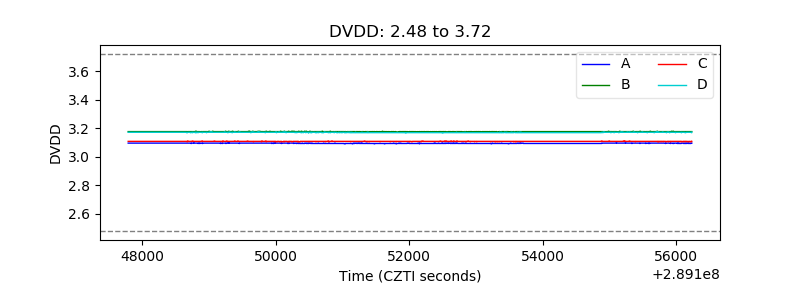 |
| Temperature 1 | 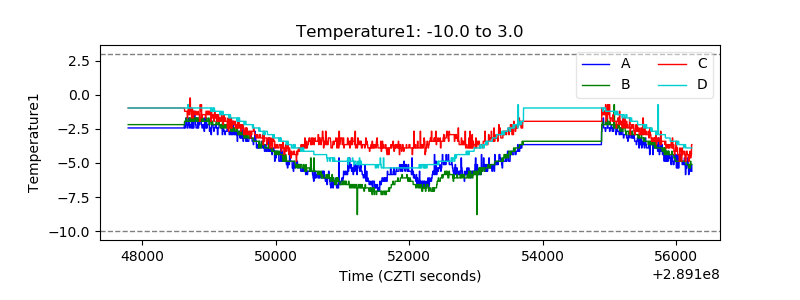 |
| Veto HV Monitor | 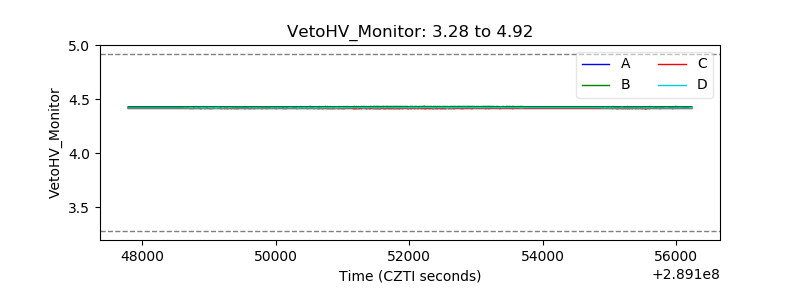 |
| Veto LLD | 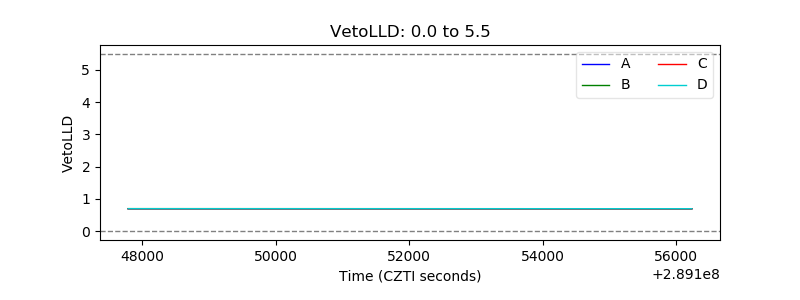 |
| Alpha Counter |  |
| _CPM_Rate |  |
| CZT Counter | 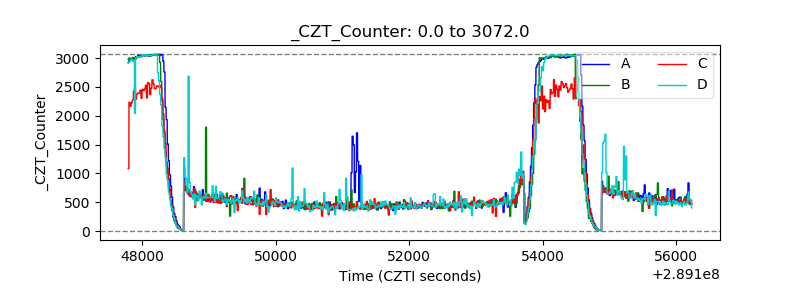 |
| +2.5 Volts monitor |  |
| +5 Volts monitor |  |
| _ROLL_ROT | 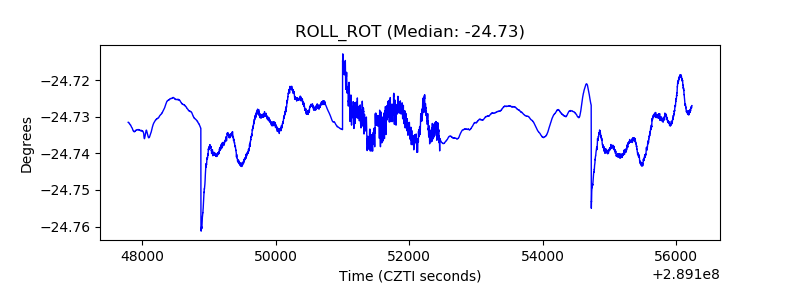 |
| _Roll_DEC | 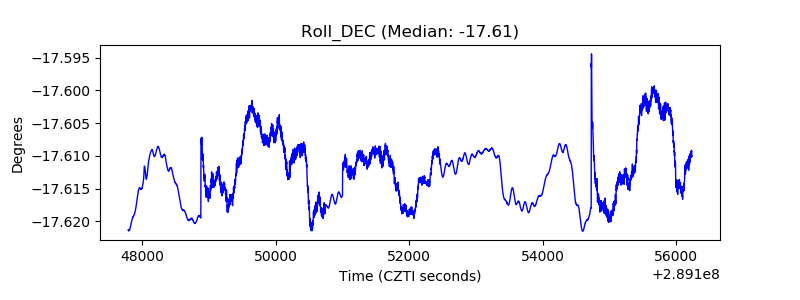 |
| _Roll_RA | 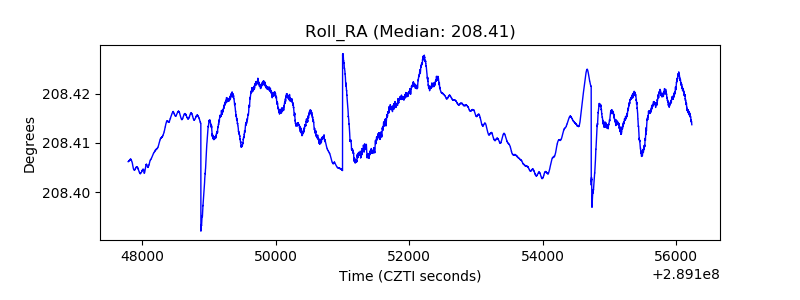 |
| Veto Counter | 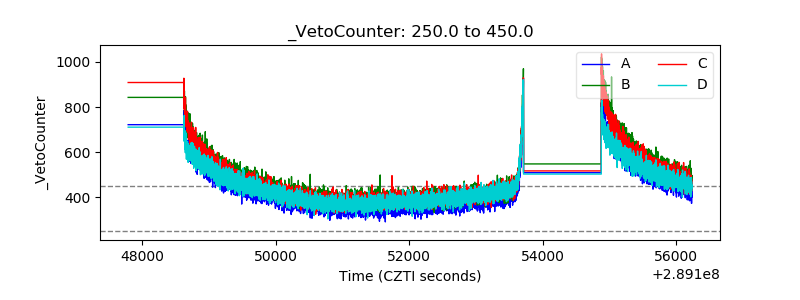 |