| Param | Original file | Final file |
|---|---|---|
| Filename | modeM0/AS1A05_082T12_9000002754cztM0_level2.fits | modeM0/AS1A05_082T12_9000002754cztM0_level2_quad_clean.evt |
| Size (bytes) | 196,165,440 | 171,751,680 |
| Size | 187.1 MB | 163.8 MB |
| Events in quadrant A | 1,139,718 | 906,947 |
| Events in quadrant B | 1,201,524 | 1,047,813 |
| Events in quadrant C | 1,233,796 | 1,016,005 |
| Events in quadrant D | 1,015,102 | 881,014 |
| Mode SS | |||
|---|---|---|---|
| Quadrant | BADHDUFLAG | Total packets | Discarded packets |
| A | 0 | 402 | 0 |
| B | 0 | 402 | 0 |
| C | 0 | 402 | 0 |
| D | 0 | 402 | 0 |
| Mode M9 | |||
|---|---|---|---|
| Quadrant | BADHDUFLAG | Total packets | Discarded packets |
| A | 0 | 48 | 0 |
| B | 0 | 48 | 0 |
| C | 0 | 48 | 0 |
| D | 0 | 48 | 0 |
| Mode M0 | |||
|---|---|---|---|
| Quadrant | BADHDUFLAG | Total packets | Discarded packets |
| A | 0 | 68098 | 0 |
| B | 0 | 43736 | 0 |
| C | 0 | 41473 | 0 |
| D | 0 | 68927 | 0 |
| Quadrant | Total seconds | Saturated seconds | Saturation percentage |
|---|---|---|---|
| A | 19567 | 3151 | 16.103644% |
| B | 19567 | 458 | 2.340676% |
| C | 19567 | 309 | 1.579189% |
| D | 19567 | 2464 | 12.592630% |
Noise dominated data is calculated using 1-second bins in cleaned event files. If a bin has >2000 counts, and if more than 50% of those come from <1% of pixels, then it is considered to be noise-dominated and hence unusable.
| Quadrant | # 1 sec bins | Bins with >0 counts | Bins with >2000 counts | High rate bins dominated by noise | Noise dominated (total time) | Noise dominated (detector-on time) | Marked lightcurve |
|---|---|---|---|---|---|---|---|
| A | 24447 | 19530 | 0 | 0 | 0.00% | 0.00% |  |
| B | 24447 | 19564 | 0 | 0 | 0.00% | 0.00% |  |
| C | 24447 | 19567 | 0 | 0 | 0.00% | 0.00% |  |
| D | 24447 | 19563 | 0 | 0 | 0.00% | 0.00% |  |
Top three noisy pixels from each quadrant. If the there are fewer than three noisy pixels in the level2.evt file, extra rows are filled as -1
| Pixel properties | Quadrant properties | ||||||
|---|---|---|---|---|---|---|---|
| Quadrant | DetID | PixID | Counts | Sigma | Mean | Median | Sigma |
| A | 0 | 29 | 933 | 8.73 | 297 | 280 | 74.8 |
| A | 7 | 110 | 932 | 8.72 | 297 | 280 | 74.8 |
| A | 9 | 19 | 850 | 7.62 | 297 | 280 | 74.8 |
| B | 2 | 9 | 996 | 10.66 | 317 | 303 | 65.0 |
| B | 5 | 128 | 819 | 7.94 | 317 | 303 | 65.0 |
| B | 2 | 8 | 789 | 7.48 | 317 | 303 | 65.0 |
| C | 1 | 81 | 948 | 7.6 | 325 | 305 | 84.7 |
| C | 1 | 80 | 932 | 7.41 | 325 | 305 | 84.7 |
| C | 9 | 242 | 851 | 6.45 | 325 | 305 | 84.7 |
| D | 10 | 190 | 785 | 6.63 | 289 | 264 | 78.6 |
| D | 6 | 231 | 758 | 6.29 | 289 | 264 | 78.6 |
| D | 3 | 14 | 734 | 5.98 | 289 | 264 | 78.6 |
Histogram calculated using DETX and DETY for each event in the final _common_clean file
| Quadrant A | 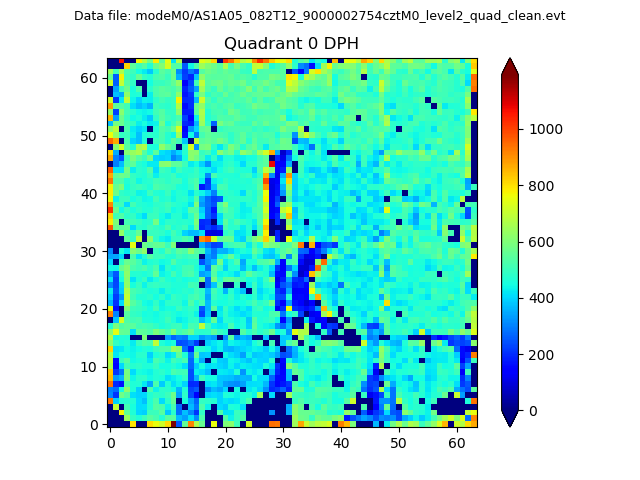 |
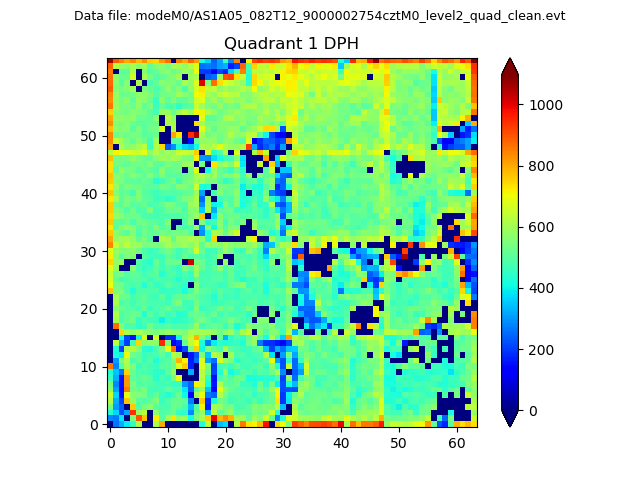 |
Quadrant B |
|---|---|---|---|
| Quadrant D |  |
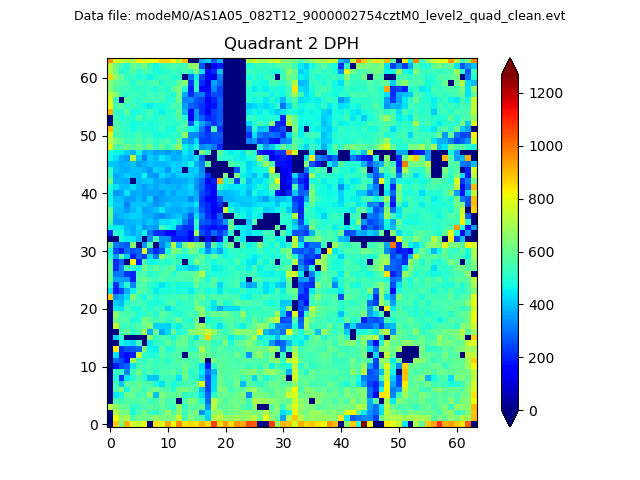 |
Quadrant C |
| Plot type | Count rate plots | Images |
|---|---|---|
| Comparison with Poisson distribution Blue bars denote a histogram of data divided into 1 sec bins. Red curve is a Poisson curve with rate = median count rate of data. |
 |
 |
| Quadrant-wise count rates Data is divided into 100 sec bins |
 |
|
| Module-wise count rates for Quadrant A Data is divided into 100 sec bins |
 |
 |
| Module-wise count rates for Quadrant B Data is divided into 100 sec bins |
 |
 |
| Module-wise count rates for Quadrant C Data is divided into 100 sec bins |
 |
 |
| Module-wise count rates for Quadrant D Data is divided into 100 sec bins |
 |
 |
| Parameter | Plot |
|---|---|
| CZT HV Monitor |  |
| D_VDD |  |
| Temperature 1 |  |
| Veto HV Monitor |  |
| Veto LLD |  |
| Alpha Counter |  |
| _CPM_Rate |  |
| CZT Counter |  |
| +2.5 Volts monitor |  |
| +5 Volts monitor |  |
| _ROLL_ROT | 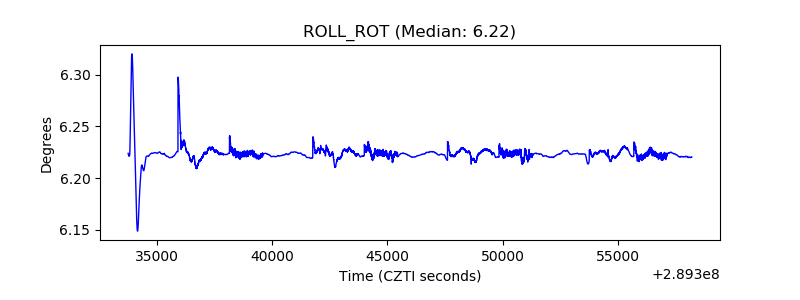 |
| _Roll_DEC |  |
| _Roll_RA |  |
| Veto Counter |  |