| Param | Original file | Final file |
|---|---|---|
| Filename | modeM0/AS1A05_082T12_9000002754_18541cztM0_level2.evt | modeM0/AS1A05_082T12_9000002754_18541cztM0_level2_quad_clean.evt |
| Size (bytes) | 286,056,000 | 42,085,440 |
| Size | 272.8 MB | 40.1 MB |
| Events in quadrant A | 2,314,958 | 262,041 |
| Events in quadrant B | 1,684,774 | 281,585 |
| Events in quadrant C | 1,552,718 | 272,095 |
| Events in quadrant D | 2,919,599 | 258,413 |
| Mode SS | |||
|---|---|---|---|
| Quadrant | BADHDUFLAG | Total packets | Discarded packets |
| A | 0 | 60 | 0 |
| B | 0 | 60 | 0 |
| C | 0 | 60 | 0 |
| D | 0 | 60 | 0 |
| Mode M9 | |||
|---|---|---|---|
| Quadrant | BADHDUFLAG | Total packets | Discarded packets |
| A | 0 | 13 | 0 |
| B | 0 | 13 | 0 |
| C | 0 | 13 | 0 |
| D | 0 | 13 | 0 |
| Mode M0 | |||
|---|---|---|---|
| Quadrant | BADHDUFLAG | Total packets | Discarded packets |
| A | 0 | 8726 | 1 |
| B | 0 | 6822 | 1 |
| C | 0 | 6369 | 1 |
| D | 0 | 10562 | 1 |
| Quadrant | Total seconds | Saturated seconds | Saturation percentage |
|---|---|---|---|
| A | 2790 | 315 | 11.290323% |
| B | 2790 | 87 | 3.118280% |
| C | 2790 | 68 | 2.437276% |
| D | 2790 | 436 | 15.627240% |
Noise dominated data is calculated using 1-second bins in cleaned event files. If a bin has >2000 counts, and if more than 50% of those come from <1% of pixels, then it is considered to be noise-dominated and hence unusable.
| Quadrant | # 1 sec bins | Bins with >0 counts | Bins with >2000 counts | High rate bins dominated by noise | Noise dominated (total time) | Noise dominated (detector-on time) | Marked lightcurve |
|---|---|---|---|---|---|---|---|
| A | 4145 | 2790 | 161 | 161 | 3.88% | 5.77% | 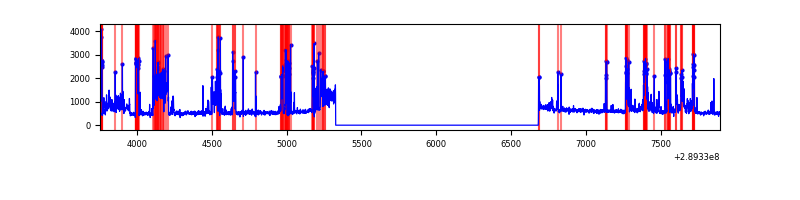 |
| B | 4145 | 2790 | 10 | 10 | 0.24% | 0.36% | 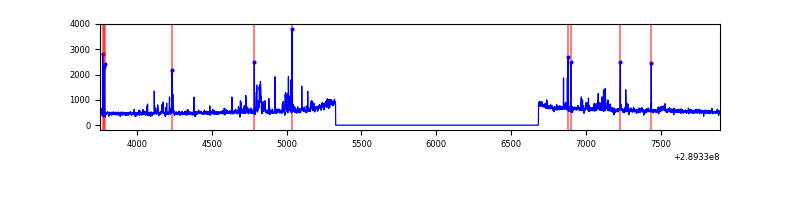 |
| C | 4145 | 2791 | 0 | 0 | 0.00% | 0.00% | 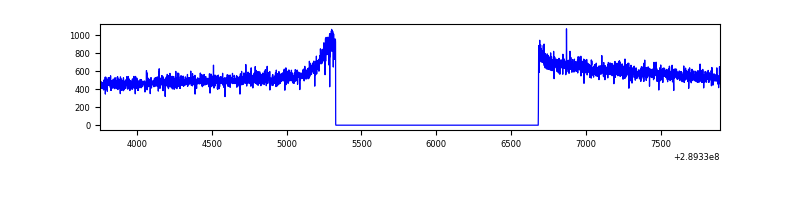 |
| D | 4145 | 2790 | 287 | 287 | 6.92% | 10.29% | 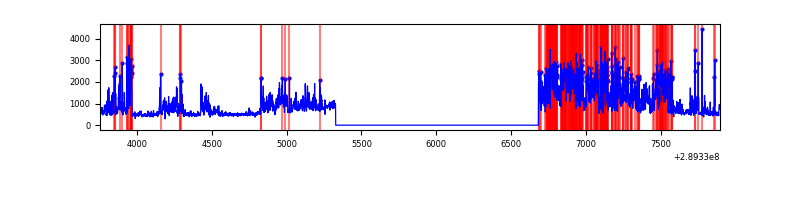 |
Top three noisy pixels from each quadrant. If the there are fewer than three noisy pixels in the level2.evt file, extra rows are filled as -1
| Pixel properties | Quadrant properties | ||||||
|---|---|---|---|---|---|---|---|
| Quadrant | DetID | PixID | Counts | Sigma | Mean | Median | Sigma |
| A | 0 | 13 | 814107 | 10403.35 | 379 | 371 | 78.2 |
| A | 13 | 210 | 30180 | 381.1 | 379 | 371 | 78.2 |
| A | 15 | 174 | 9228 | 113.23 | 379 | 371 | 78.2 |
| B | 3 | 64 | 96875 | 1271.35 | 394 | 386 | 75.9 |
| B | 4 | 80 | 20308 | 262.49 | 394 | 386 | 75.9 |
| B | 0 | 197 | 12497 | 159.58 | 394 | 386 | 75.9 |
| C | 14 | 238 | 59889 | 661.45 | 382 | 386 | 90.0 |
| C | 13 | 61 | 2693 | 25.65 | 382 | 386 | 90.0 |
| C | 14 | 111 | 983 | 6.64 | 382 | 386 | 90.0 |
| D | 7 | 238 | 1172146 | 12794.64 | 372 | 363 | 91.6 |
| D | 13 | 153 | 178992 | 1950.44 | 372 | 363 | 91.6 |
| D | 1 | 52 | 133480 | 1453.5 | 372 | 363 | 91.6 |
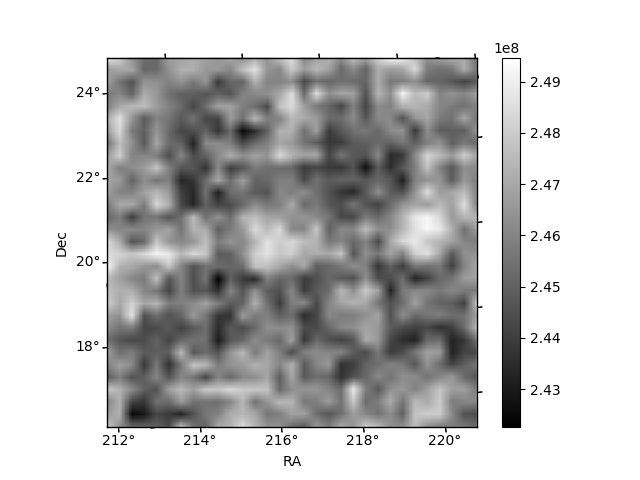
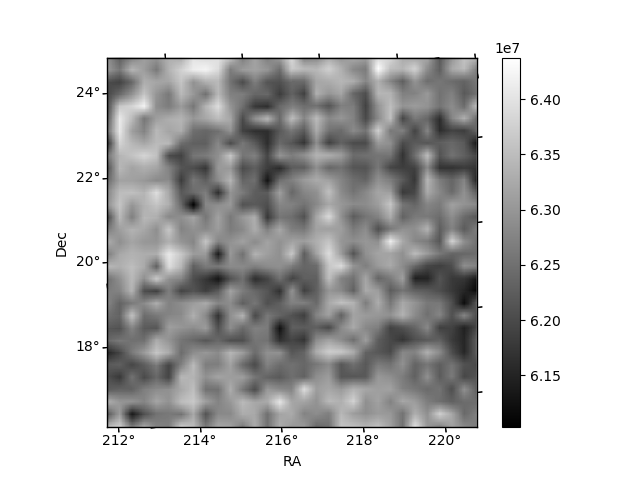
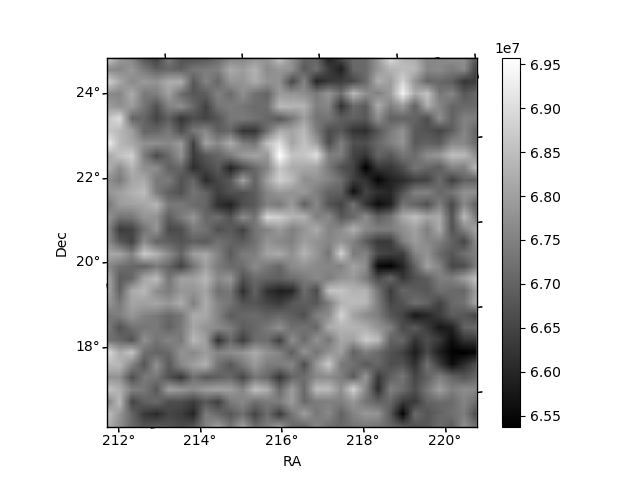
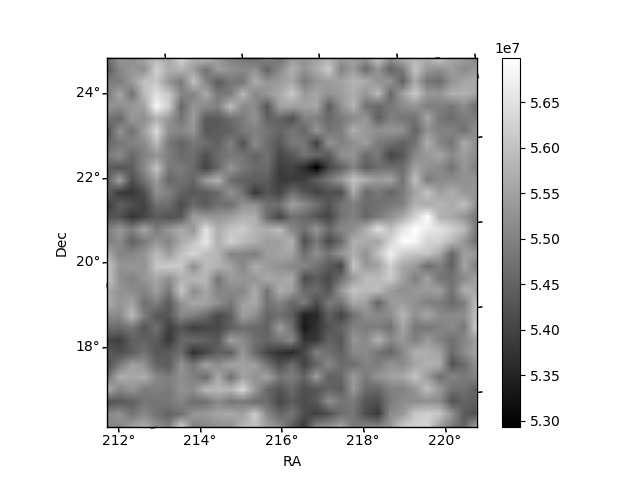
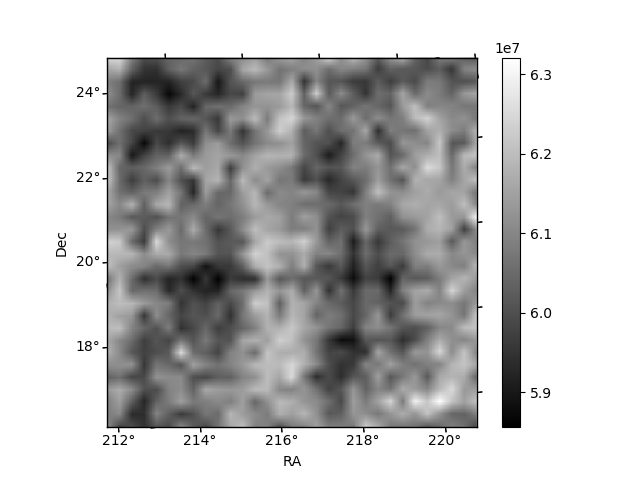
Histogram calculated using DETX and DETY for each event in the final _common_clean file
| Quadrant A | 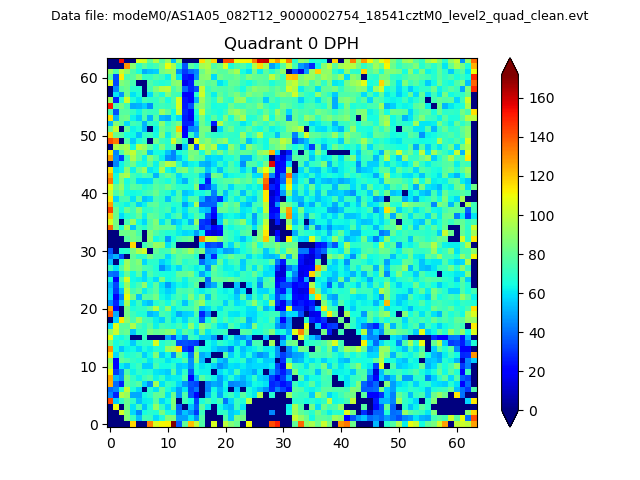 |
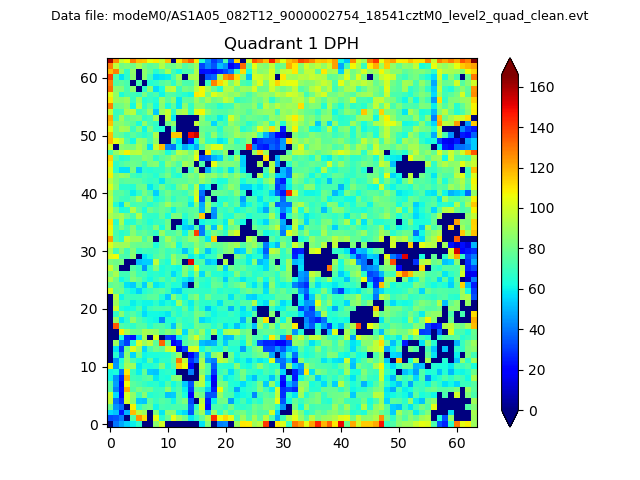 |
Quadrant B |
|---|---|---|---|
| Quadrant D | 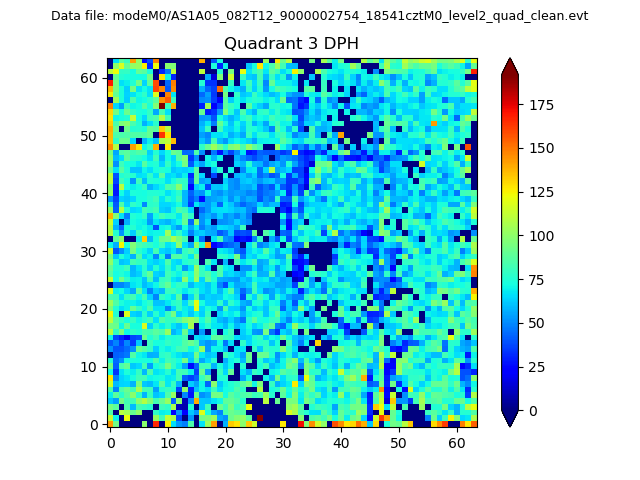 |
 |
Quadrant C |
| Plot type | Count rate plots | Images |
|---|---|---|
| Comparison with Poisson distribution Blue bars denote a histogram of data divided into 1 sec bins. Red curve is a Poisson curve with rate = median count rate of data. |
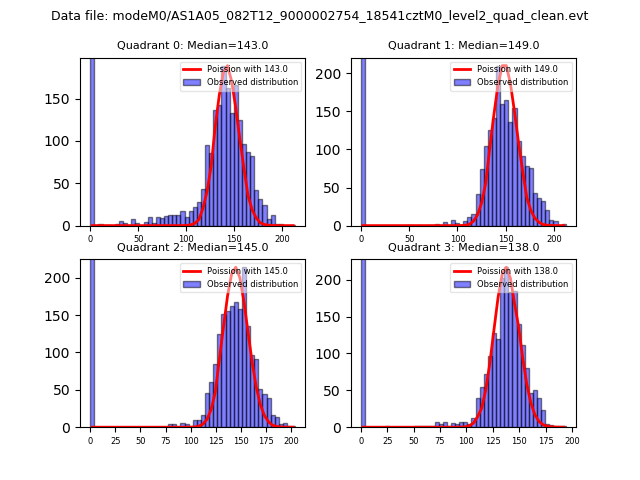 |
 |
| Quadrant-wise count rates Data is divided into 100 sec bins |
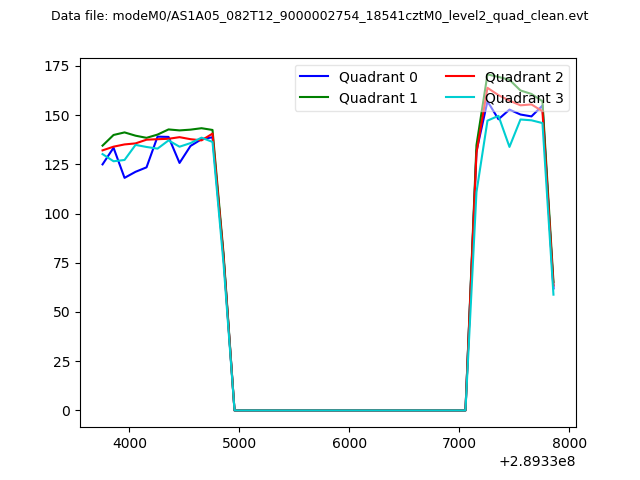 |
|
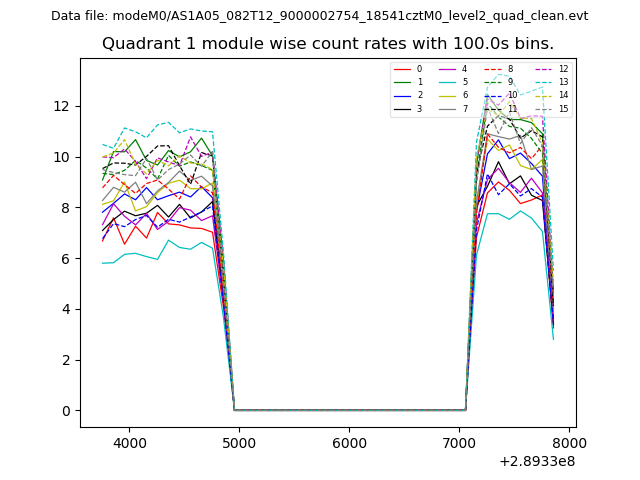
| Module-wise count rates for Quadrant A Data is divided into 100 sec bins |
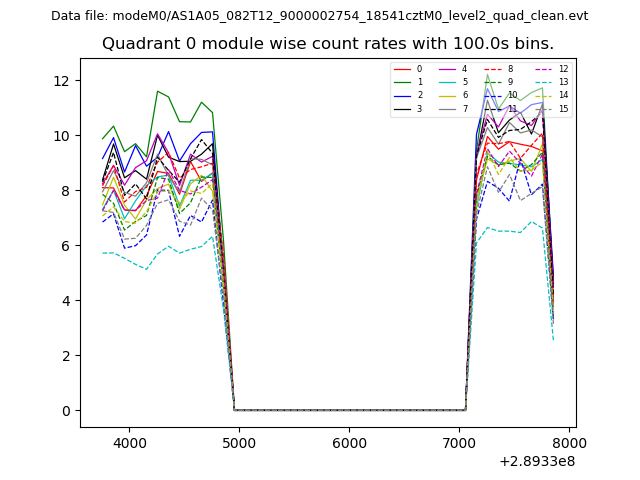 |
 |
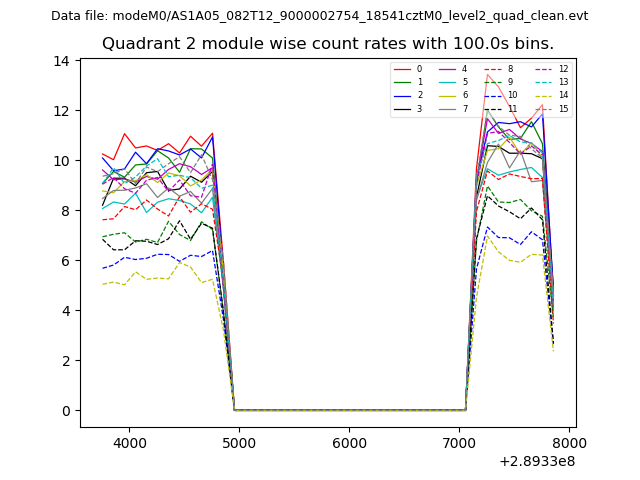
| Module-wise count rates for Quadrant B Data is divided into 100 sec bins |
 |
 |
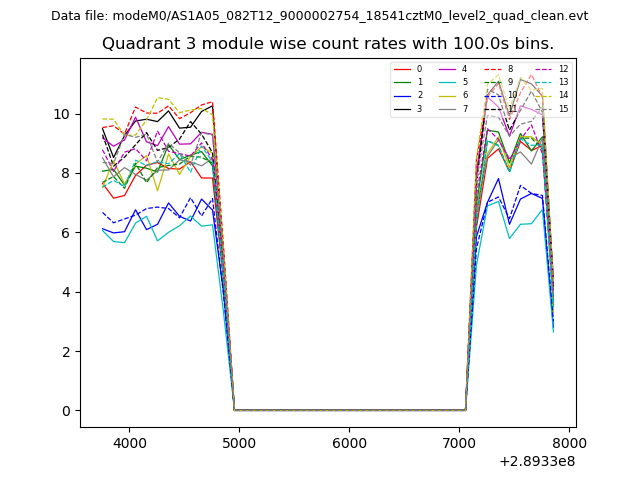
| Module-wise count rates for Quadrant C Data is divided into 100 sec bins |
 |
 |
| Module-wise count rates for Quadrant D Data is divided into 100 sec bins |
 |
 |
| Parameter | Plot |
|---|---|
| CZT HV Monitor | 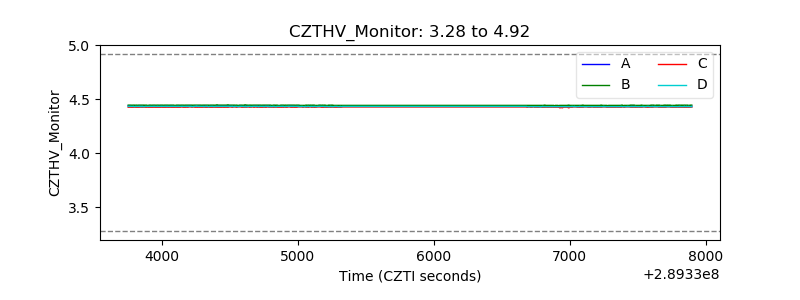 |
| D_VDD | 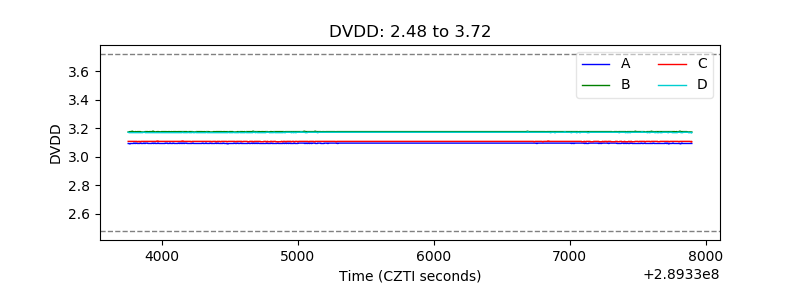 |
| Temperature 1 | 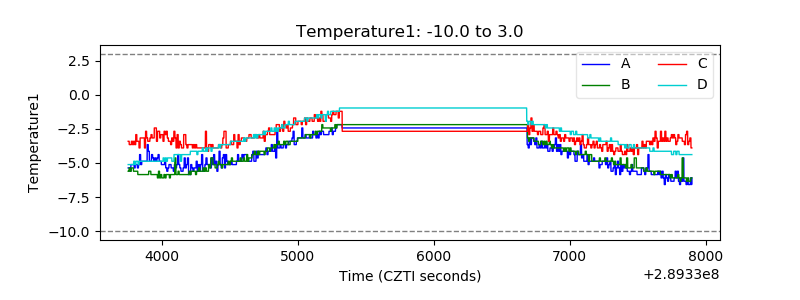 |
| Veto HV Monitor | 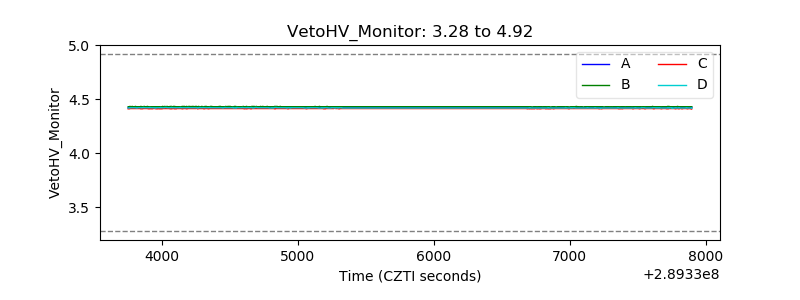 |
| Veto LLD | 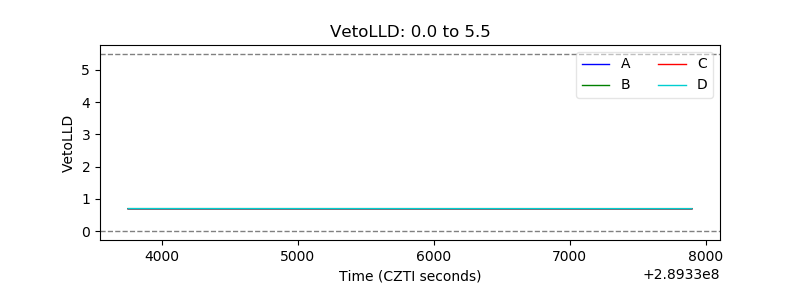 |
| Alpha Counter | 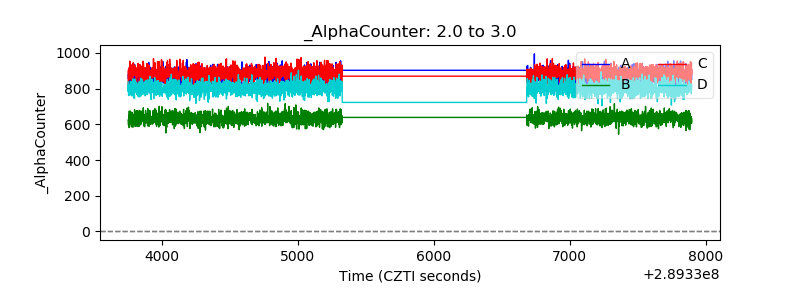 |
| _CPM_Rate | 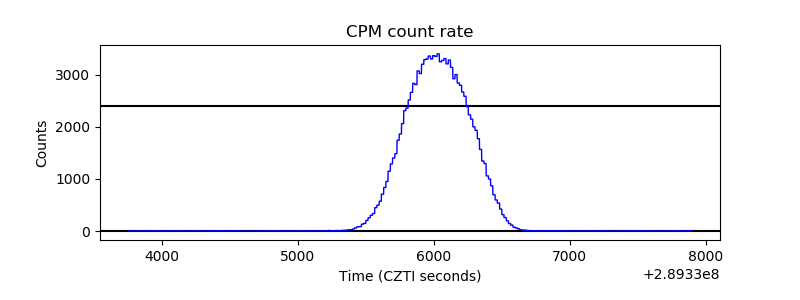 |
| CZT Counter | 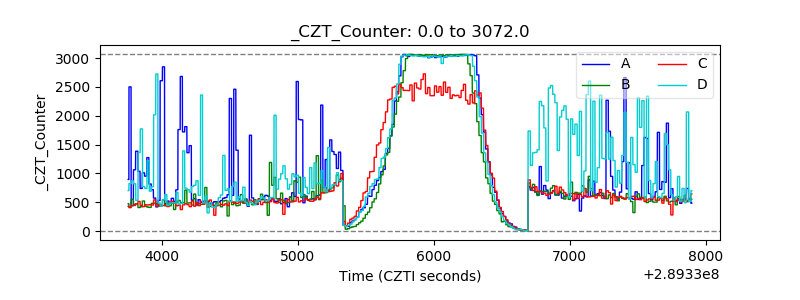 |
| +2.5 Volts monitor |  |
| +5 Volts monitor | 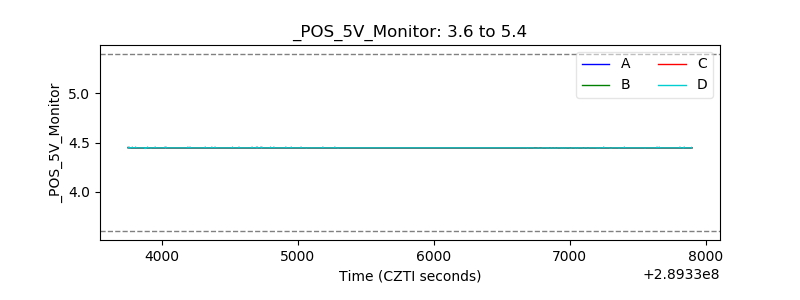 |
| _ROLL_ROT | 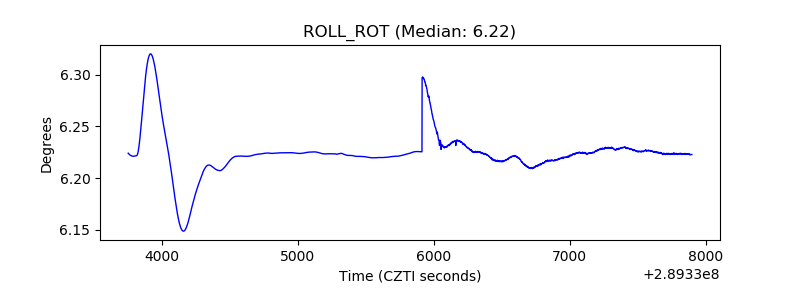 |
| _Roll_DEC | 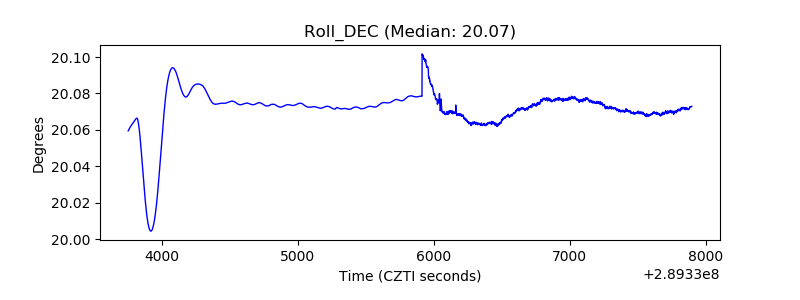 |
| _Roll_RA | 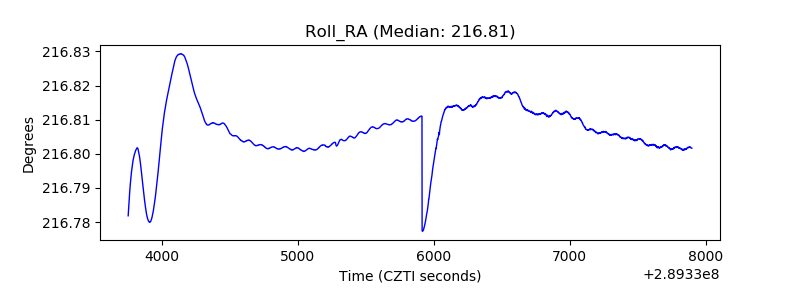 |
| Veto Counter | 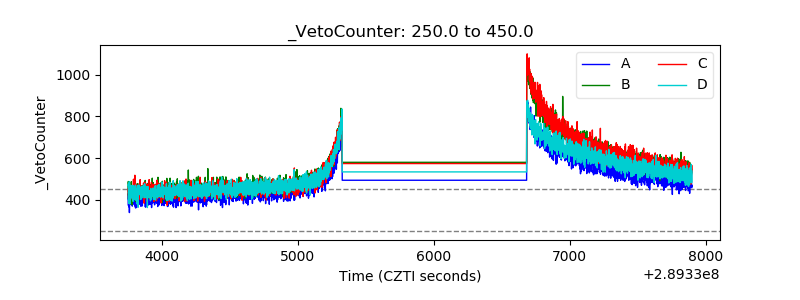 |