| Param | Original file | Final file |
|---|---|---|
| Filename | modeM0/AS1A05_082T12_9000002754_18542cztM0_level2.evt | modeM0/AS1A05_082T12_9000002754_18542cztM0_level2_quad_clean.evt |
| Size (bytes) | 650,787,840 | 104,276,160 |
| Size | 620.6 MB | 99.4 MB |
| Events in quadrant A | 6,231,026 | 649,607 |
| Events in quadrant B | 3,499,080 | 724,719 |
| Events in quadrant C | 3,261,002 | 701,121 |
| Events in quadrant D | 6,299,639 | 650,242 |
| Mode SS | |||
|---|---|---|---|
| Quadrant | BADHDUFLAG | Total packets | Discarded packets |
| A | 0 | 124 | 0 |
| B | 0 | 124 | 0 |
| C | 0 | 124 | 0 |
| D | 0 | 124 | 0 |
| Mode M9 | |||
|---|---|---|---|
| Quadrant | BADHDUFLAG | Total packets | Discarded packets |
| A | 0 | 14 | 0 |
| B | 0 | 14 | 0 |
| C | 0 | 14 | 0 |
| D | 0 | 14 | 0 |
| Mode M0 | |||
|---|---|---|---|
| Quadrant | BADHDUFLAG | Total packets | Discarded packets |
| A | 0 | 22686 | 1 |
| B | 0 | 14248 | 1 |
| C | 0 | 13532 | 1 |
| D | 0 | 22981 | 1 |
| Quadrant | Total seconds | Saturated seconds | Saturation percentage |
|---|---|---|---|
| A | 6193 | 1029 | 16.615534% |
| B | 6194 | 110 | 1.775912% |
| C | 6194 | 92 | 1.485308% |
| D | 6194 | 889 | 14.352599% |
Noise dominated data is calculated using 1-second bins in cleaned event files. If a bin has >2000 counts, and if more than 50% of those come from <1% of pixels, then it is considered to be noise-dominated and hence unusable.
| Quadrant | # 1 sec bins | Bins with >0 counts | Bins with >2000 counts | High rate bins dominated by noise | Noise dominated (total time) | Noise dominated (detector-on time) | Marked lightcurve |
|---|---|---|---|---|---|---|---|
| A | 7553 | 6193 | 800 | 800 | 10.59% | 12.92% | 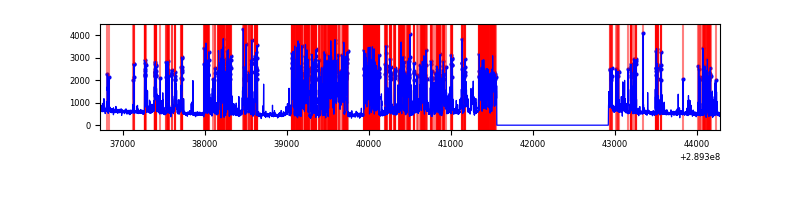 |
| B | 7554 | 6195 | 37 | 37 | 0.49% | 0.60% | 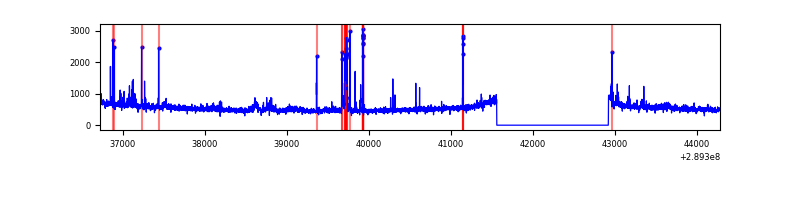 |
| C | 7554 | 6195 | 0 | 0 | 0.00% | 0.00% | 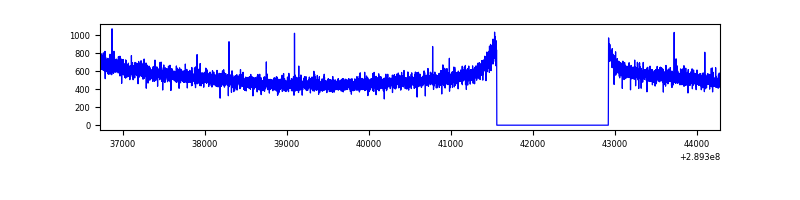 |
| D | 7554 | 6194 | 691 | 691 | 9.15% | 11.16% | 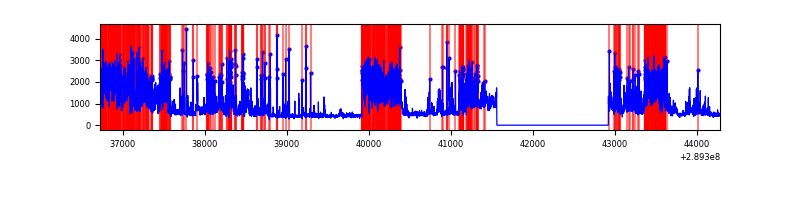 |
Top three noisy pixels from each quadrant. If the there are fewer than three noisy pixels in the level2.evt file, extra rows are filled as -1
| Pixel properties | Quadrant properties | ||||||
|---|---|---|---|---|---|---|---|
| Quadrant | DetID | PixID | Counts | Sigma | Mean | Median | Sigma |
| A | 0 | 13 | 3227735 | 20993.59 | 769 | 754 | 153.7 |
| A | 13 | 210 | 30277 | 192.07 | 769 | 754 | 153.7 |
| A | 13 | 254 | 9848 | 59.16 | 769 | 754 | 153.7 |
| B | 3 | 64 | 200246 | 1280.2 | 827 | 808 | 155.8 |
| B | 0 | 197 | 27818 | 173.38 | 827 | 808 | 155.8 |
| B | 12 | 111 | 17737 | 108.67 | 827 | 808 | 155.8 |
| C | 14 | 238 | 126120 | 673.66 | 804 | 814 | 186.0 |
| C | 13 | 61 | 5553 | 25.48 | 804 | 814 | 186.0 |
| C | 3 | 233 | 2297 | 7.97 | 804 | 814 | 186.0 |
| D | 7 | 238 | 1904718 | 10217.28 | 772 | 751 | 186.3 |
| D | 1 | 52 | 894340 | 4795.28 | 772 | 751 | 186.3 |
| D | 13 | 153 | 462325 | 2476.95 | 772 | 751 | 186.3 |
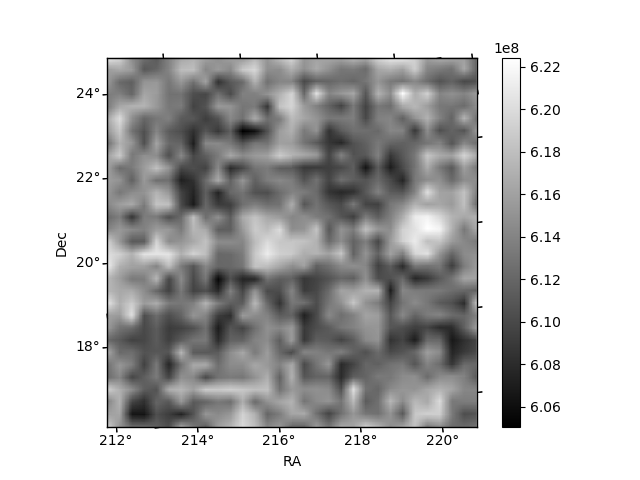
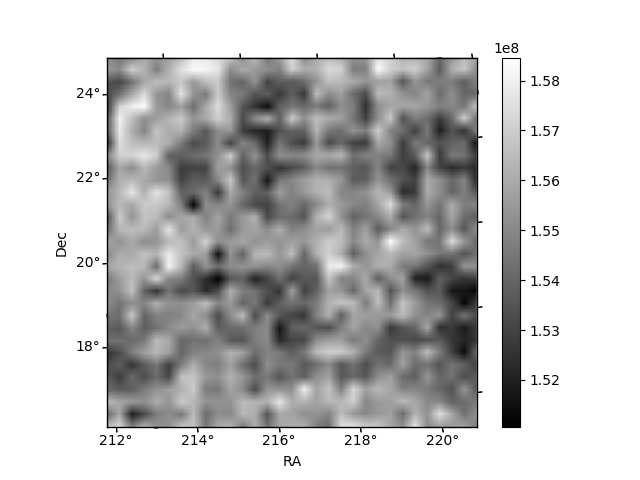
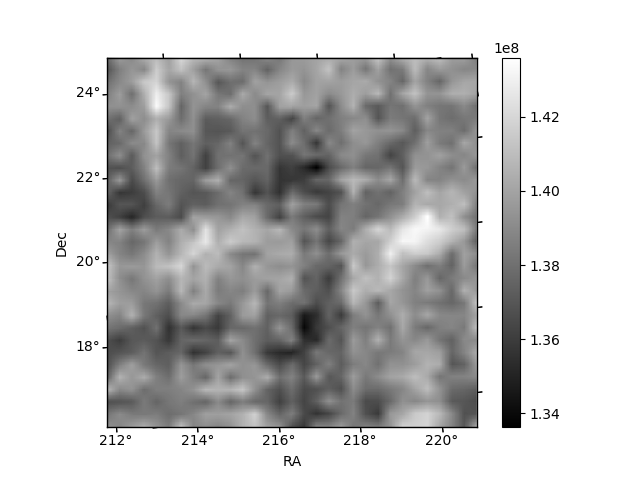
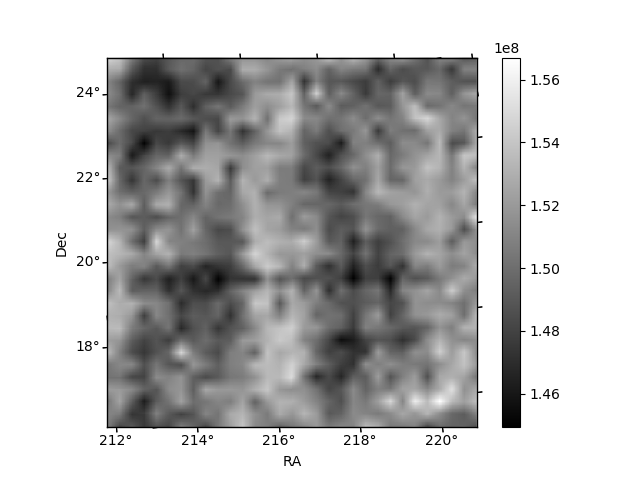
Histogram calculated using DETX and DETY for each event in the final _common_clean file
| Quadrant A |  |
 |
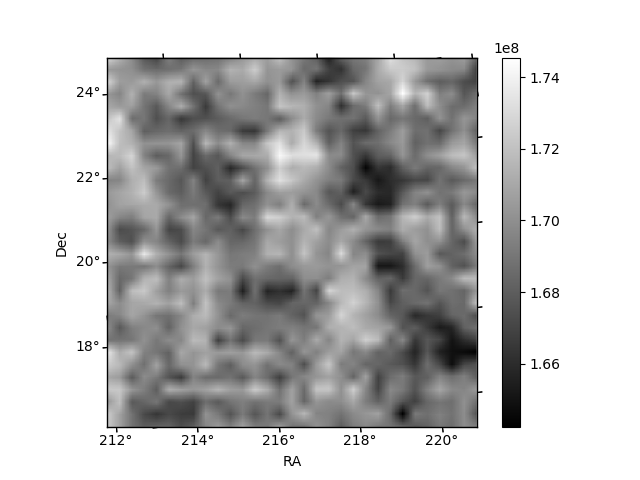
Quadrant B |
|---|---|---|---|
| Quadrant D |  |
 |
Quadrant C |
| Plot type | Count rate plots | Images |
|---|---|---|
| Comparison with Poisson distribution Blue bars denote a histogram of data divided into 1 sec bins. Red curve is a Poisson curve with rate = median count rate of data. |
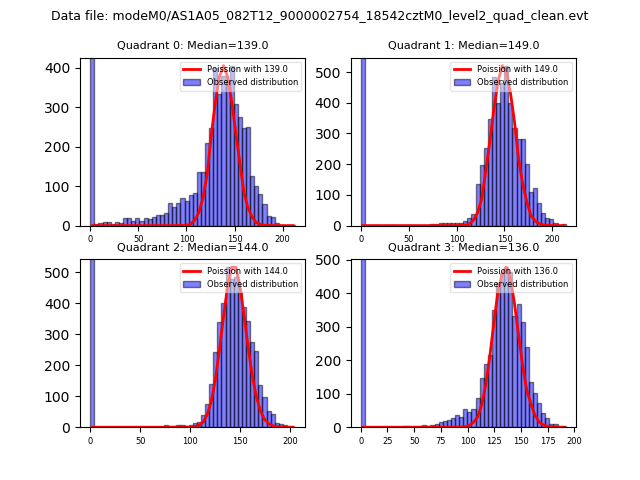 |
 |
| Quadrant-wise count rates Data is divided into 100 sec bins |
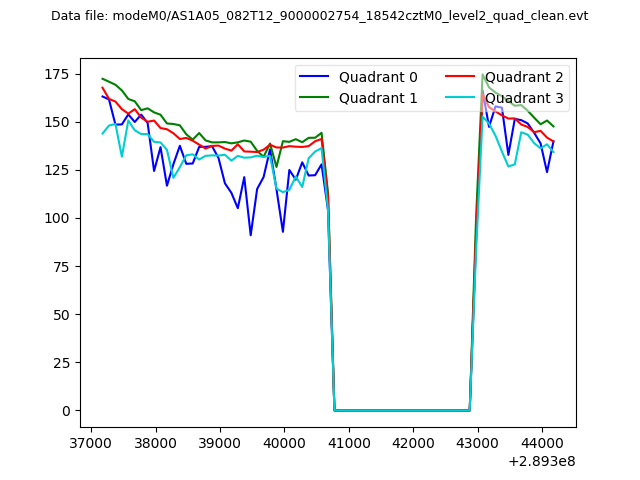 |
|
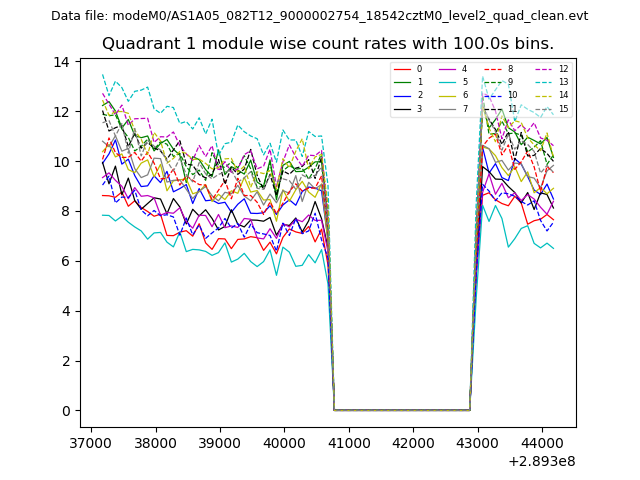
| Module-wise count rates for Quadrant A Data is divided into 100 sec bins |
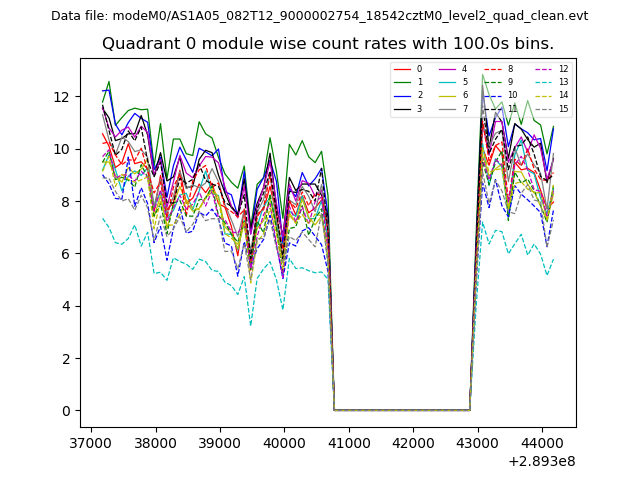 |
 |
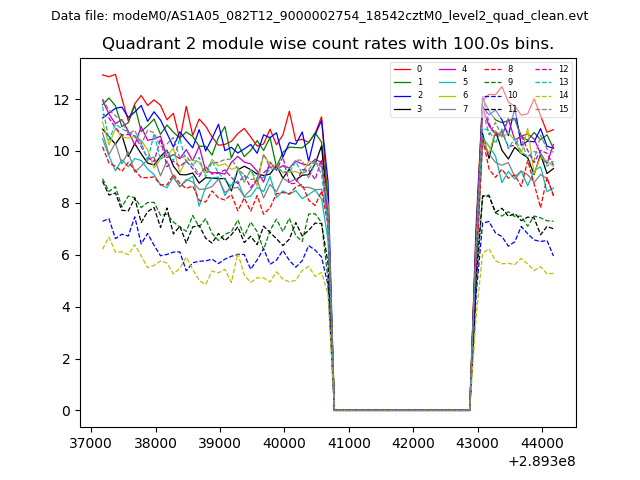
| Module-wise count rates for Quadrant B Data is divided into 100 sec bins |
 |
 |
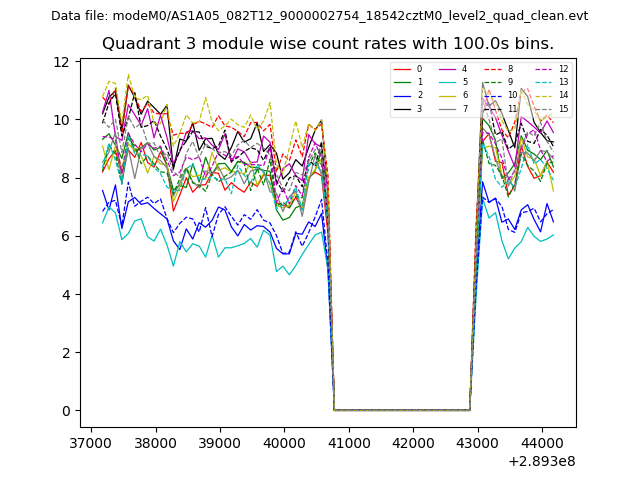
| Module-wise count rates for Quadrant C Data is divided into 100 sec bins |
 |
 |
| Module-wise count rates for Quadrant D Data is divided into 100 sec bins |
 |
 |
| Parameter | Plot |
|---|---|
| CZT HV Monitor | 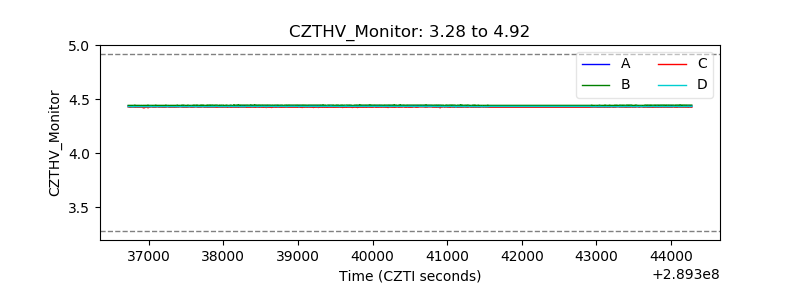 |
| D_VDD | 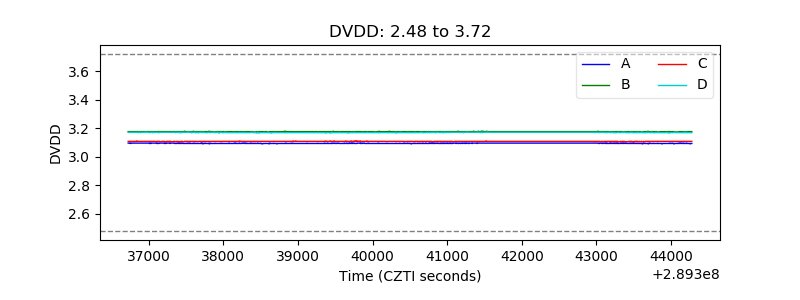 |
| Temperature 1 | 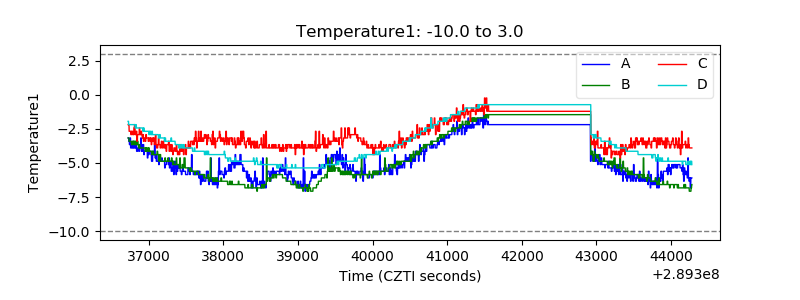 |
| Veto HV Monitor |  |
| Veto LLD | 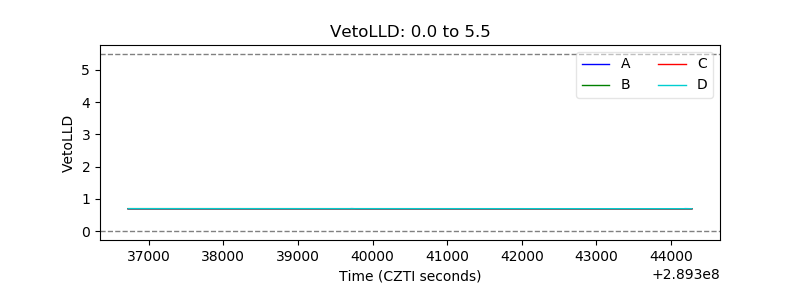 |
| Alpha Counter | 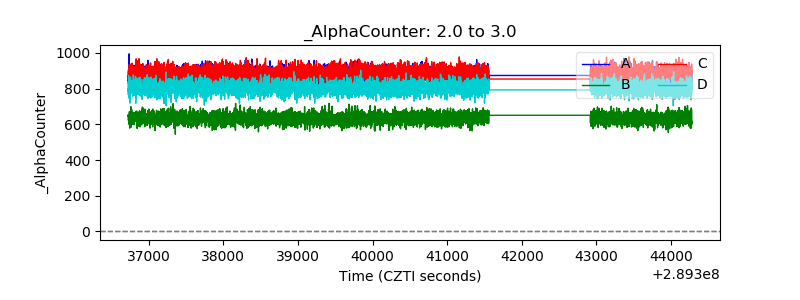 |
| _CPM_Rate | 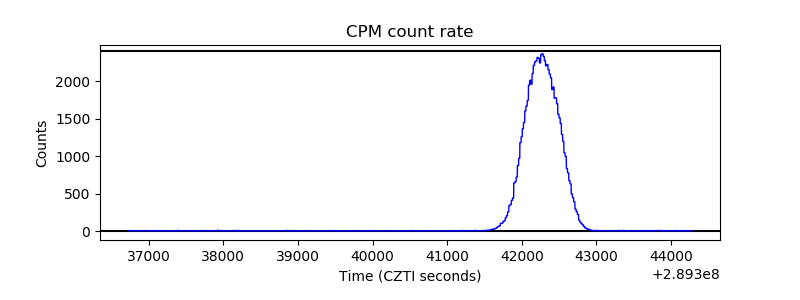 |
| CZT Counter |  |
| +2.5 Volts monitor |  |
| +5 Volts monitor | 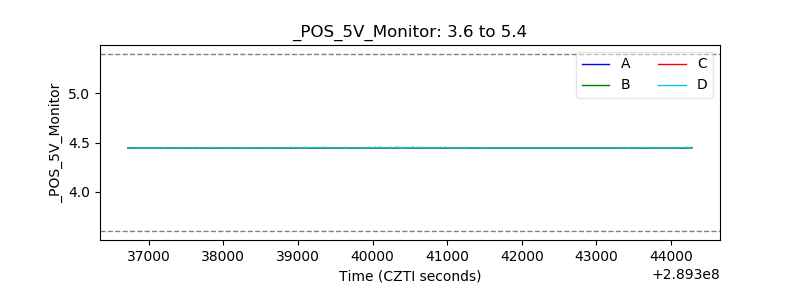 |
| _ROLL_ROT | 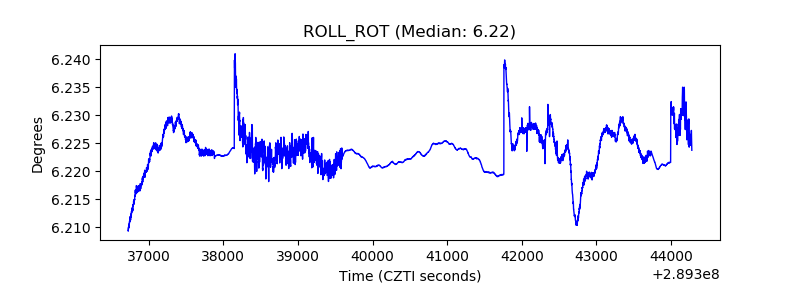 |
| _Roll_DEC |  |
| _Roll_RA | 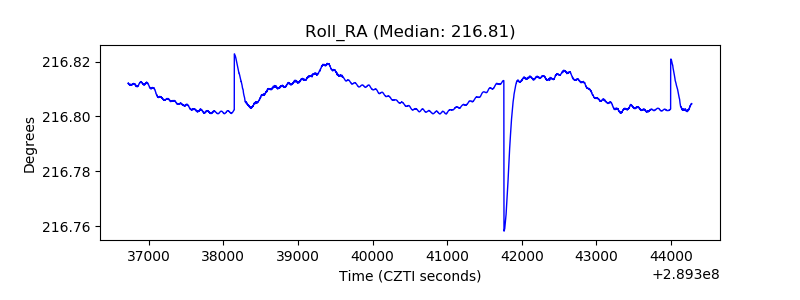 |
| Veto Counter | 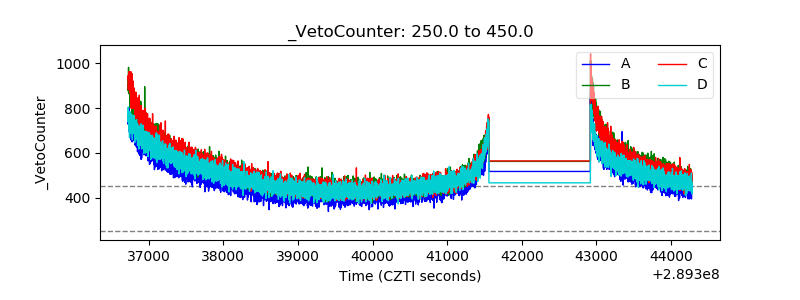 |