| Param | Original file | Final file |
|---|---|---|
| Filename | modeM0/AS1A05_082T12_9000002754_18543cztM0_level2.evt | modeM0/AS1A05_082T12_9000002754_18543cztM0_level2_quad_clean.evt |
| Size (bytes) | 594,529,920 | 102,666,240 |
| Size | 567.0 MB | 97.9 MB |
| Events in quadrant A | 4,958,966 | 650,212 |
| Events in quadrant B | 3,332,571 | 708,427 |
| Events in quadrant C | 3,181,868 | 679,783 |
| Events in quadrant D | 6,105,066 | 630,606 |
| Mode SS | |||
|---|---|---|---|
| Quadrant | BADHDUFLAG | Total packets | Discarded packets |
| A | 0 | 128 | 0 |
| B | 0 | 128 | 0 |
| C | 0 | 128 | 0 |
| D | 0 | 128 | 0 |
| Mode M9 | |||
|---|---|---|---|
| Quadrant | BADHDUFLAG | Total packets | Discarded packets |
| A | 0 | 13 | 0 |
| B | 0 | 14 | 0 |
| C | 0 | 14 | 0 |
| D | 0 | 14 | 0 |
| Mode M0 | |||
|---|---|---|---|
| Quadrant | BADHDUFLAG | Total packets | Discarded packets |
| A | 0 | 18833 | 2 |
| B | 0 | 13839 | 2 |
| C | 0 | 13408 | 2 |
| D | 0 | 22504 | 2 |
| Quadrant | Total seconds | Saturated seconds | Saturation percentage |
|---|---|---|---|
| A | 6304 | 742 | 11.770305% |
| B | 6304 | 116 | 1.840102% |
| C | 6304 | 88 | 1.395939% |
| D | 6304 | 796 | 12.626904% |
Noise dominated data is calculated using 1-second bins in cleaned event files. If a bin has >2000 counts, and if more than 50% of those come from <1% of pixels, then it is considered to be noise-dominated and hence unusable.
| Quadrant | # 1 sec bins | Bins with >0 counts | Bins with >2000 counts | High rate bins dominated by noise | Noise dominated (total time) | Noise dominated (detector-on time) | Marked lightcurve |
|---|---|---|---|---|---|---|---|
| A | 7559 | 6305 | 458 | 458 | 6.06% | 7.26% | 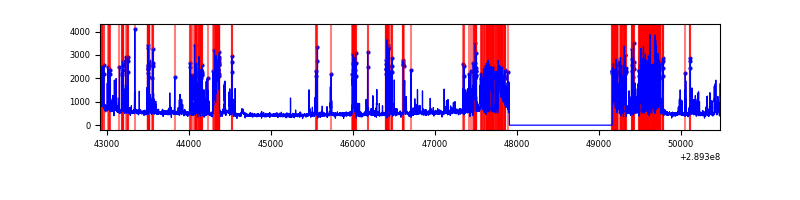 |
| B | 7559 | 6305 | 10 | 10 | 0.13% | 0.16% | 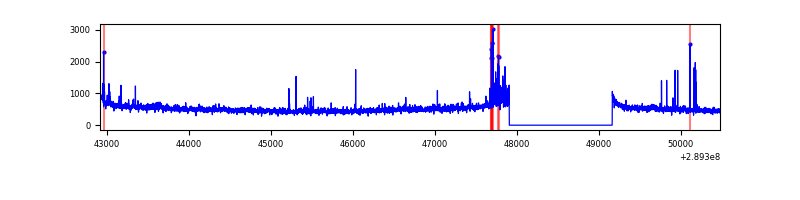 |
| C | 7559 | 6305 | 0 | 0 | 0.00% | 0.00% | 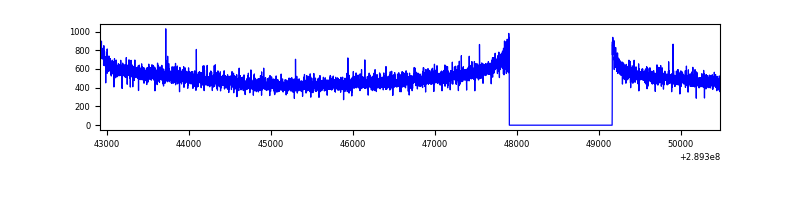 |
| D | 7559 | 6305 | 641 | 641 | 8.48% | 10.17% | 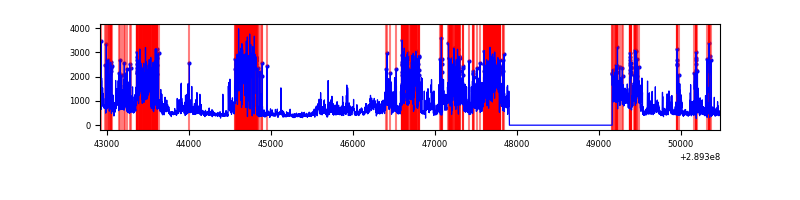 |
Top three noisy pixels from each quadrant. If the there are fewer than three noisy pixels in the level2.evt file, extra rows are filled as -1
| Pixel properties | Quadrant properties | ||||||
|---|---|---|---|---|---|---|---|
| Quadrant | DetID | PixID | Counts | Sigma | Mean | Median | Sigma |
| A | 0 | 13 | 2002756 | 13032.45 | 762 | 746 | 153.6 |
| A | 14 | 111 | 15533 | 96.26 | 762 | 746 | 153.6 |
| A | 13 | 254 | 9949 | 59.91 | 762 | 746 | 153.6 |
| B | 3 | 64 | 58577 | 375.92 | 811 | 793 | 153.7 |
| B | 7 | 220 | 47657 | 304.88 | 811 | 793 | 153.7 |
| B | 4 | 80 | 29289 | 185.38 | 811 | 793 | 153.7 |
| C | 14 | 238 | 122690 | 670.31 | 784 | 790 | 181.9 |
| C | 13 | 61 | 5450 | 25.62 | 784 | 790 | 181.9 |
| C | 3 | 233 | 3999 | 17.65 | 784 | 790 | 181.9 |
| D | 7 | 238 | 2928115 | 16097.04 | 753 | 734 | 181.9 |
| D | 13 | 153 | 213670 | 1170.89 | 753 | 734 | 181.9 |
| D | 1 | 52 | 64116 | 348.52 | 753 | 734 | 181.9 |
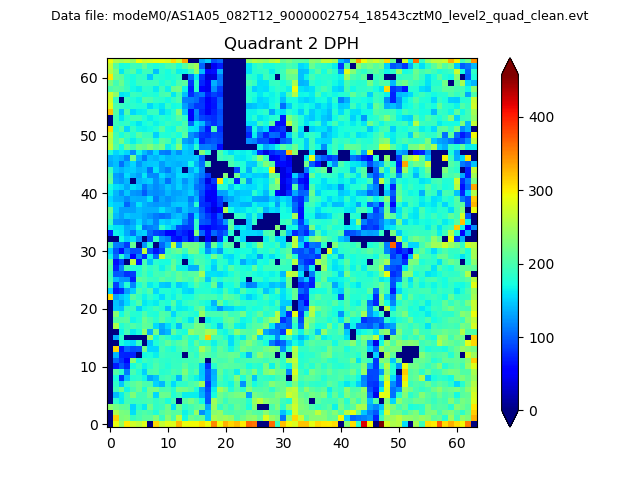
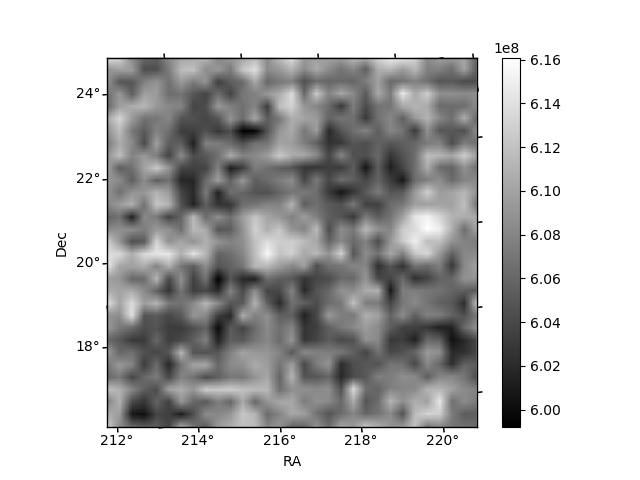
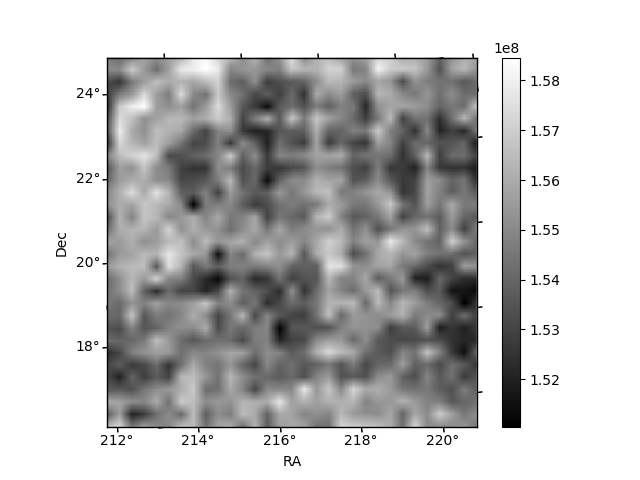
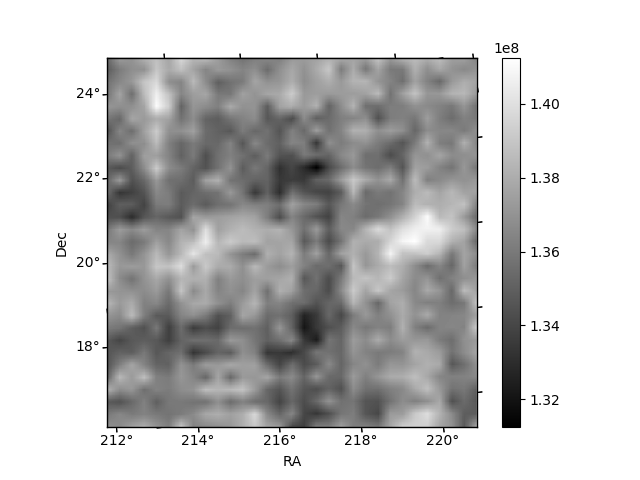
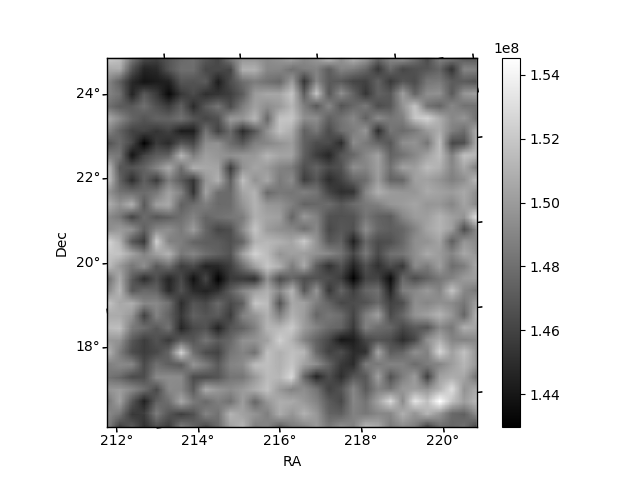
Histogram calculated using DETX and DETY for each event in the final _common_clean file
| Quadrant A | 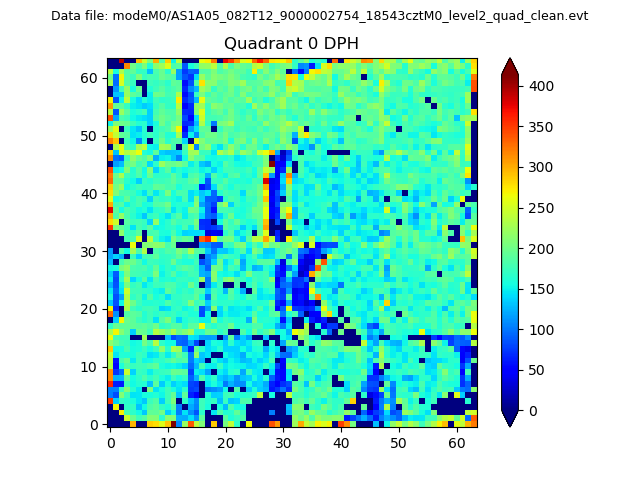 |
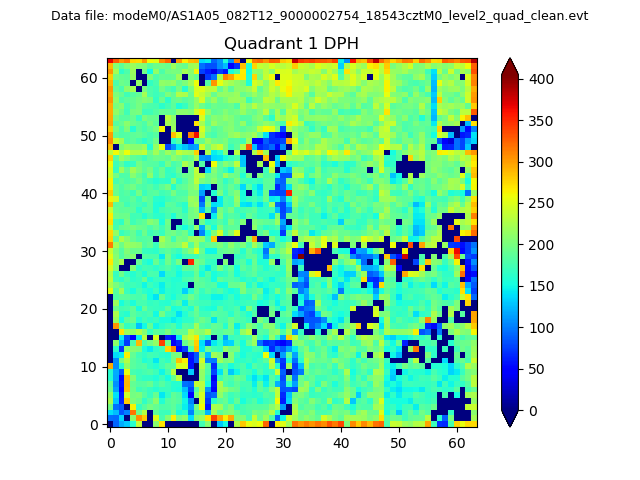 |
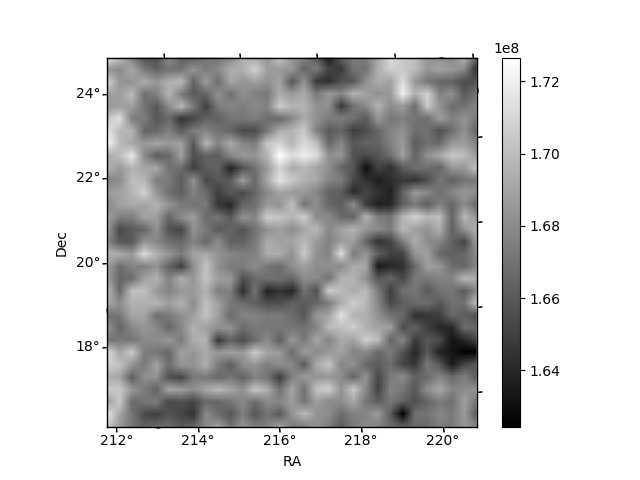
Quadrant B |
|---|---|---|---|
| Quadrant D | 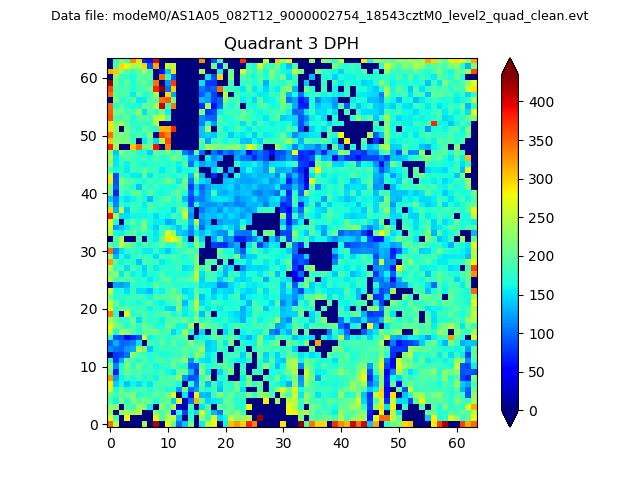 |
 |
Quadrant C |
| Plot type | Count rate plots | Images |
|---|---|---|
| Comparison with Poisson distribution Blue bars denote a histogram of data divided into 1 sec bins. Red curve is a Poisson curve with rate = median count rate of data. |
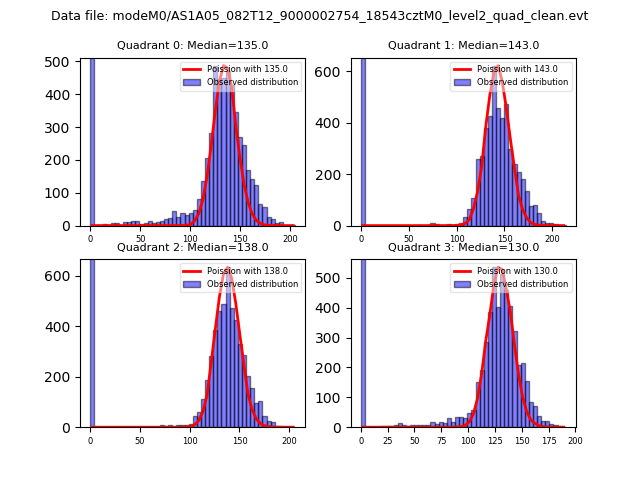 |
 |
| Quadrant-wise count rates Data is divided into 100 sec bins |
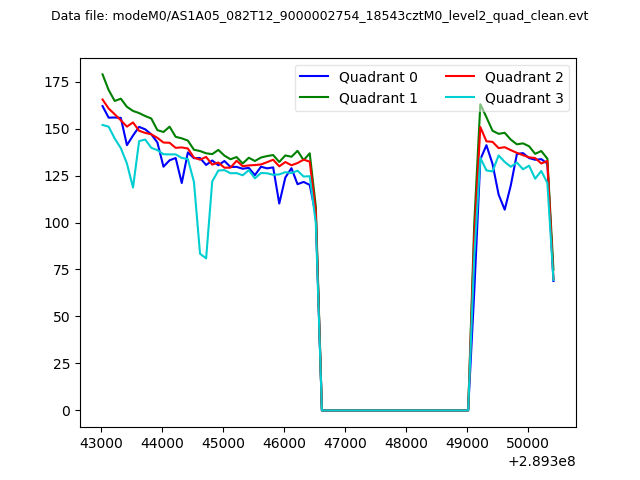 |
|
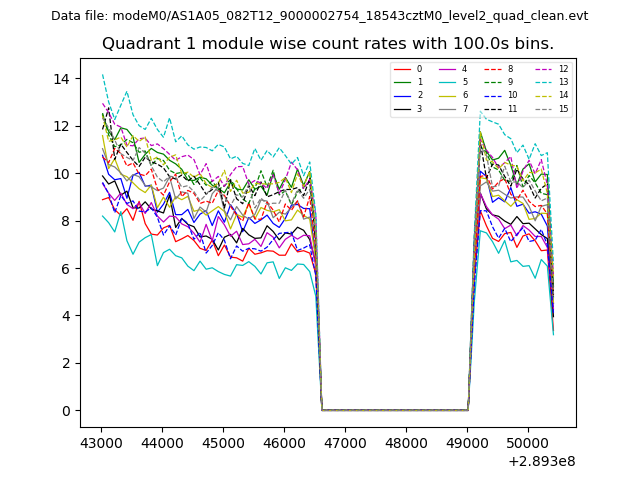
| Module-wise count rates for Quadrant A Data is divided into 100 sec bins |
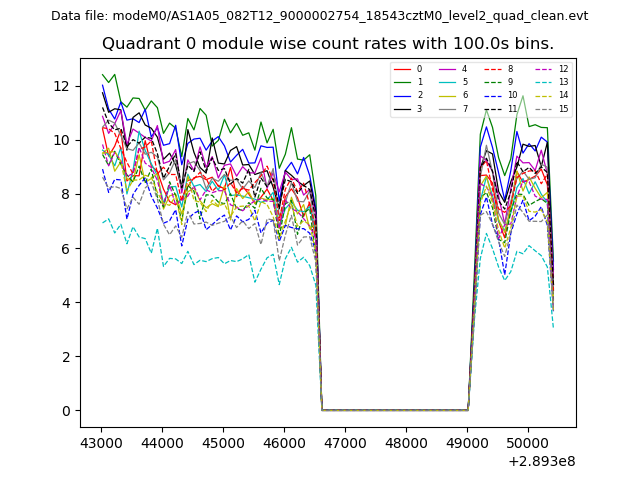 |
 |
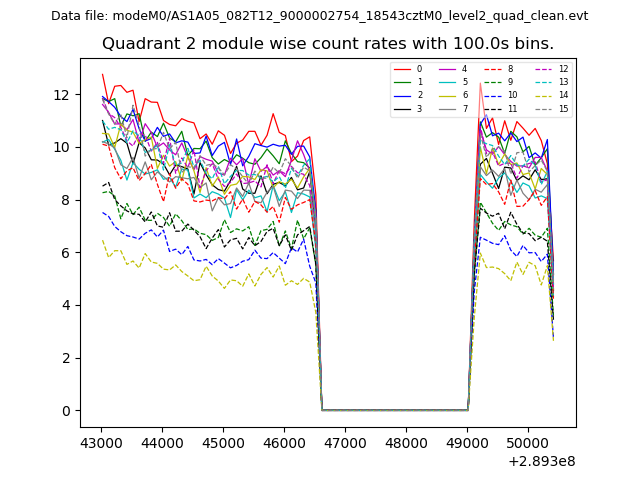
| Module-wise count rates for Quadrant B Data is divided into 100 sec bins |
 |
 |
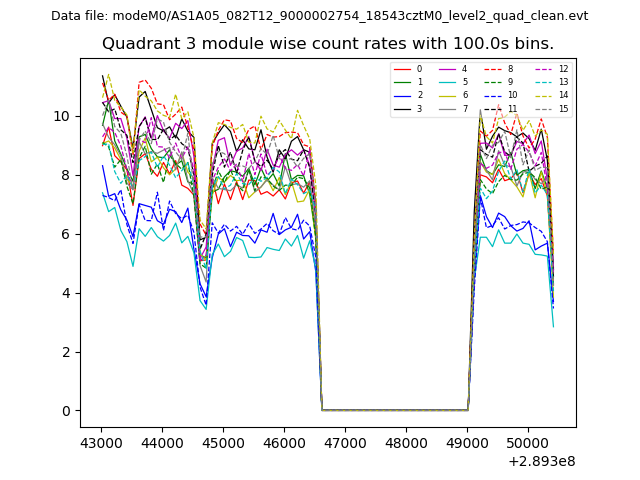
| Module-wise count rates for Quadrant C Data is divided into 100 sec bins |
 |
 |
| Module-wise count rates for Quadrant D Data is divided into 100 sec bins |
 |
 |
| Parameter | Plot |
|---|---|
| CZT HV Monitor | 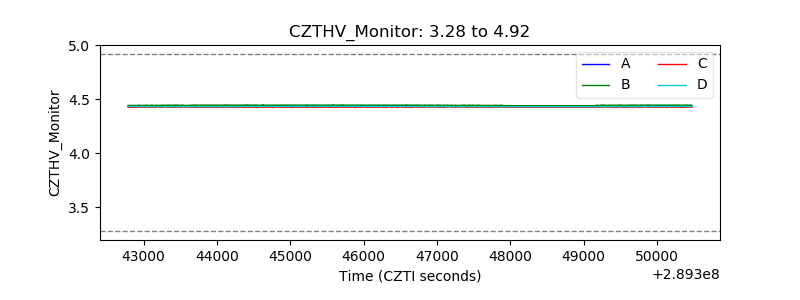 |
| D_VDD | 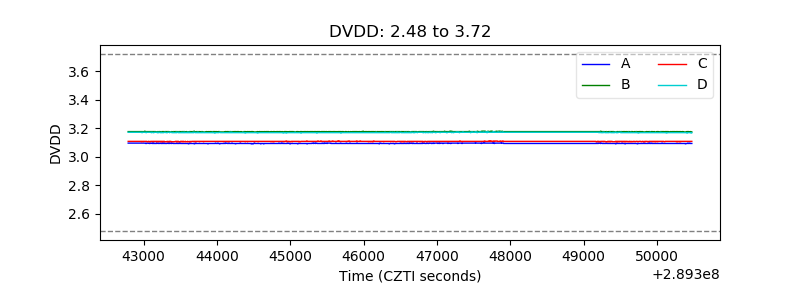 |
| Temperature 1 | 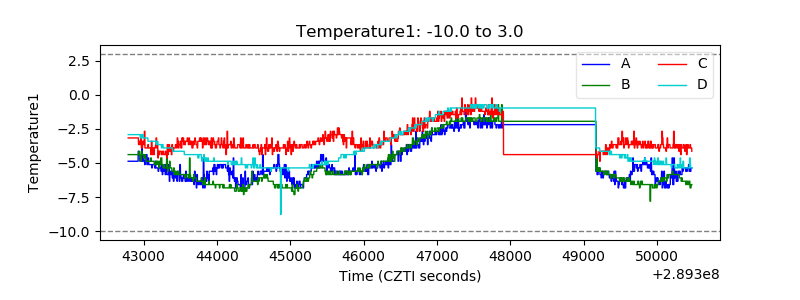 |
| Veto HV Monitor |  |
| Veto LLD | 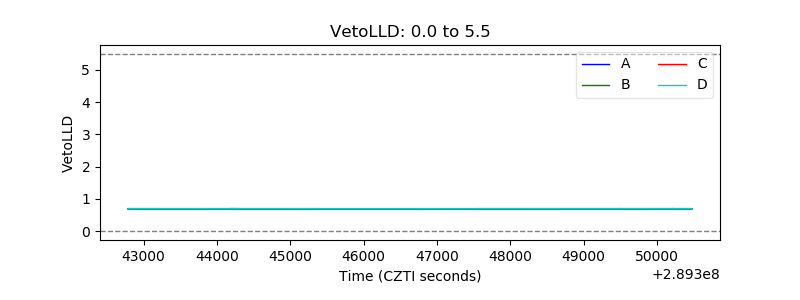 |
| Alpha Counter |  |
| _CPM_Rate | 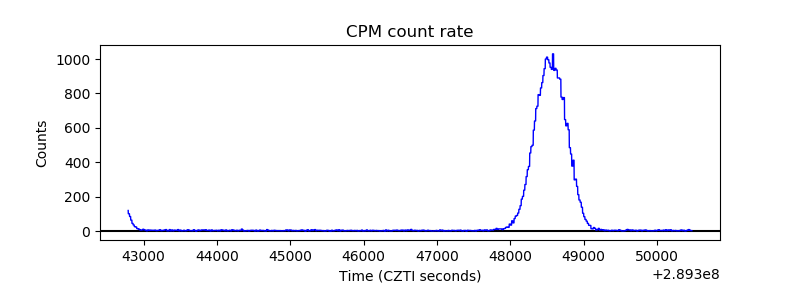 |
| CZT Counter | 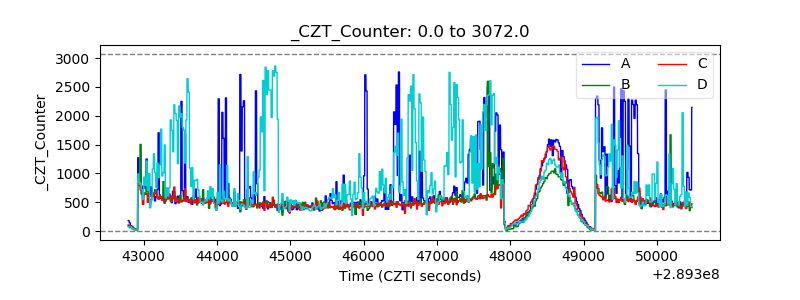 |
| +2.5 Volts monitor |  |
| +5 Volts monitor |  |
| _ROLL_ROT | 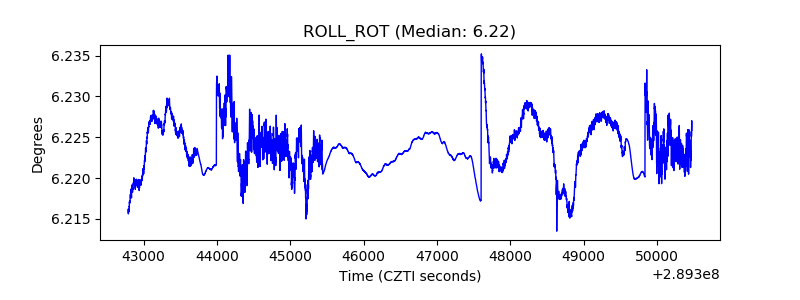 |
| _Roll_DEC | 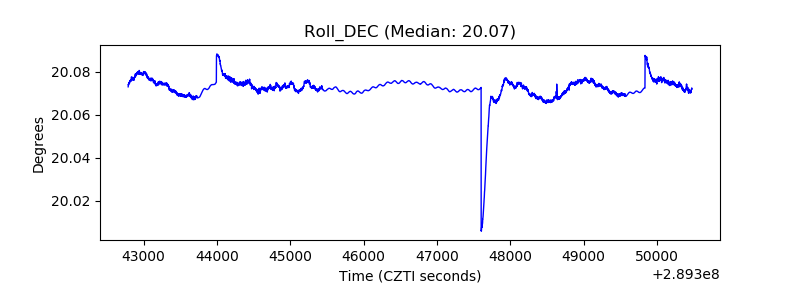 |
| _Roll_RA | 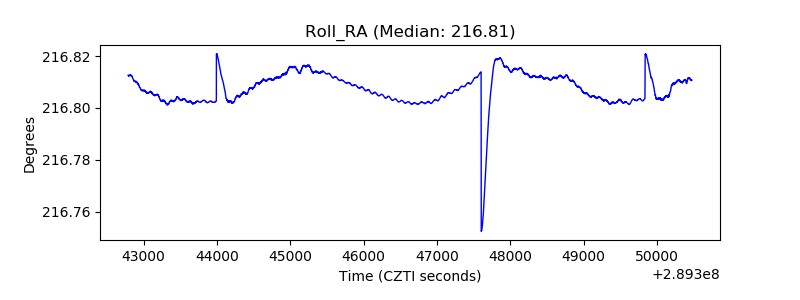 |
| Veto Counter | 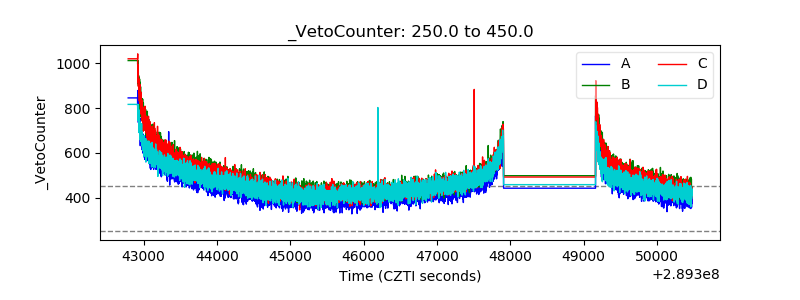 |