| Param | Original file | Final file |
|---|---|---|
| Filename | modeM0/AS1A05_082T12_9000002754_18545cztM0_level2.evt | modeM0/AS1A05_082T12_9000002754_18545cztM0_level2_quad_clean.evt |
| Size (bytes) | 285,840,000 | 51,252,480 |
| Size | 272.6 MB | 48.9 MB |
| Events in quadrant A | 3,196,448 | 305,129 |
| Events in quadrant B | 1,399,277 | 362,897 |
| Events in quadrant C | 1,281,934 | 353,615 |
| Events in quadrant D | 2,585,175 | 327,357 |
| Mode SS | |||
|---|---|---|---|
| Quadrant | BADHDUFLAG | Total packets | Discarded packets |
| A | 0 | 58 | 0 |
| B | 0 | 58 | 0 |
| C | 0 | 58 | 0 |
| D | 0 | 58 | 0 |
| Mode M9 | |||
|---|---|---|---|
| Quadrant | BADHDUFLAG | Total packets | Discarded packets |
| A | 0 | 1 | 0 |
| B | 0 | 2 | 0 |
| C | 0 | 2 | 0 |
| D | 0 | 2 | 0 |
| Mode M0 | |||
|---|---|---|---|
| Quadrant | BADHDUFLAG | Total packets | Discarded packets |
| A | 0 | 11445 | 1 |
| B | 0 | 6173 | 1 |
| C | 0 | 5817 | 1 |
| D | 0 | 9688 | 1 |
| Quadrant | Total seconds | Saturated seconds | Saturation percentage |
|---|---|---|---|
| A | 2831 | 629 | 22.218297% |
| B | 2831 | 56 | 1.978100% |
| C | 2831 | 24 | 0.847757% |
| D | 2831 | 283 | 9.996468% |
Noise dominated data is calculated using 1-second bins in cleaned event files. If a bin has >2000 counts, and if more than 50% of those come from <1% of pixels, then it is considered to be noise-dominated and hence unusable.
| Quadrant | # 1 sec bins | Bins with >0 counts | Bins with >2000 counts | High rate bins dominated by noise | Noise dominated (total time) | Noise dominated (detector-on time) | Marked lightcurve |
|---|---|---|---|---|---|---|---|
| A | 2831 | 2831 | 530 | 530 | 18.72% | 18.72% | 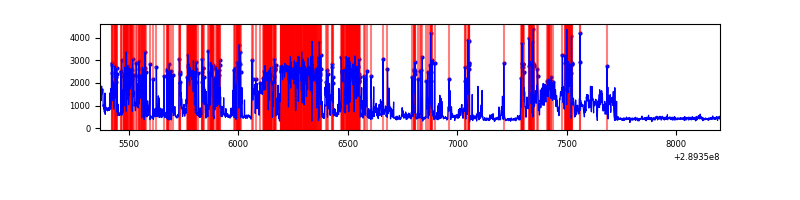 |
| B | 2831 | 2831 | 35 | 35 | 1.24% | 1.24% | 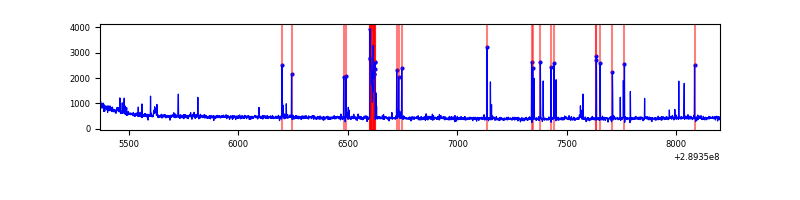 |
| C | 2831 | 2831 | 2 | 2 | 0.07% | 0.07% | 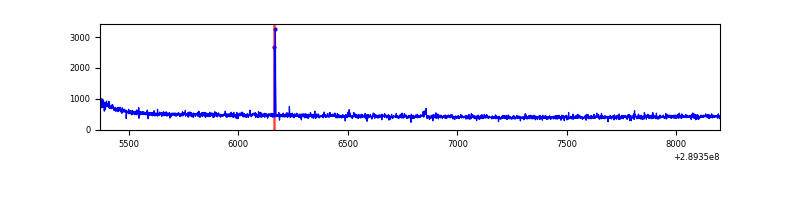 |
| D | 2831 | 2831 | 261 | 261 | 9.22% | 9.22% | 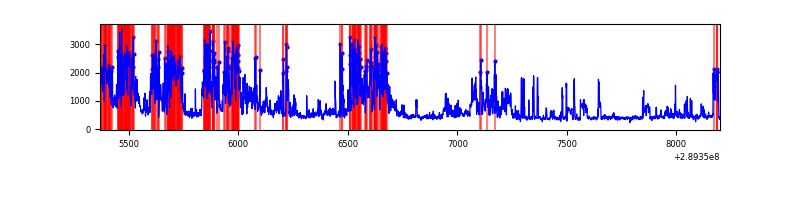 |
Top three noisy pixels from each quadrant. If the there are fewer than three noisy pixels in the level2.evt file, extra rows are filled as -1
| Pixel properties | Quadrant properties | ||||||
|---|---|---|---|---|---|---|---|
| Quadrant | DetID | PixID | Counts | Sigma | Mean | Median | Sigma |
| A | 0 | 13 | 2095185 | 35092.17 | 285 | 279 | 59.7 |
| A | 13 | 254 | 4013 | 62.55 | 285 | 279 | 59.7 |
| A | 4 | 2 | 2857 | 43.18 | 285 | 279 | 59.7 |
| B | 4 | 80 | 76754 | 1211.93 | 322 | 314 | 63.1 |
| B | 3 | 64 | 54464 | 858.53 | 322 | 314 | 63.1 |
| B | 12 | 111 | 7476 | 113.55 | 322 | 314 | 63.1 |
| C | 14 | 238 | 49265 | 660.23 | 313 | 316 | 74.1 |
| C | 9 | 54 | 11415 | 149.7 | 313 | 316 | 74.1 |
| C | 13 | 61 | 2202 | 25.44 | 313 | 316 | 74.1 |
| D | 7 | 238 | 922580 | 12399.68 | 301 | 292 | 74.4 |
| D | 13 | 153 | 253185 | 3400.01 | 301 | 292 | 74.4 |
| D | 1 | 52 | 226212 | 3037.38 | 301 | 292 | 74.4 |
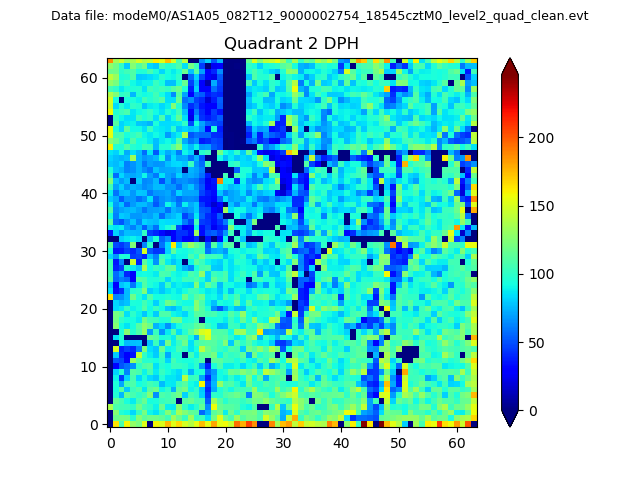
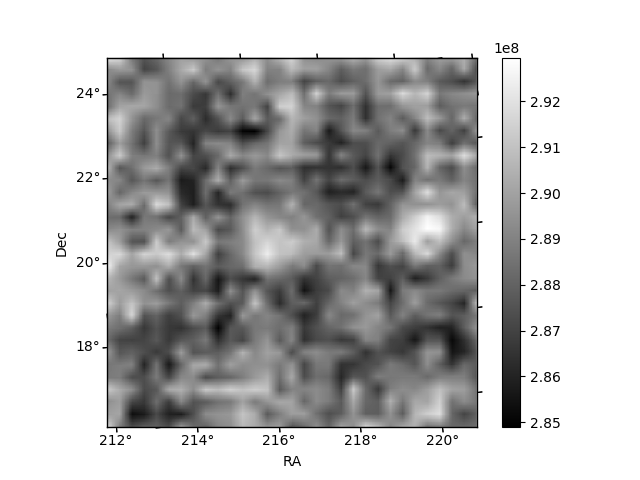
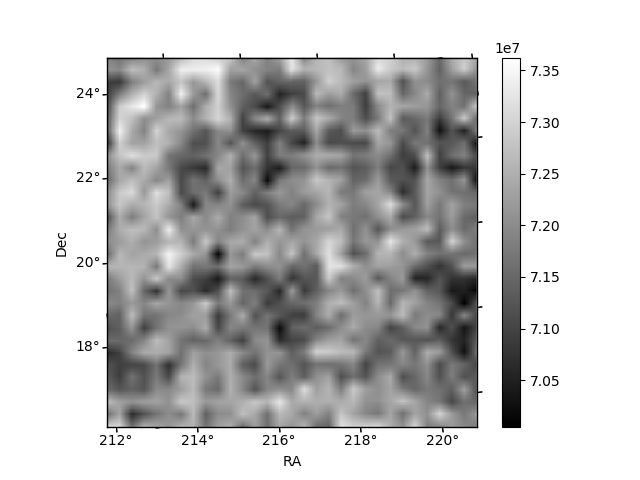
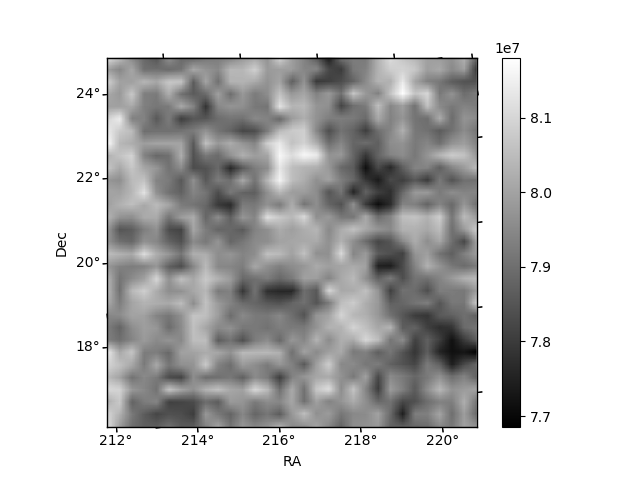
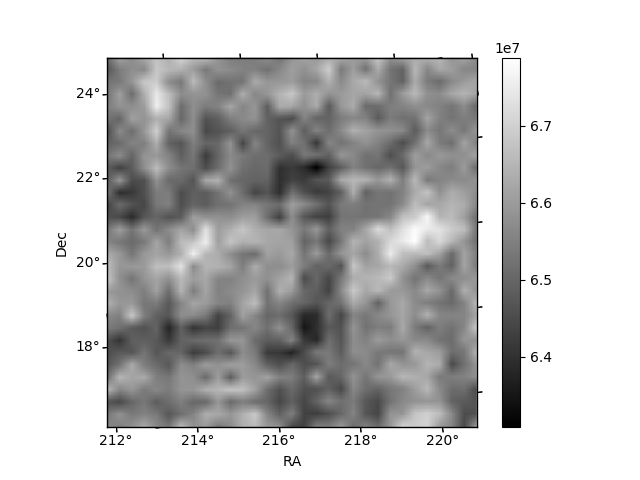
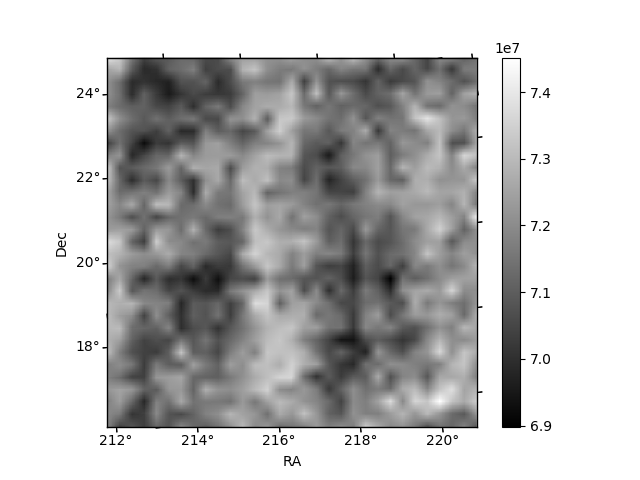
Histogram calculated using DETX and DETY for each event in the final _common_clean file
| Quadrant A | 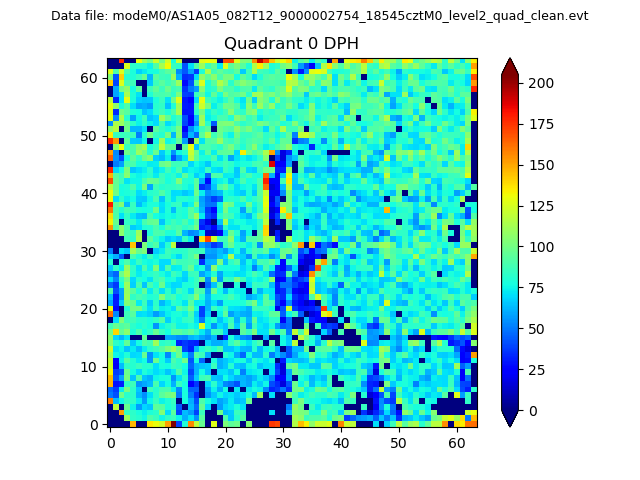 |
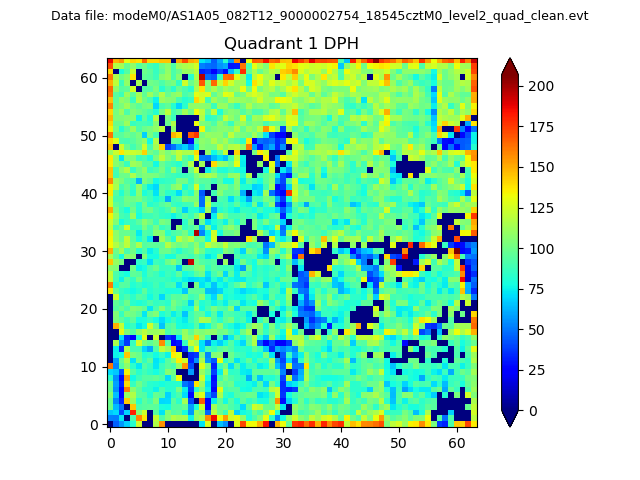 |
Quadrant B |
|---|---|---|---|
| Quadrant D | 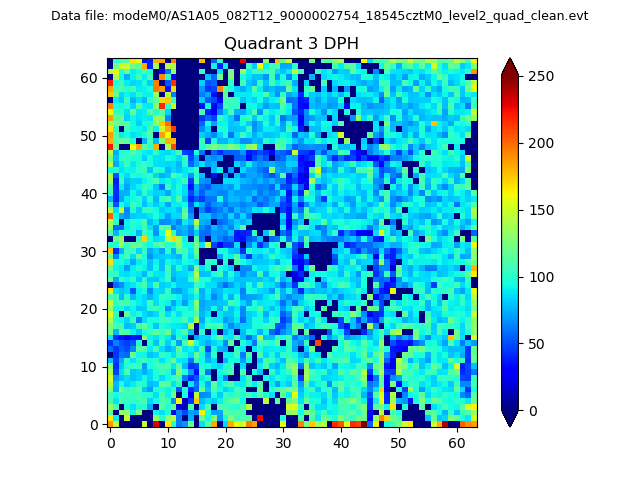 |
 |
Quadrant C |
| Plot type | Count rate plots | Images |
|---|---|---|
| Comparison with Poisson distribution Blue bars denote a histogram of data divided into 1 sec bins. Red curve is a Poisson curve with rate = median count rate of data. |
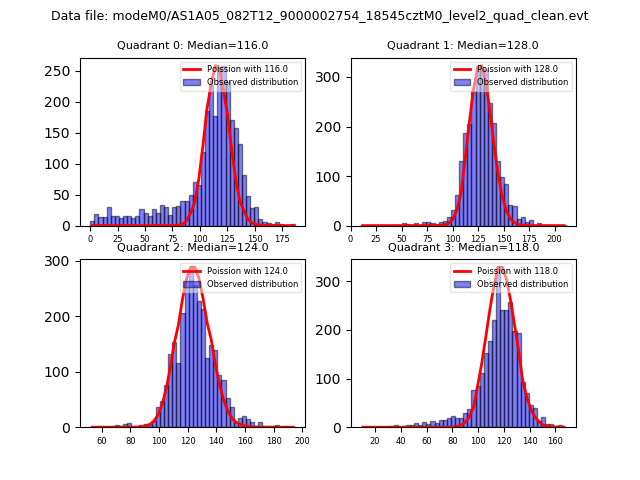 |
 |
| Quadrant-wise count rates Data is divided into 100 sec bins |
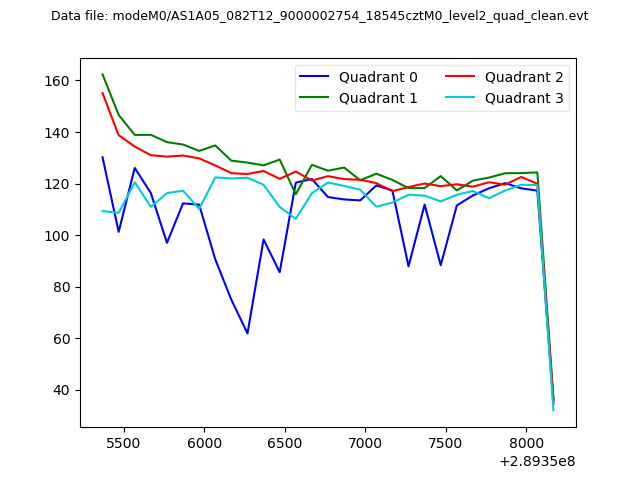 |
|
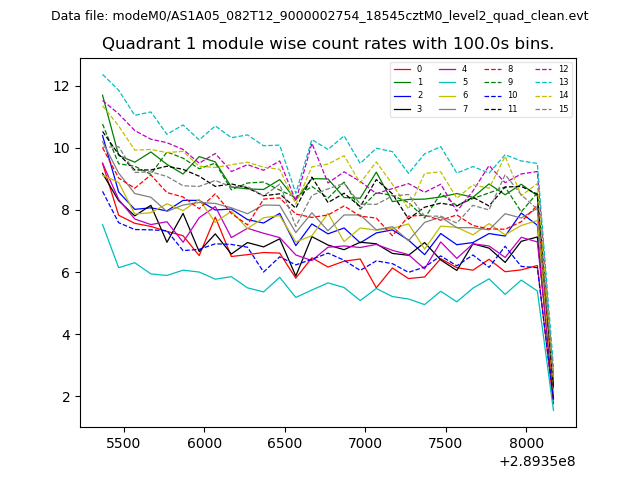
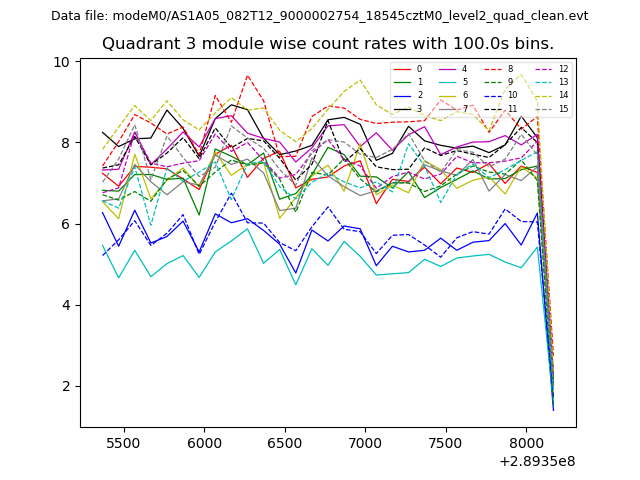
| Module-wise count rates for Quadrant A Data is divided into 100 sec bins |
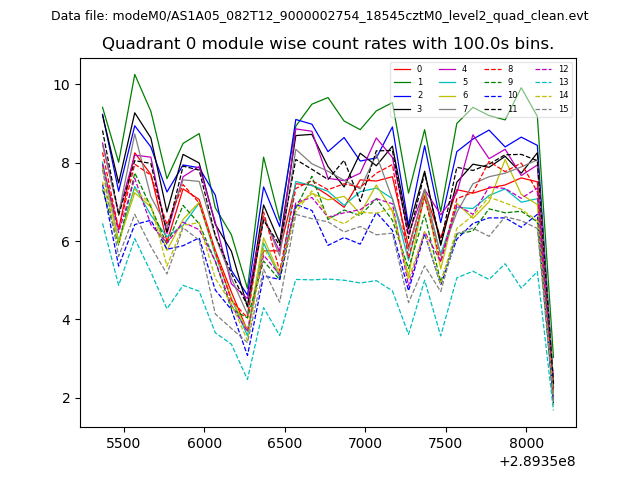 |
 |
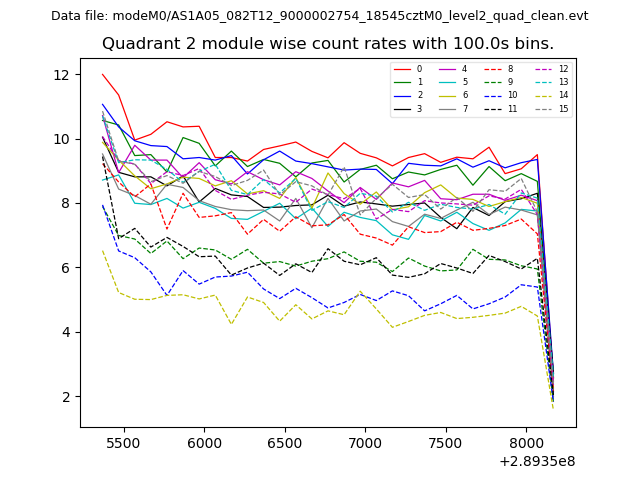
| Module-wise count rates for Quadrant B Data is divided into 100 sec bins |
 |
 |
| Module-wise count rates for Quadrant C Data is divided into 100 sec bins |
 |
 |
| Module-wise count rates for Quadrant D Data is divided into 100 sec bins |
 |
 |
| Parameter | Plot |
|---|---|
| CZT HV Monitor | 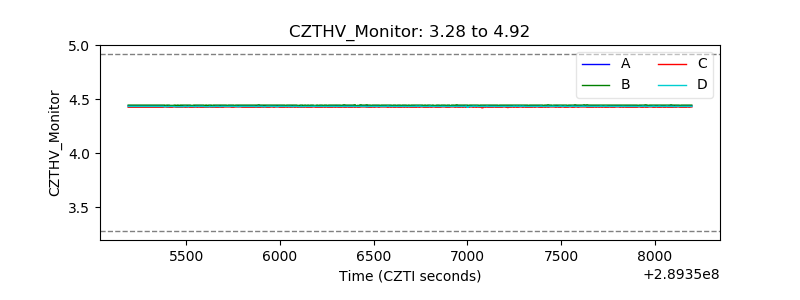 |
| D_VDD | 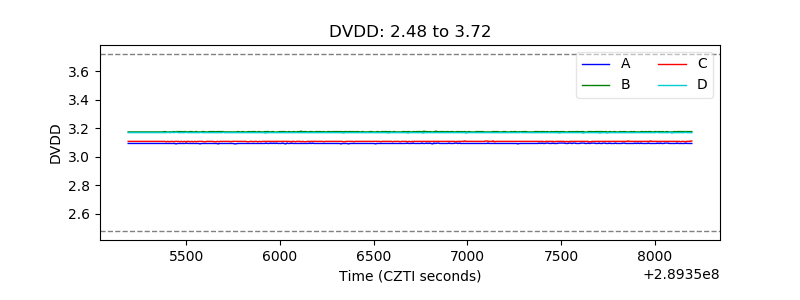 |
| Temperature 1 | 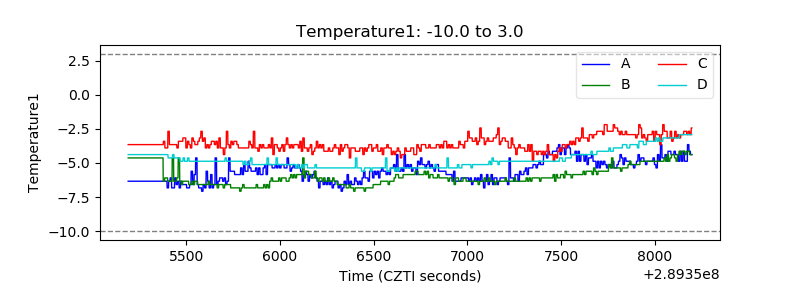 |
| Veto HV Monitor | 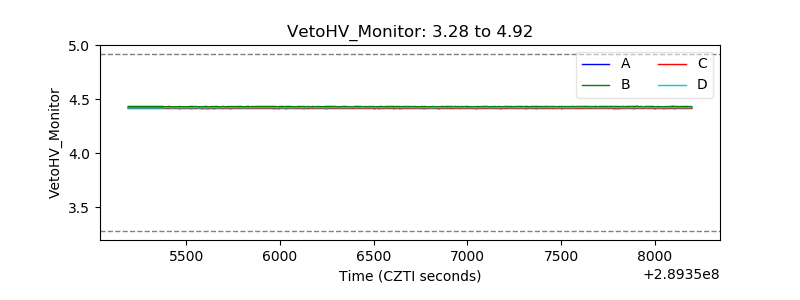 |
| Veto LLD | 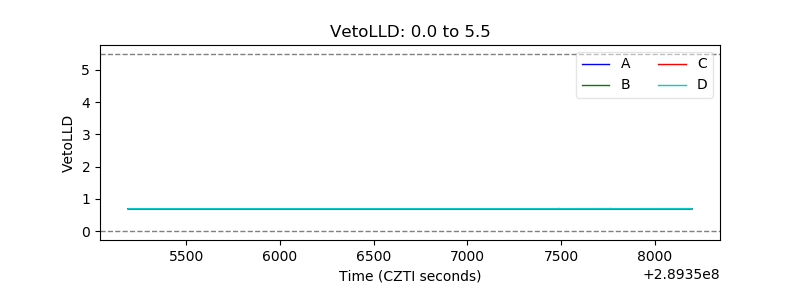 |
| Alpha Counter |  |
| _CPM_Rate | 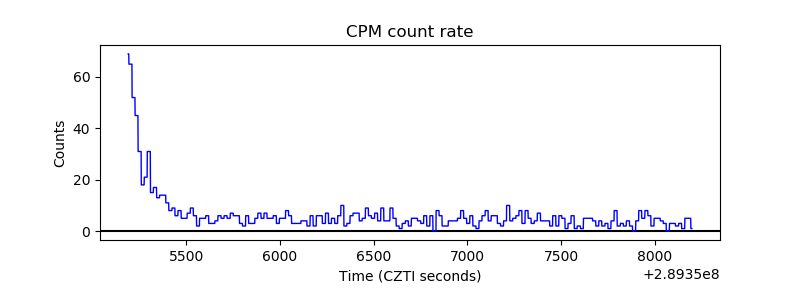 |
| CZT Counter | 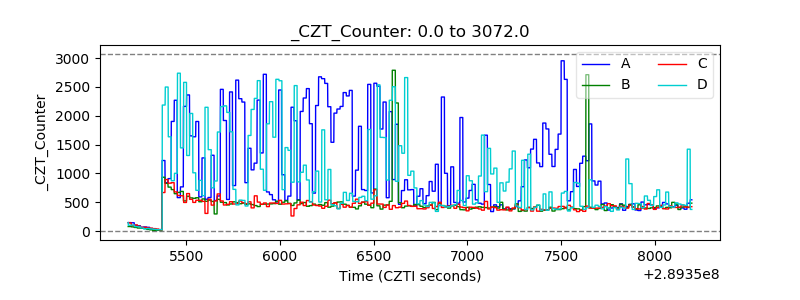 |
| +2.5 Volts monitor |  |
| +5 Volts monitor |  |
| _ROLL_ROT | 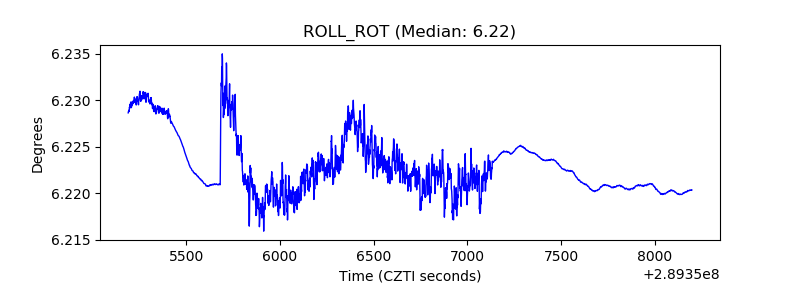 |
| _Roll_DEC | 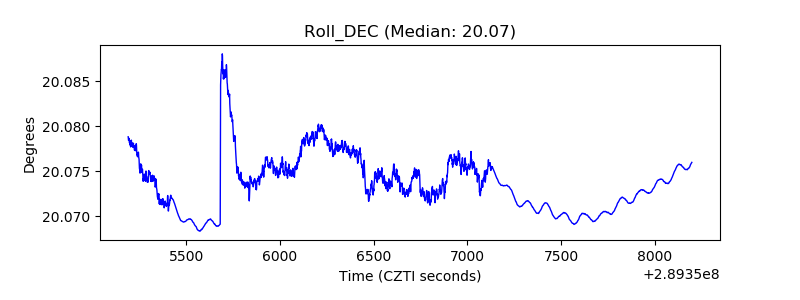 |
| _Roll_RA |  |
| Veto Counter | 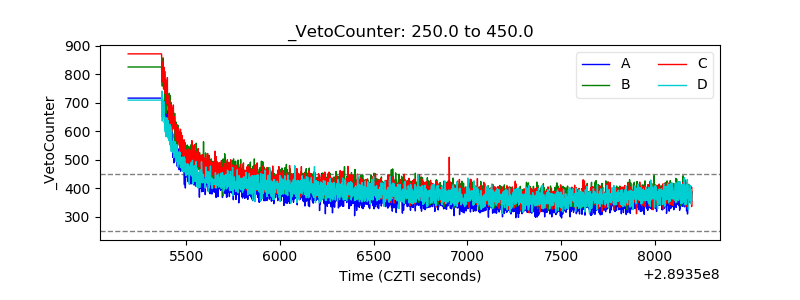 |