| Param | Original file | Final file |
|---|---|---|
| Filename | modeM0/AS1A05_103T02_9000002750_18533cztM0_level2.evt | modeM0/AS1A05_103T02_9000002750_18533cztM0_level2_quad_clean.evt |
| Size (bytes) | 191,450,880 | 23,512,320 |
| Size | 182.6 MB | 22.4 MB |
| Events in quadrant A | 1,380,696 | 130,724 |
| Events in quadrant B | 1,362,623 | 132,709 |
| Events in quadrant C | 1,352,194 | 128,761 |
| Events in quadrant D | 1,518,292 | 127,286 |
| Mode M9 | |||
|---|---|---|---|
| Quadrant | BADHDUFLAG | Total packets | Discarded packets |
| A | 0 | 3 | 0 |
| B | 0 | 3 | 0 |
| C | 0 | 3 | 0 |
| D | 0 | 3 | 0 |
| Mode M0 | |||
|---|---|---|---|
| Quadrant | BADHDUFLAG | Total packets | Discarded packets |
| A | 0 | 5819 | 1 |
| B | 0 | 5695 | 1 |
| C | 0 | 5651 | 1 |
| D | 0 | 6338 | 1 |
| Mode SS | |||
|---|---|---|---|
| Quadrant | BADHDUFLAG | Total packets | Discarded packets |
| A | 0 | 56 | 0 |
| B | 0 | 56 | 0 |
| C | 0 | 56 | 0 |
| D | 0 | 56 | 0 |
| Quadrant | Total seconds | Saturated seconds | Saturation percentage |
|---|---|---|---|
| A | 2676 | 104 | 3.886398% |
| B | 2676 | 107 | 3.998505% |
| C | 2676 | 101 | 3.774290% |
| D | 2676 | 104 | 3.886398% |
Noise dominated data is calculated using 1-second bins in cleaned event files. If a bin has >2000 counts, and if more than 50% of those come from <1% of pixels, then it is considered to be noise-dominated and hence unusable.
| Quadrant | # 1 sec bins | Bins with >0 counts | Bins with >2000 counts | High rate bins dominated by noise | Noise dominated (total time) | Noise dominated (detector-on time) | Marked lightcurve |
|---|---|---|---|---|---|---|---|
| A | 3016 | 2676 | 0 | 0 | 0.00% | 0.00% | 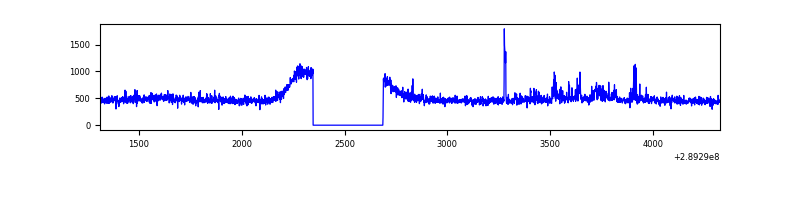 |
| B | 3016 | 2676 | 1 | 1 | 0.03% | 0.04% | 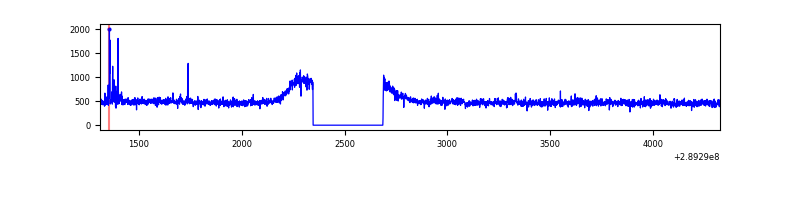 |
| C | 3016 | 2676 | 0 | 0 | 0.00% | 0.00% | 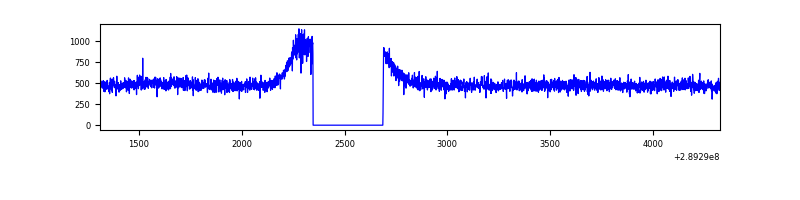 |
| D | 3016 | 2676 | 25 | 25 | 0.83% | 0.93% | 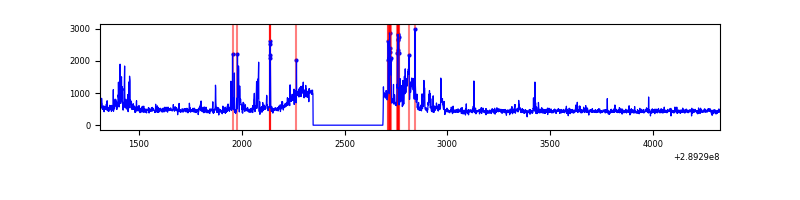 |
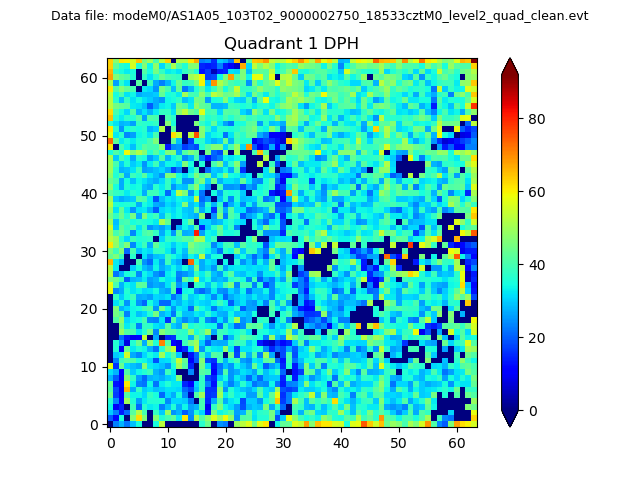
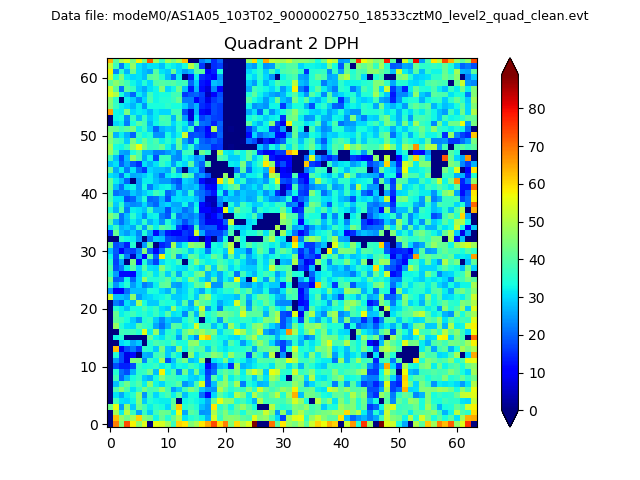
Top three noisy pixels from each quadrant. If the there are fewer than three noisy pixels in the level2.evt file, extra rows are filled as -1
| Pixel properties | Quadrant properties | ||||||
|---|---|---|---|---|---|---|---|
| Quadrant | DetID | PixID | Counts | Sigma | Mean | Median | Sigma |
| A | 0 | 13 | 56189 | 791.14 | 340 | 332 | 70.6 |
| A | 14 | 111 | 10035 | 137.43 | 340 | 332 | 70.6 |
| A | 13 | 254 | 4595 | 60.38 | 340 | 332 | 70.6 |
| B | 0 | 197 | 12568 | 179.2 | 342 | 333 | 68.3 |
| B | 12 | 111 | 8368 | 117.68 | 342 | 333 | 68.3 |
| B | 15 | 222 | 7844 | 110.01 | 342 | 333 | 68.3 |
| C | 14 | 238 | 48922 | 606.22 | 332 | 334 | 80.1 |
| C | 8 | 128 | 3946 | 45.07 | 332 | 334 | 80.1 |
| C | 13 | 61 | 2351 | 25.17 | 332 | 334 | 80.1 |
| D | 7 | 238 | 141531 | 1687.69 | 332 | 321 | 83.7 |
| D | 1 | 52 | 74619 | 887.98 | 332 | 321 | 83.7 |
| D | 13 | 172 | 26349 | 311.08 | 332 | 321 | 83.7 |
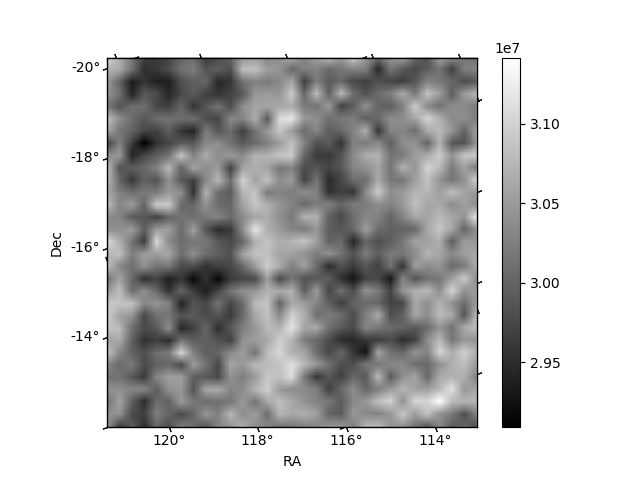
Histogram calculated using DETX and DETY for each event in the final _common_clean file
| Quadrant A | 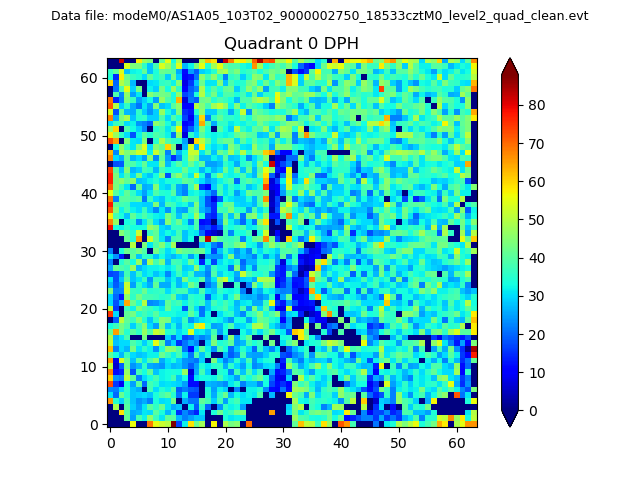 |
 |
Quadrant B |
|---|---|---|---|
| Quadrant D | 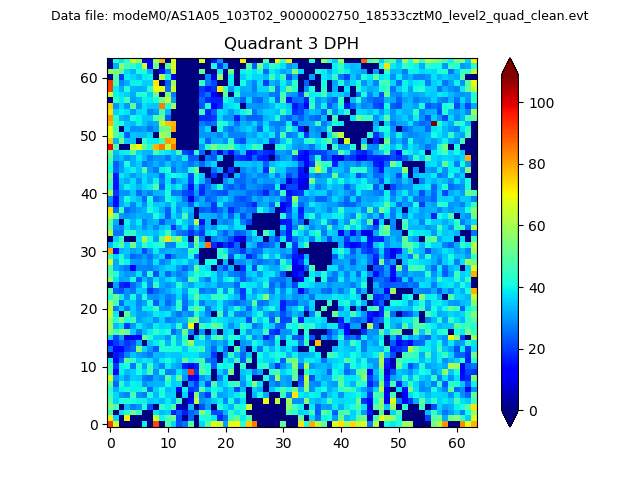 |
 |
Quadrant C |
| Plot type | Count rate plots | Images |
|---|---|---|
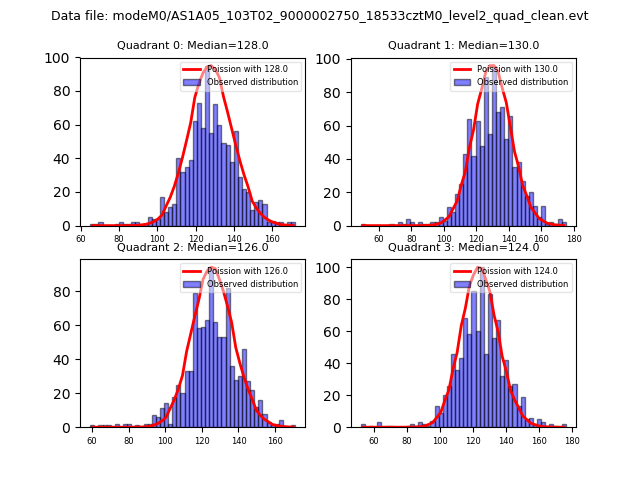
| Comparison with Poisson distribution Blue bars denote a histogram of data divided into 1 sec bins. Red curve is a Poisson curve with rate = median count rate of data. |
 |
 |
| Quadrant-wise count rates Data is divided into 100 sec bins |
 |
|
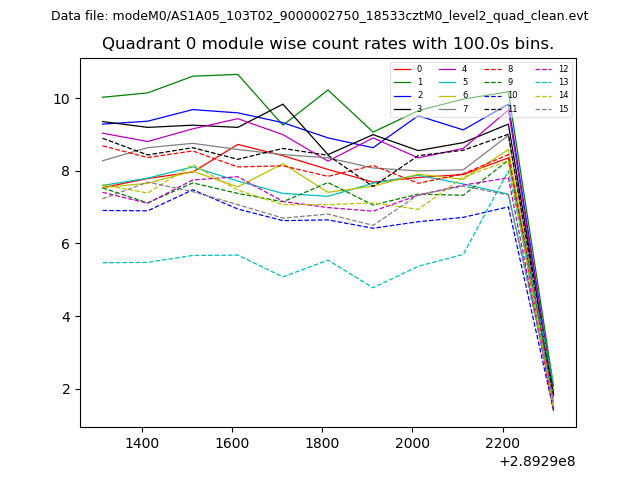
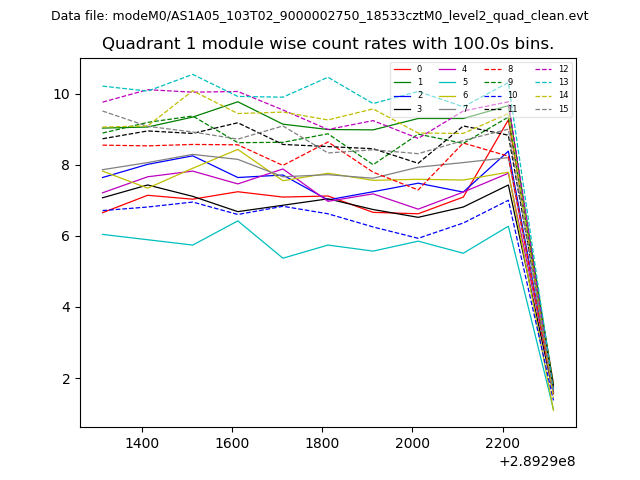
| Module-wise count rates for Quadrant A Data is divided into 100 sec bins |
 |
 |
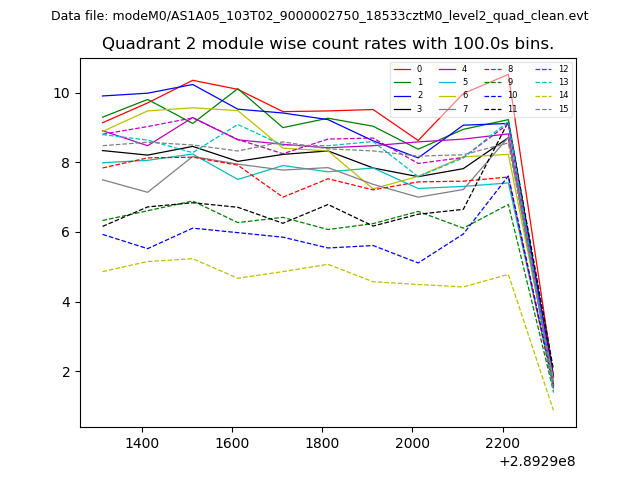
| Module-wise count rates for Quadrant B Data is divided into 100 sec bins |
 |
 |
| Module-wise count rates for Quadrant C Data is divided into 100 sec bins |
 |
 |
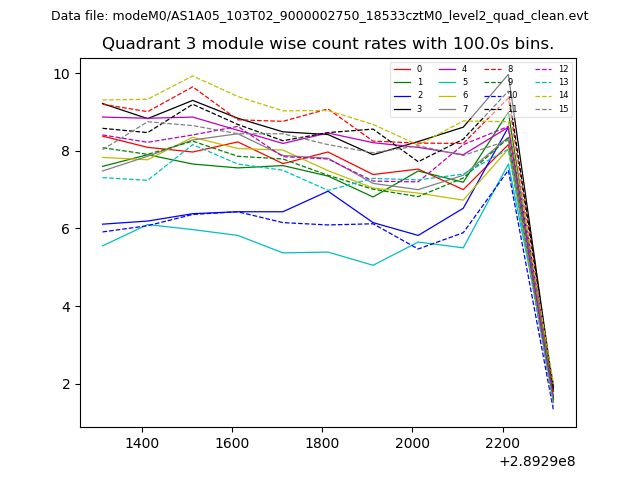
| Module-wise count rates for Quadrant D Data is divided into 100 sec bins |
 |
 |
| Parameter | Plot |
|---|---|
| CZT HV Monitor | 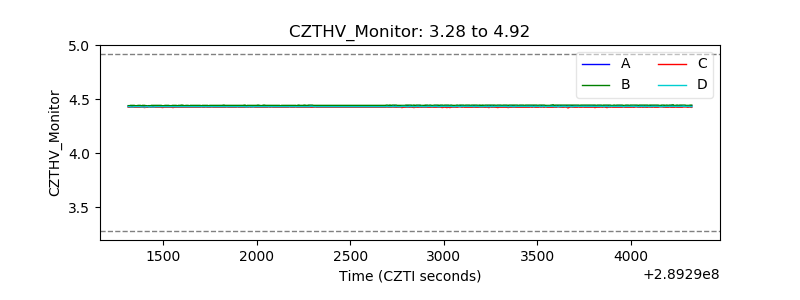 |
| D_VDD | 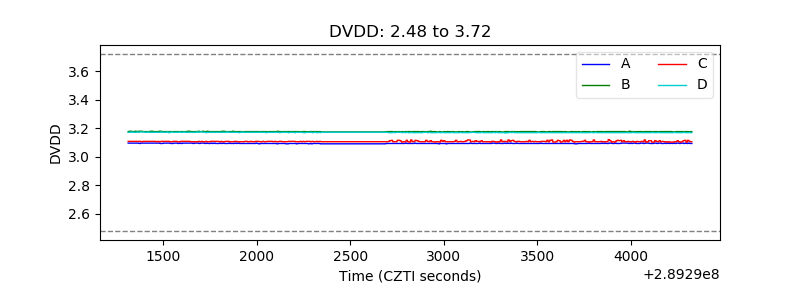 |
| Temperature 1 | 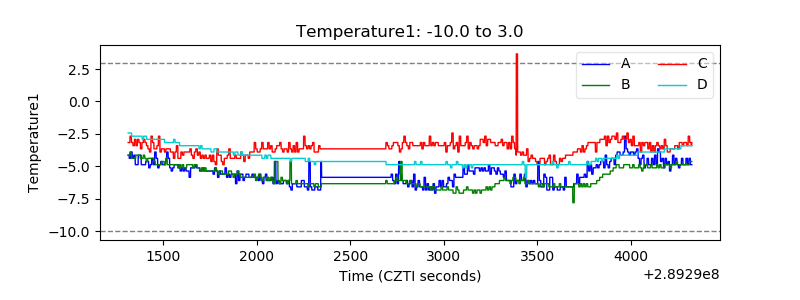 |
| Veto HV Monitor | 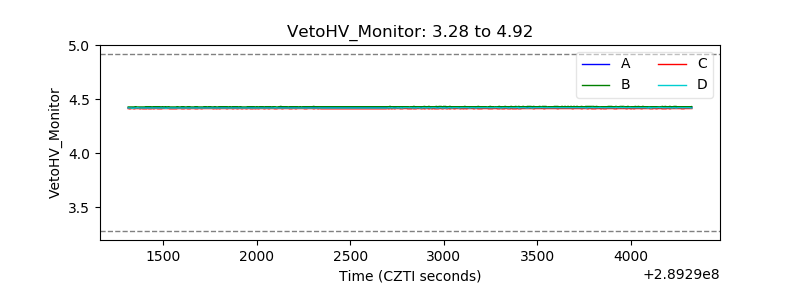 |
| Veto LLD | 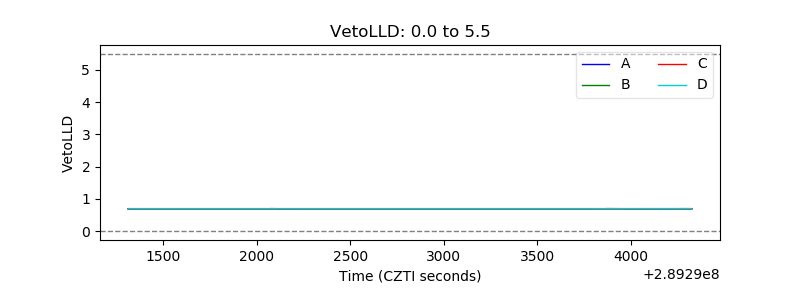 |
| Alpha Counter |  |
| _CPM_Rate | 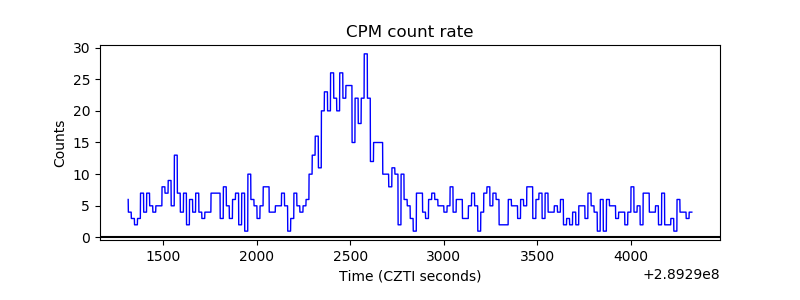 |
| CZT Counter |  |
| +2.5 Volts monitor |  |
| +5 Volts monitor |  |
| _ROLL_ROT | 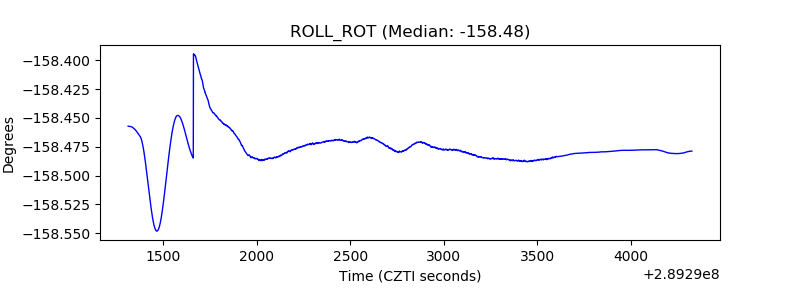 |
| _Roll_DEC | 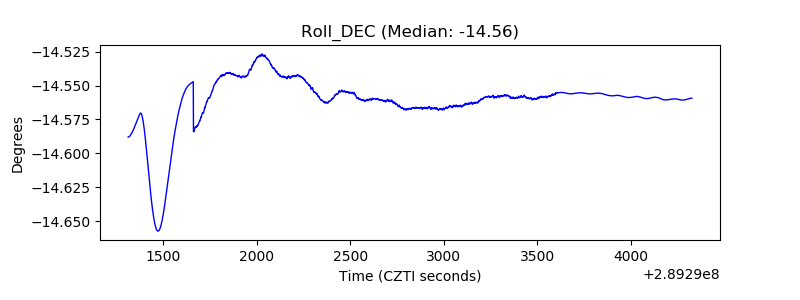 |
| _Roll_RA | 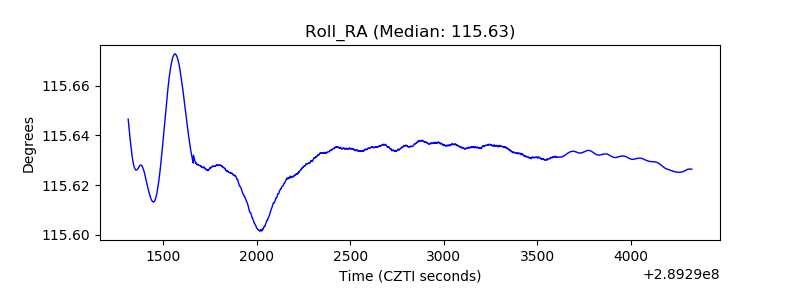 |
| Veto Counter | 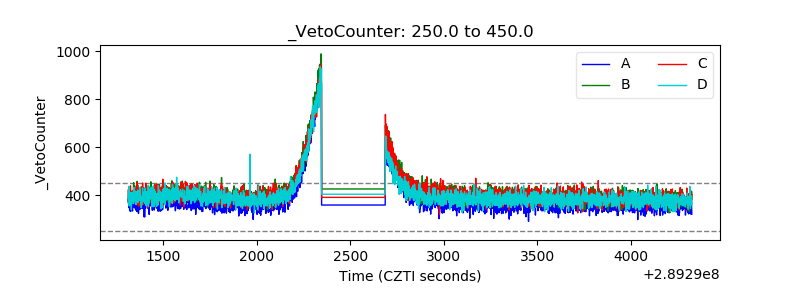 |