| Param | Original file | Final file |
|---|---|---|
| Filename | modeM0/AS1A05_103T02_9000002750_18535cztM0_level2.evt | modeM0/AS1A05_103T02_9000002750_18535cztM0_level2_quad_clean.evt |
| Size (bytes) | 930,882,240 | 153,984,960 |
| Size | 887.8 MB | 146.9 MB |
| Events in quadrant A | 6,383,154 | 944,095 |
| Events in quadrant B | 6,421,395 | 967,201 |
| Events in quadrant C | 6,187,918 | 946,031 |
| Events in quadrant D | 8,318,023 | 906,456 |
| Mode M9 | |||
|---|---|---|---|
| Quadrant | BADHDUFLAG | Total packets | Discarded packets |
| A | 0 | 15 | 0 |
| B | 0 | 15 | 0 |
| C | 0 | 15 | 0 |
| D | 0 | 15 | 0 |
| Mode M0 | |||
|---|---|---|---|
| Quadrant | BADHDUFLAG | Total packets | Discarded packets |
| A | 0 | 27383 | 3 |
| B | 0 | 27301 | 3 |
| C | 0 | 26654 | 3 |
| D | 0 | 33406 | 3 |
| Mode SS | |||
|---|---|---|---|
| Quadrant | BADHDUFLAG | Total packets | Discarded packets |
| A | 0 | 266 | 0 |
| B | 0 | 266 | 0 |
| C | 0 | 266 | 0 |
| D | 0 | 266 | 0 |
| Quadrant | Total seconds | Saturated seconds | Saturation percentage |
|---|---|---|---|
| A | 13020 | 284 | 2.181260% |
| B | 13020 | 274 | 2.104455% |
| C | 13020 | 261 | 2.004608% |
| D | 13021 | 568 | 4.362184% |
Noise dominated data is calculated using 1-second bins in cleaned event files. If a bin has >2000 counts, and if more than 50% of those come from <1% of pixels, then it is considered to be noise-dominated and hence unusable.
| Quadrant | # 1 sec bins | Bins with >0 counts | Bins with >2000 counts | High rate bins dominated by noise | Noise dominated (total time) | Noise dominated (detector-on time) | Marked lightcurve |
|---|---|---|---|---|---|---|---|
| A | 14580 | 13020 | 61 | 61 | 0.42% | 0.47% |  |
| B | 14580 | 13020 | 28 | 28 | 0.19% | 0.22% |  |
| C | 14580 | 13020 | 0 | 0 | 0.00% | 0.00% |  |
| D | 14581 | 13021 | 365 | 365 | 2.50% | 2.80% |  |
Top three noisy pixels from each quadrant. If the there are fewer than three noisy pixels in the level2.evt file, extra rows are filled as -1
| Pixel properties | Quadrant properties | ||||||
|---|---|---|---|---|---|---|---|
| Quadrant | DetID | PixID | Counts | Sigma | Mean | Median | Sigma |
| A | 0 | 13 | 279553 | 868.59 | 1575 | 1538 | 320.1 |
| A | 13 | 254 | 20505 | 59.26 | 1575 | 1538 | 320.1 |
| A | 15 | 174 | 15279 | 42.93 | 1575 | 1538 | 320.1 |
| B | 7 | 220 | 115372 | 373.81 | 1579 | 1535 | 304.5 |
| B | 15 | 222 | 42899 | 135.83 | 1579 | 1535 | 304.5 |
| B | 0 | 244 | 38997 | 123.01 | 1579 | 1535 | 304.5 |
| C | 14 | 238 | 233497 | 653.42 | 1519 | 1529 | 355.0 |
| C | 8 | 128 | 12148 | 29.91 | 1519 | 1529 | 355.0 |
| C | 3 | 233 | 10933 | 26.49 | 1519 | 1529 | 355.0 |
| D | 7 | 238 | 1257235 | 3350.81 | 1529 | 1484 | 374.8 |
| D | 1 | 52 | 861424 | 2294.64 | 1529 | 1484 | 374.8 |
| D | 15 | 0 | 191314 | 506.54 | 1529 | 1484 | 374.8 |
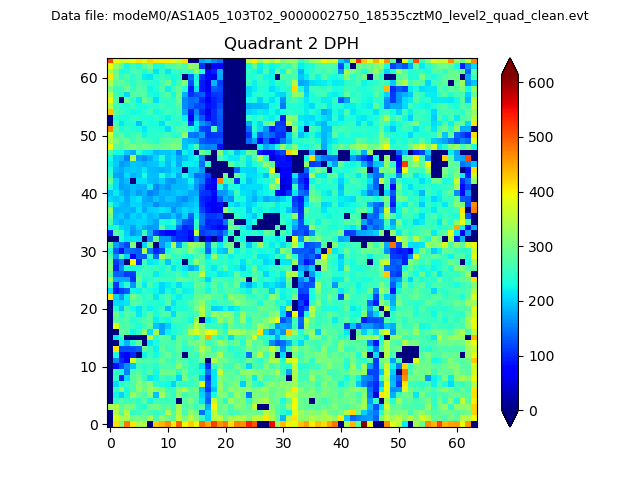
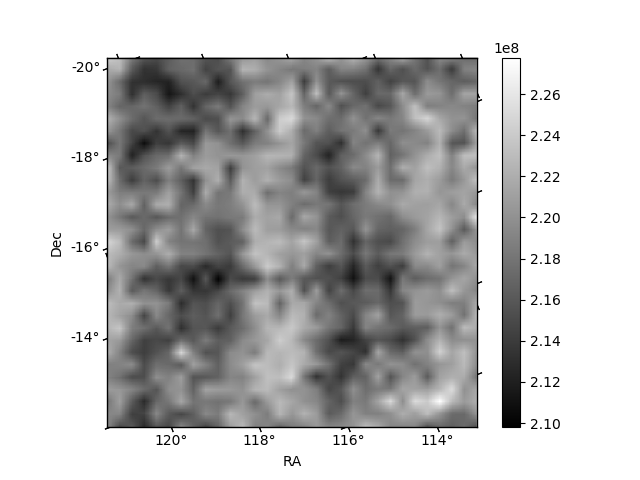
Histogram calculated using DETX and DETY for each event in the final _common_clean file
| Quadrant A | 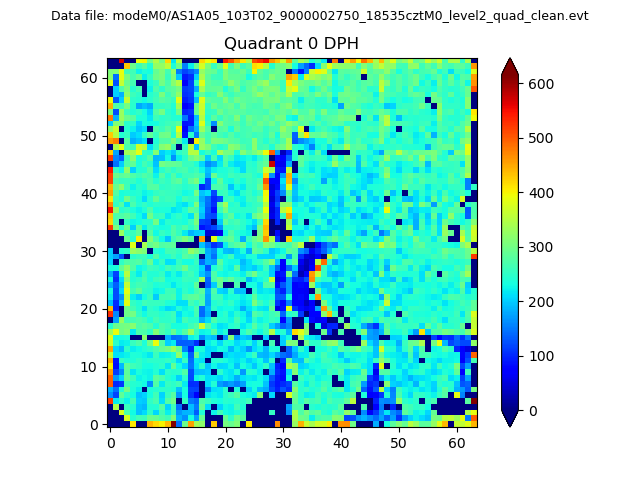 |
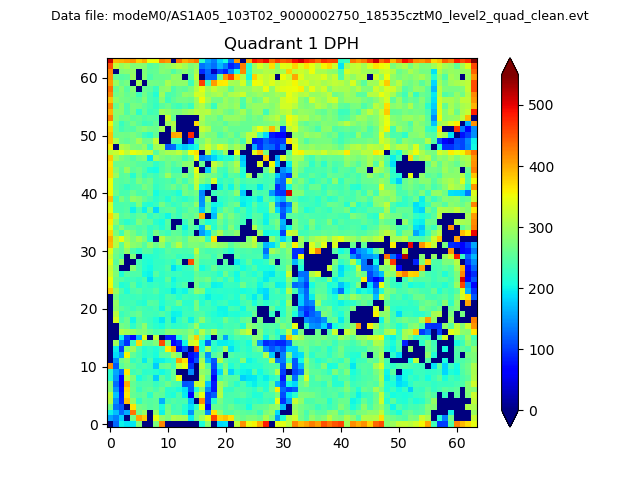 |
Quadrant B |
|---|---|---|---|
| Quadrant D | 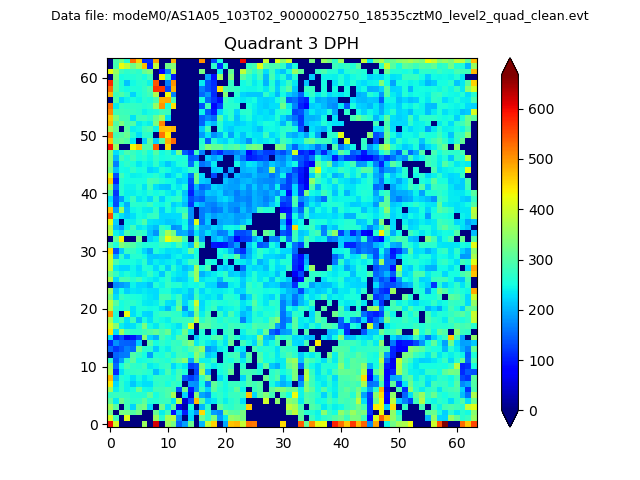 |
 |
Quadrant C |
| Plot type | Count rate plots | Images |
|---|---|---|
| Comparison with Poisson distribution Blue bars denote a histogram of data divided into 1 sec bins. Red curve is a Poisson curve with rate = median count rate of data. |
 |
 |
| Quadrant-wise count rates Data is divided into 100 sec bins |
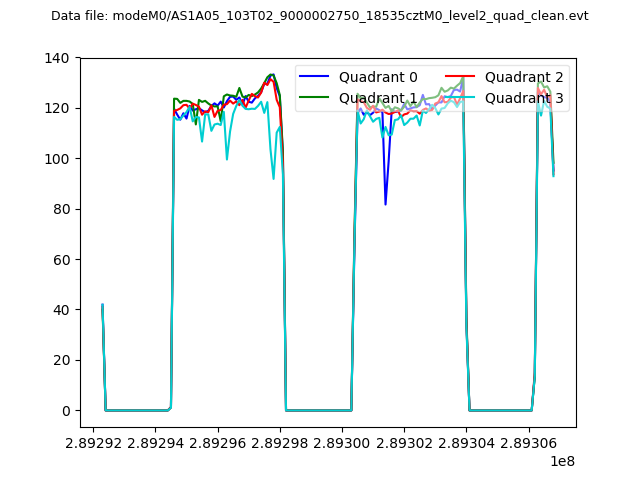 |
|
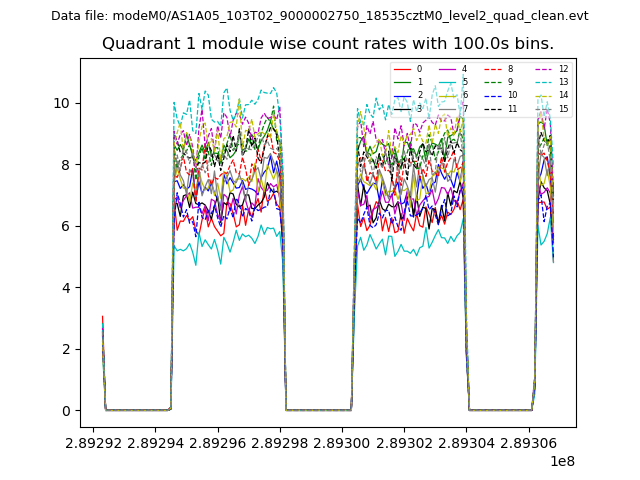
| Module-wise count rates for Quadrant A Data is divided into 100 sec bins |
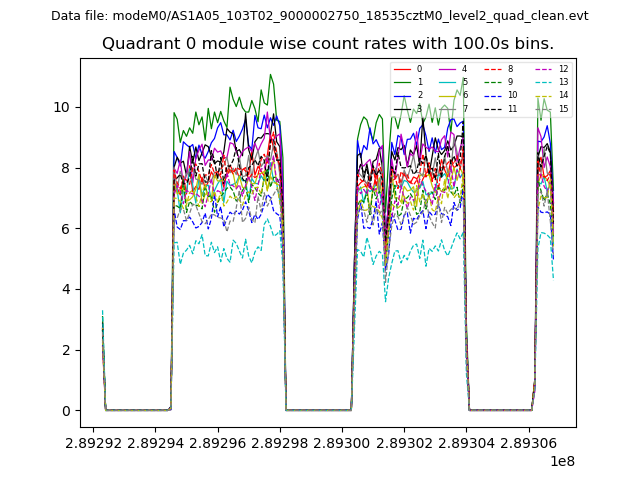 |
 |
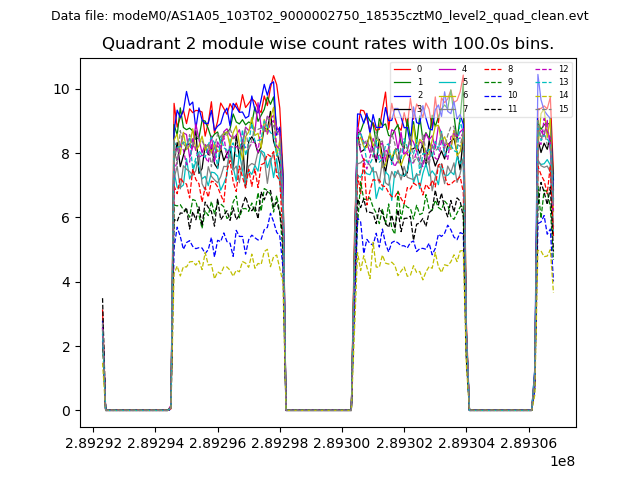
| Module-wise count rates for Quadrant B Data is divided into 100 sec bins |
 |
 |
| Module-wise count rates for Quadrant C Data is divided into 100 sec bins |
 |
 |
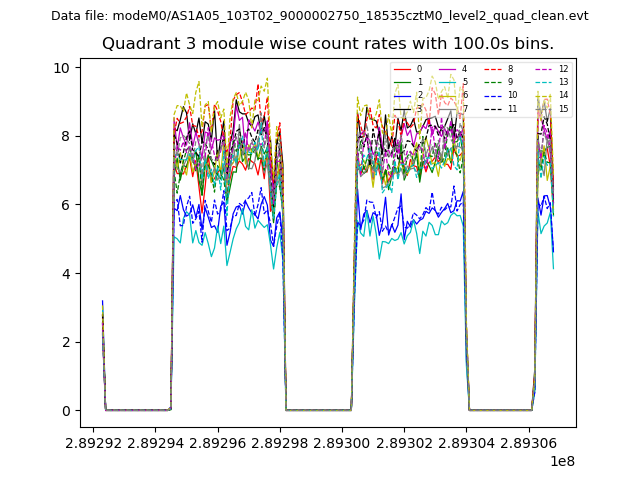
| Module-wise count rates for Quadrant D Data is divided into 100 sec bins |
 |
 |
| Parameter | Plot |
|---|---|
| CZT HV Monitor | 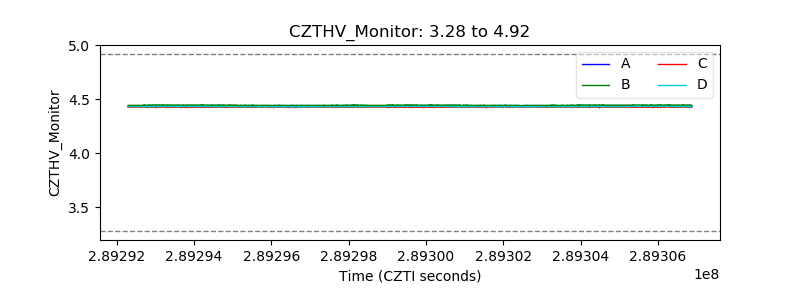 |
| D_VDD | 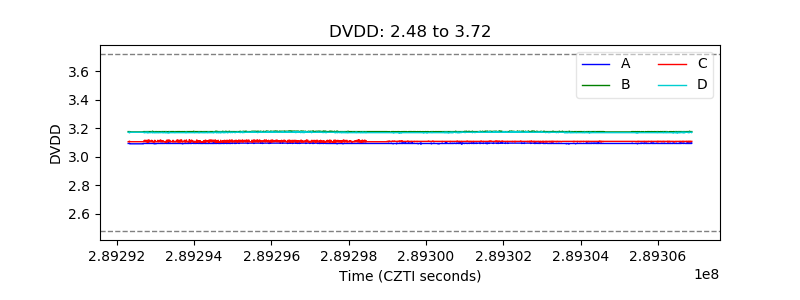 |
| Temperature 1 | 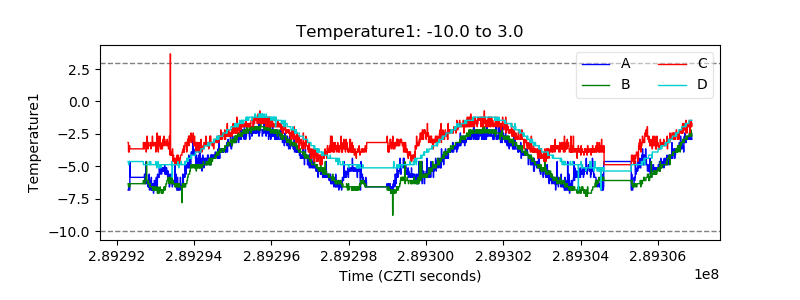 |
| Veto HV Monitor | 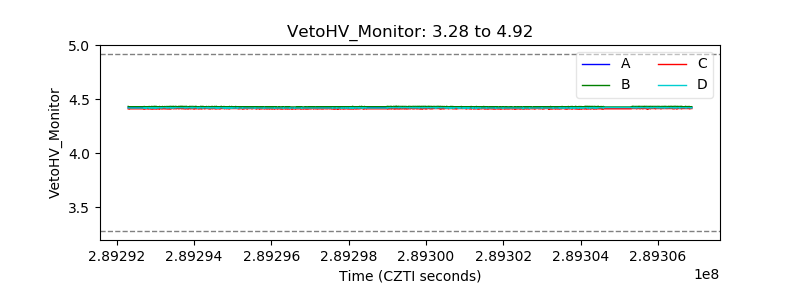 |
| Veto LLD | 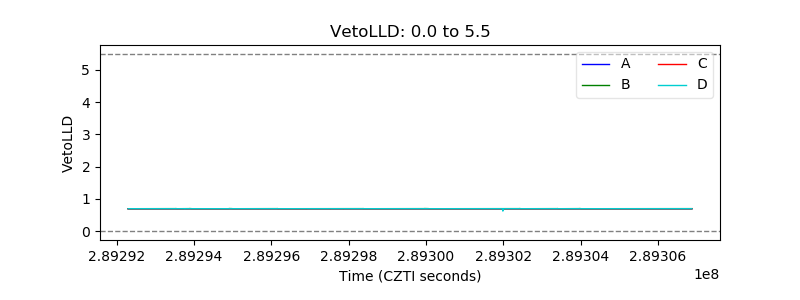 |
| Alpha Counter |  |
| _CPM_Rate | 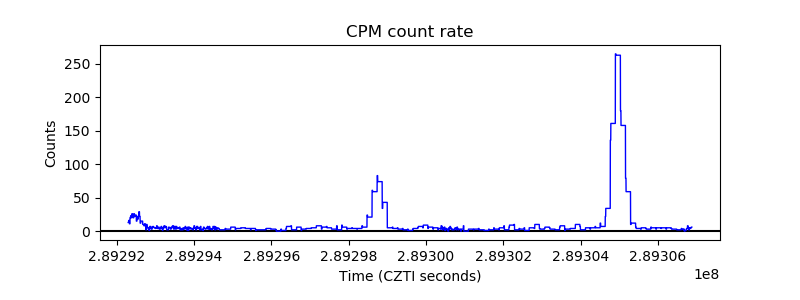 |
| CZT Counter |  |
| +2.5 Volts monitor |  |
| +5 Volts monitor |  |
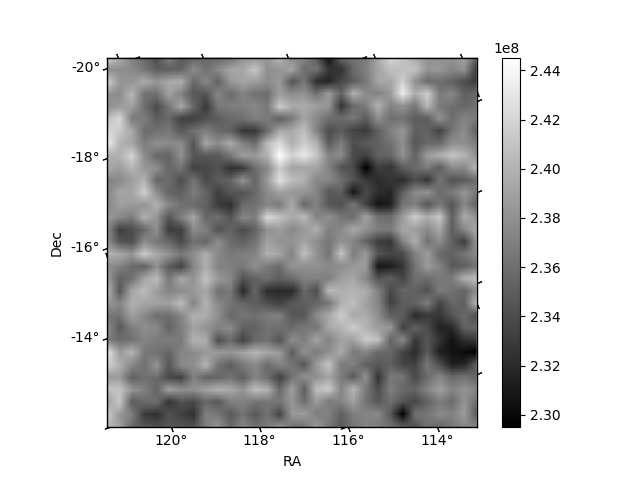
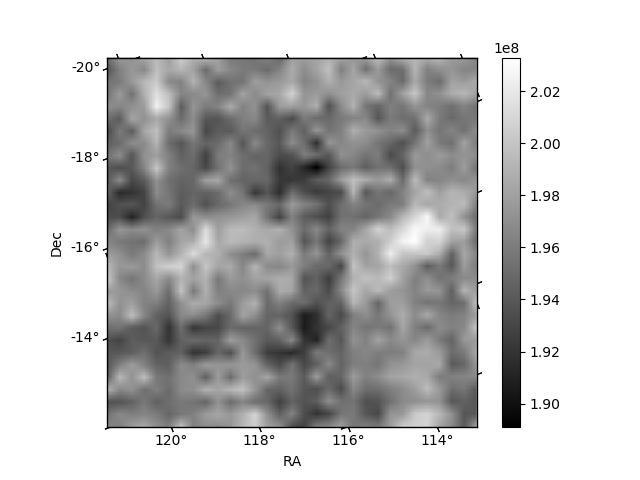
| _ROLL_ROT | 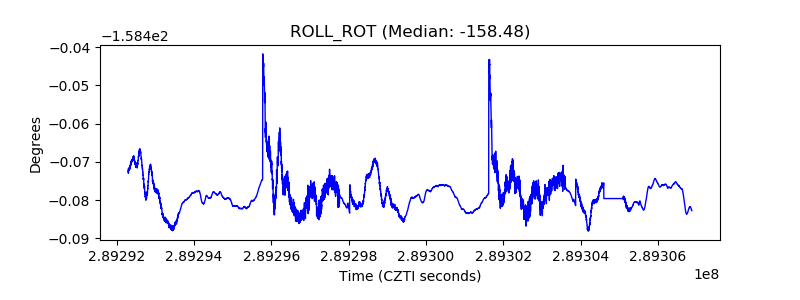 |
| _Roll_DEC | 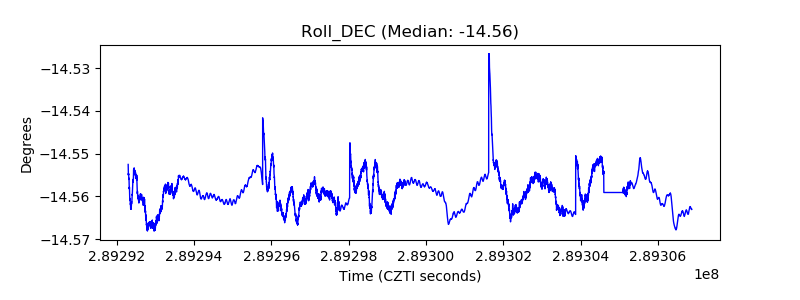 |
| _Roll_RA |  |
| Veto Counter | 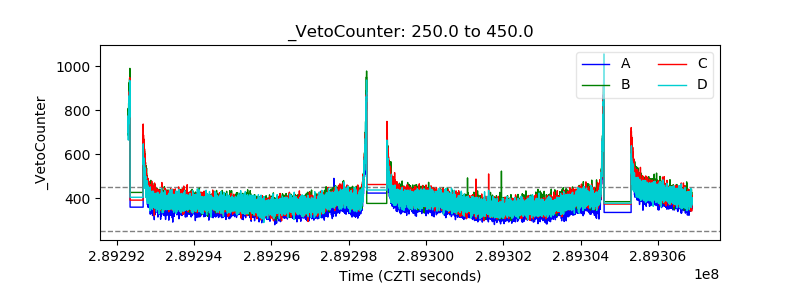 |