| Param | Original file | Final file |
|---|---|---|
| Filename | modeM0/AS1A05_103T02_9000002750_18537cztM0_level2.evt | modeM0/AS1A05_103T02_9000002750_18537cztM0_level2_quad_clean.evt |
| Size (bytes) | 190,255,680 | 37,532,160 |
| Size | 181.4 MB | 35.8 MB |
| Events in quadrant A | 1,237,004 | 241,261 |
| Events in quadrant B | 1,289,084 | 247,033 |
| Events in quadrant C | 1,223,668 | 239,184 |
| Events in quadrant D | 1,842,785 | 231,888 |
| Mode M9 | |||
|---|---|---|---|
| Quadrant | BADHDUFLAG | Total packets | Discarded packets |
| A | 0 | 9 | 0 |
| B | 0 | 9 | 0 |
| C | 0 | 9 | 0 |
| D | 0 | 9 | 0 |
| Mode M0 | |||
|---|---|---|---|
| Quadrant | BADHDUFLAG | Total packets | Discarded packets |
| A | 0 | 5175 | 1 |
| B | 0 | 5363 | 1 |
| C | 0 | 5191 | 1 |
| D | 0 | 7144 | 1 |
| Mode SS | |||
|---|---|---|---|
| Quadrant | BADHDUFLAG | Total packets | Discarded packets |
| A | 0 | 52 | 0 |
| B | 0 | 52 | 0 |
| C | 0 | 52 | 0 |
| D | 0 | 52 | 0 |
| Quadrant | Total seconds | Saturated seconds | Saturation percentage |
|---|---|---|---|
| A | 2455 | 43 | 1.751527% |
| B | 2456 | 53 | 2.157980% |
| C | 2456 | 62 | 2.524430% |
| D | 2456 | 170 | 6.921824% |
Noise dominated data is calculated using 1-second bins in cleaned event files. If a bin has >2000 counts, and if more than 50% of those come from <1% of pixels, then it is considered to be noise-dominated and hence unusable.
| Quadrant | # 1 sec bins | Bins with >0 counts | Bins with >2000 counts | High rate bins dominated by noise | Noise dominated (total time) | Noise dominated (detector-on time) | Marked lightcurve |
|---|---|---|---|---|---|---|---|
| A | 3345 | 2455 | 0 | 0 | 0.00% | 0.00% | 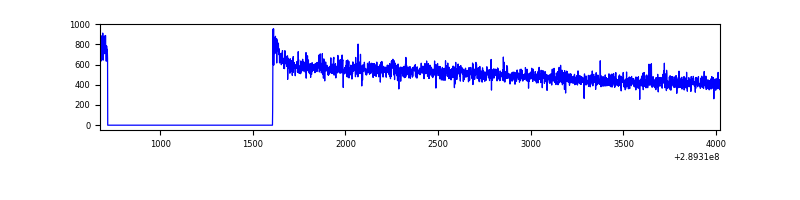 |
| B | 3346 | 2456 | 1 | 1 | 0.03% | 0.04% | 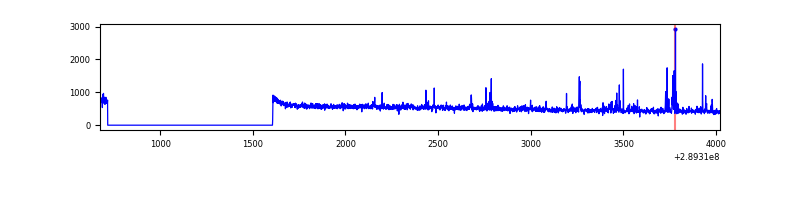 |
| C | 3346 | 2456 | 0 | 0 | 0.00% | 0.00% | 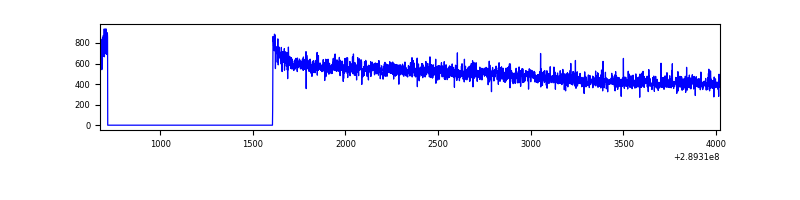 |
| D | 3346 | 2456 | 103 | 103 | 3.08% | 4.19% | 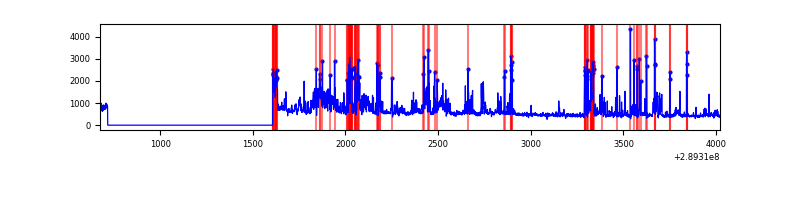 |
Top three noisy pixels from each quadrant. If the there are fewer than three noisy pixels in the level2.evt file, extra rows are filled as -1
| Pixel properties | Quadrant properties | ||||||
|---|---|---|---|---|---|---|---|
| Quadrant | DetID | PixID | Counts | Sigma | Mean | Median | Sigma |
| A | 13 | 254 | 3920 | 53.61 | 320 | 312 | 67.3 |
| A | 0 | 226 | 2849 | 37.7 | 320 | 312 | 67.3 |
| A | 3 | 137 | 2495 | 32.44 | 320 | 312 | 67.3 |
| B | 3 | 64 | 29241 | 461.52 | 316 | 308 | 62.7 |
| B | 7 | 220 | 8725 | 134.26 | 316 | 308 | 62.7 |
| B | 12 | 111 | 7246 | 110.67 | 316 | 308 | 62.7 |
| C | 14 | 238 | 47265 | 662.75 | 301 | 301 | 70.9 |
| C | 3 | 233 | 2724 | 34.19 | 301 | 301 | 70.9 |
| C | 13 | 61 | 2083 | 25.15 | 301 | 301 | 70.9 |
| D | 7 | 238 | 503081 | 6711.8 | 303 | 294 | 74.9 |
| D | 1 | 52 | 85873 | 1142.41 | 303 | 294 | 74.9 |
| D | 10 | 70 | 44386 | 588.59 | 303 | 294 | 74.9 |
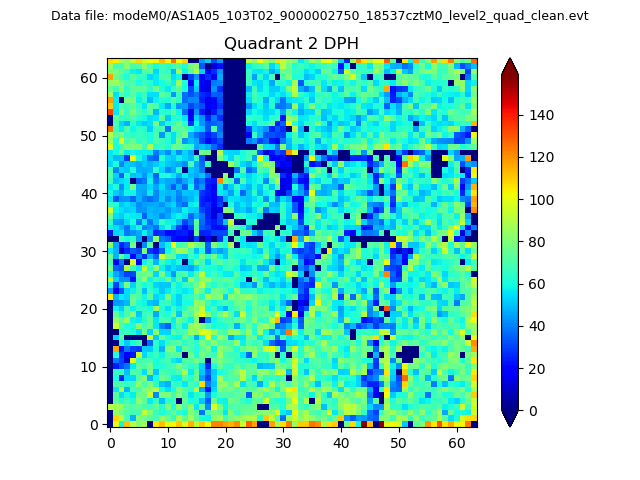
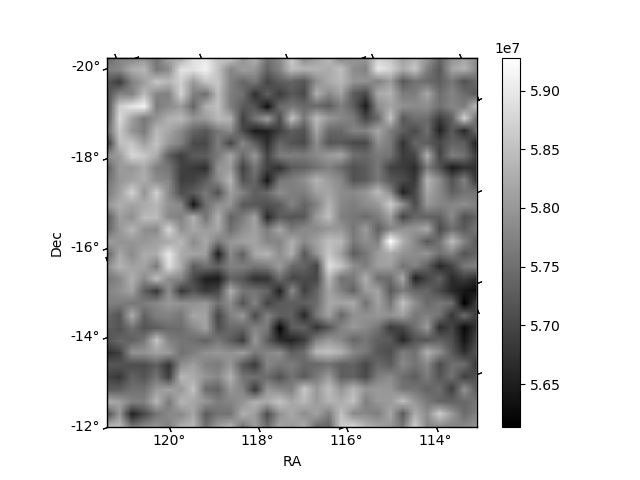
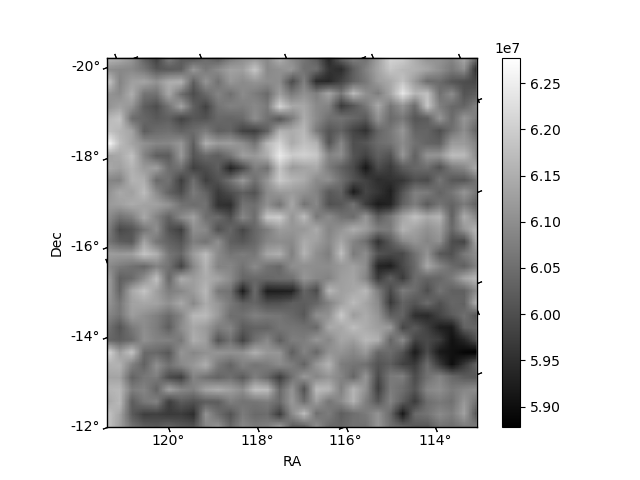
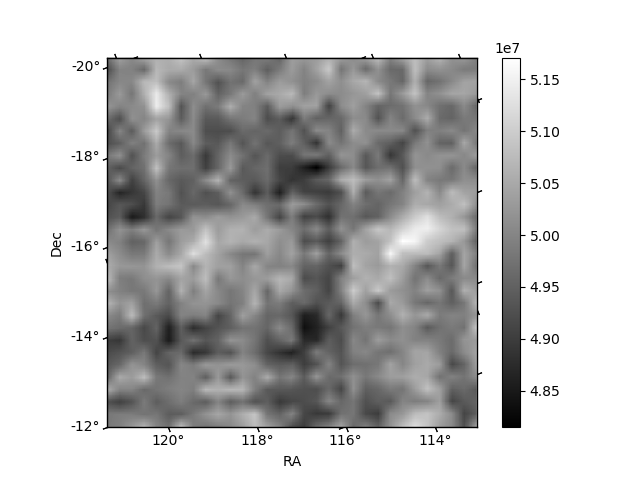
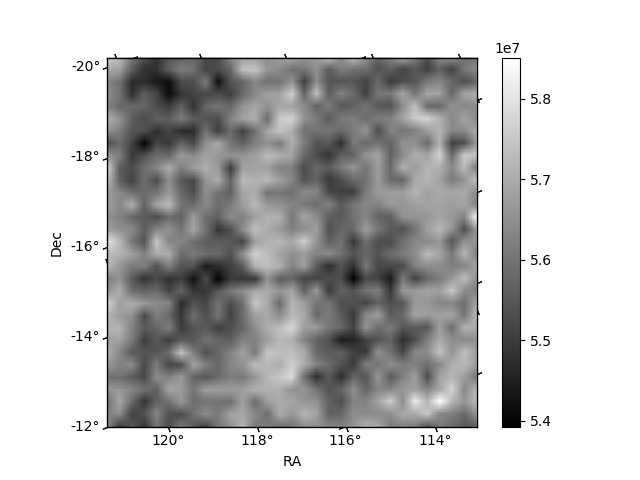
Histogram calculated using DETX and DETY for each event in the final _common_clean file
| Quadrant A | 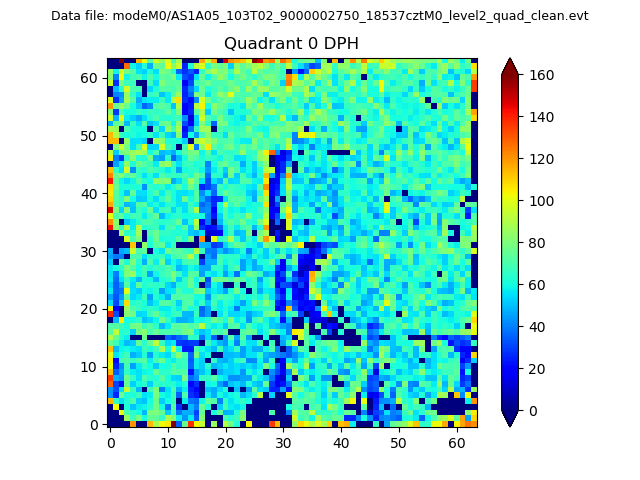 |
 |
Quadrant B |
|---|---|---|---|
| Quadrant D |  |
 |
Quadrant C |
| Plot type | Count rate plots | Images |
|---|---|---|
| Comparison with Poisson distribution Blue bars denote a histogram of data divided into 1 sec bins. Red curve is a Poisson curve with rate = median count rate of data. |
 |
 |
| Quadrant-wise count rates Data is divided into 100 sec bins |
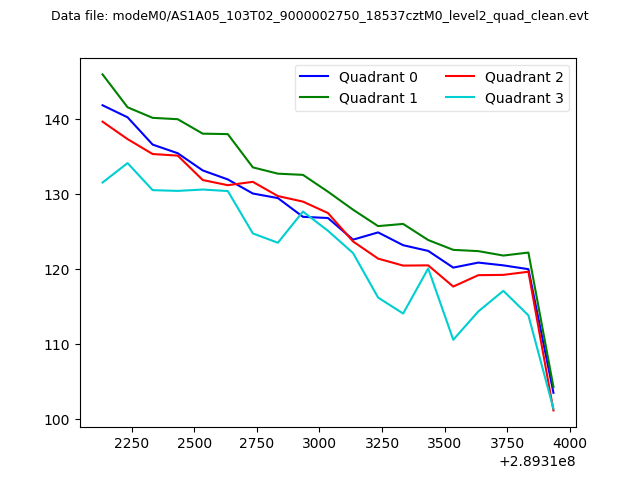 |
|
| Module-wise count rates for Quadrant A Data is divided into 100 sec bins |
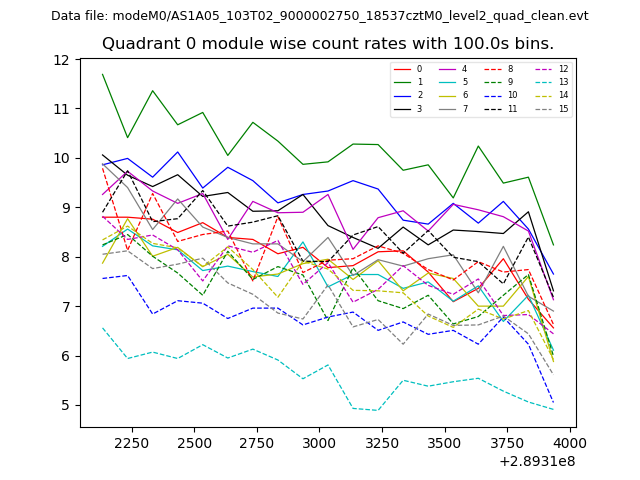 |
 |
| Module-wise count rates for Quadrant B Data is divided into 100 sec bins |
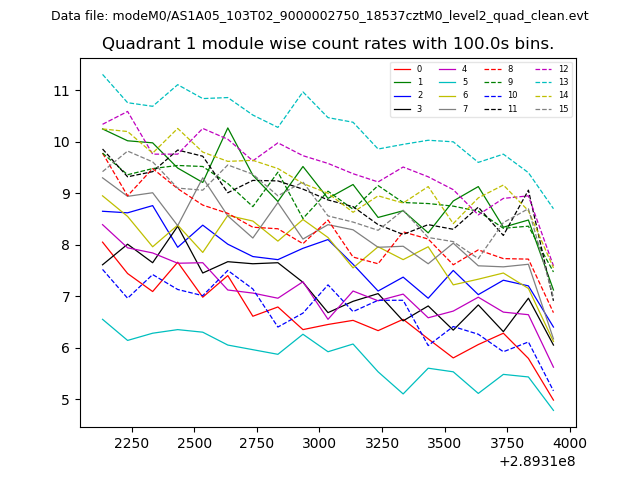 |
 |
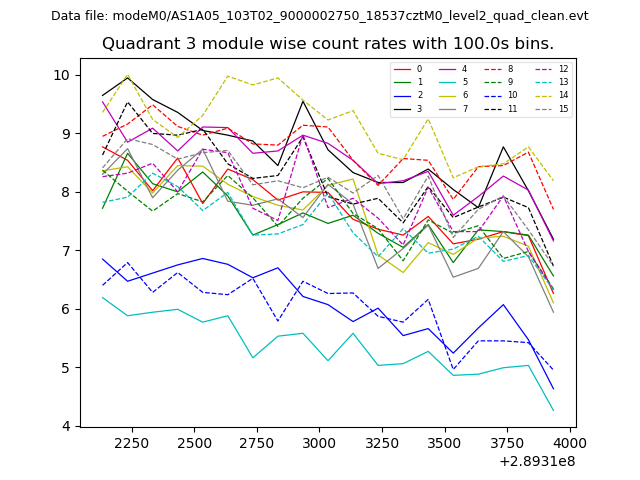
| Module-wise count rates for Quadrant C Data is divided into 100 sec bins |
 |
 |
| Module-wise count rates for Quadrant D Data is divided into 100 sec bins |
 |
 |
| Parameter | Plot |
|---|---|
| CZT HV Monitor |  |
| D_VDD | 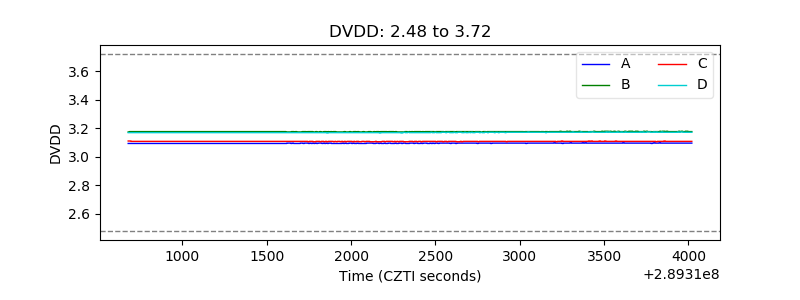 |
| Temperature 1 | 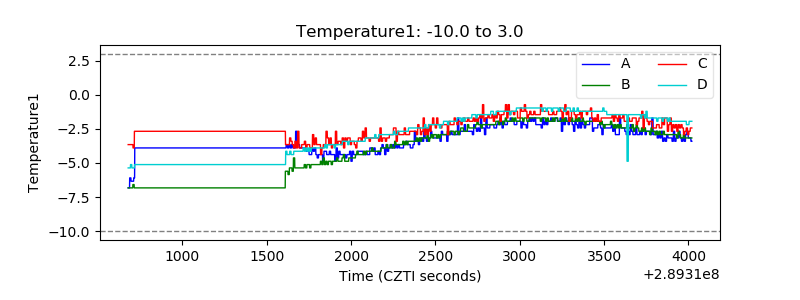 |
| Veto HV Monitor | 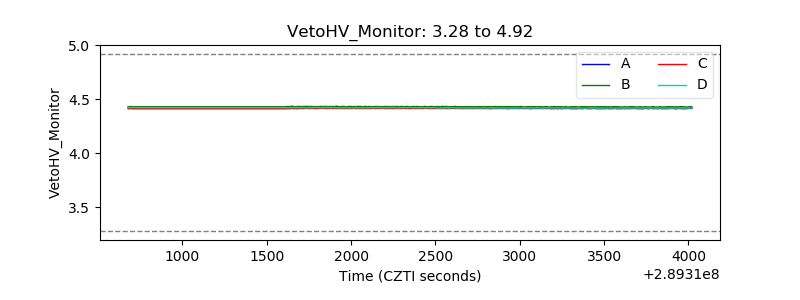 |
| Veto LLD | 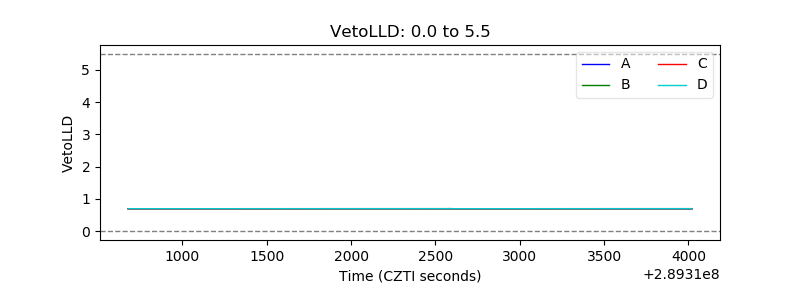 |
| Alpha Counter | 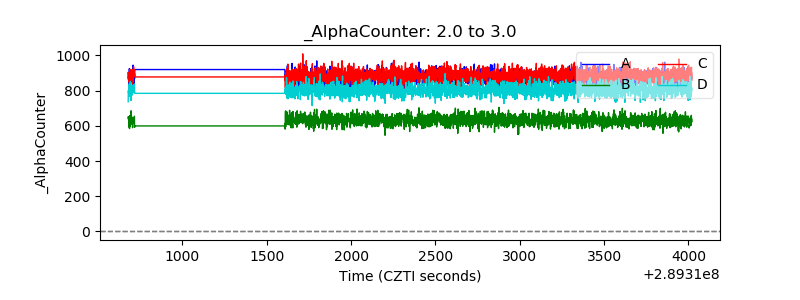 |
| _CPM_Rate | 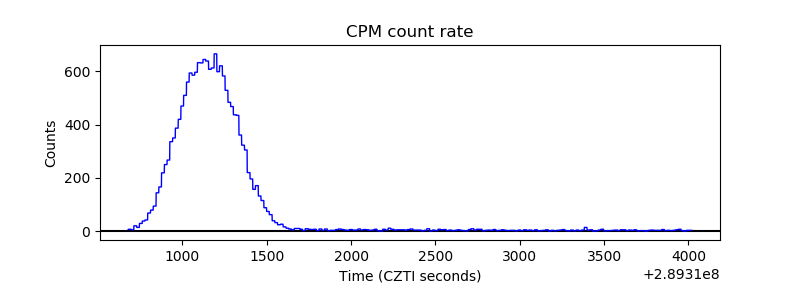 |
| CZT Counter | 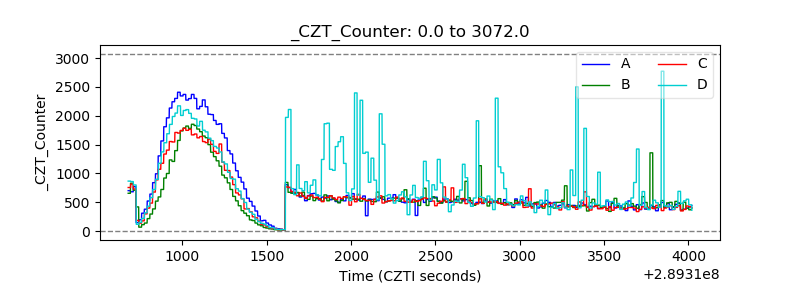 |
| +2.5 Volts monitor |  |
| +5 Volts monitor |  |
| _ROLL_ROT | 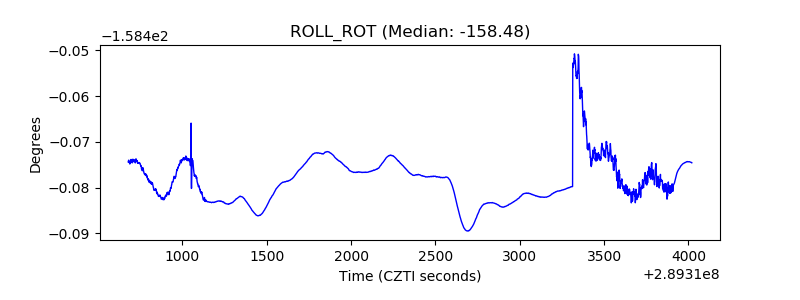 |
| _Roll_DEC | 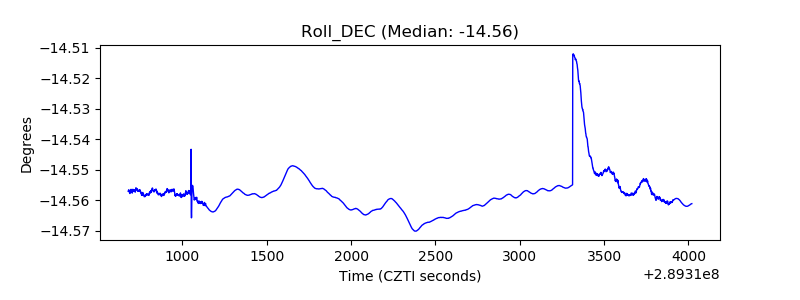 |
| _Roll_RA | 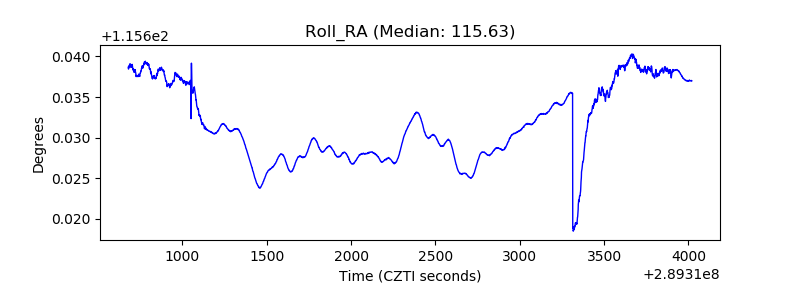 |
| Veto Counter | 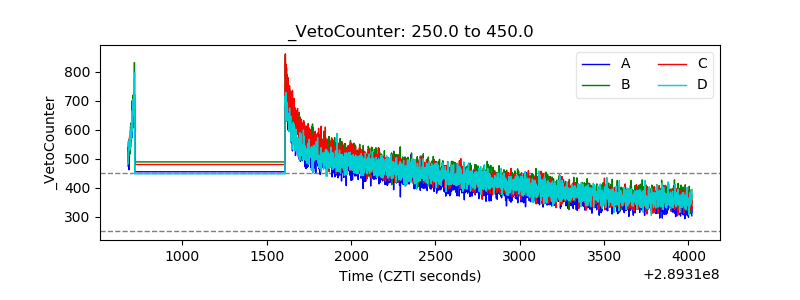 |