| Param | Original file | Final file |
|---|---|---|
| Filename | modeM0/AS1A05_104T02_9000002752cztM0_level2.fits | modeM0/AS1A05_104T02_9000002752cztM0_level2_quad_clean.evt |
| Size (bytes) | 145,788,480 | 99,694,080 |
| Size | 139.0 MB | 95.1 MB |
| Events in quadrant A | 903,248 | 532,974 |
| Events in quadrant B | 881,466 | 540,984 |
| Events in quadrant C | 890,502 | 514,635 |
| Events in quadrant D | 750,362 | 440,521 |
| Mode M9 | |||
|---|---|---|---|
| Quadrant | BADHDUFLAG | Total packets | Discarded packets |
| A | 0 | 35 | 0 |
| B | 0 | 35 | 0 |
| C | 0 | 35 | 0 |
| D | 0 | 35 | 0 |
| Mode M0 | |||
|---|---|---|---|
| Quadrant | BADHDUFLAG | Total packets | Discarded packets |
| A | 0 | 37116 | 0 |
| B | 0 | 31720 | 0 |
| C | 0 | 30324 | 0 |
| D | 0 | 48405 | 0 |
| Mode SS | |||
|---|---|---|---|
| Quadrant | BADHDUFLAG | Total packets | Discarded packets |
| A | 0 | 292 | 0 |
| B | 0 | 292 | 0 |
| C | 0 | 292 | 0 |
| D | 0 | 292 | 0 |
| Quadrant | Total seconds | Saturated seconds | Saturation percentage |
|---|---|---|---|
| A | 14324 | 873 | 6.094666% |
| B | 14324 | 262 | 1.829098% |
| C | 14324 | 244 | 1.703435% |
| D | 14324 | 1517 | 10.590617% |
Noise dominated data is calculated using 1-second bins in cleaned event files. If a bin has >2000 counts, and if more than 50% of those come from <1% of pixels, then it is considered to be noise-dominated and hence unusable.
| Quadrant | # 1 sec bins | Bins with >0 counts | Bins with >2000 counts | High rate bins dominated by noise | Noise dominated (total time) | Noise dominated (detector-on time) | Marked lightcurve |
|---|---|---|---|---|---|---|---|
| A | 17764 | 14308 | 0 | 0 | 0.00% | 0.00% |  |
| B | 17764 | 14320 | 0 | 0 | 0.00% | 0.00% | 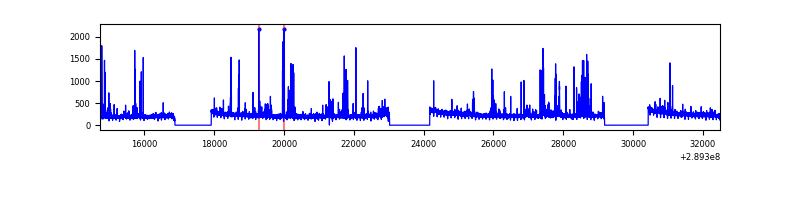 |
| C | 17764 | 14321 | 0 | 0 | 0.00% | 0.00% | 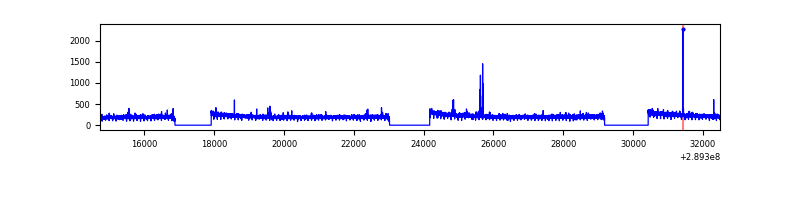 |
| D | 17764 | 14306 | 0 | 0 | 0.00% | 0.00% | 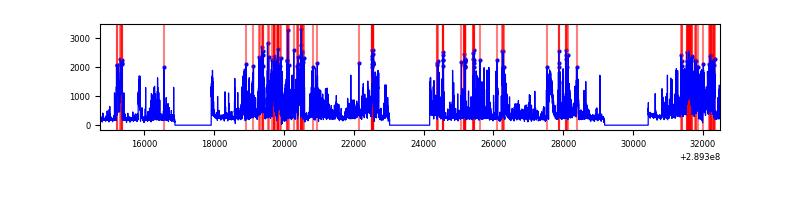 |
Top three noisy pixels from each quadrant. If the there are fewer than three noisy pixels in the level2.evt file, extra rows are filled as -1
| Pixel properties | Quadrant properties | ||||||
|---|---|---|---|---|---|---|---|
| Quadrant | DetID | PixID | Counts | Sigma | Mean | Median | Sigma |
| A | 14 | 188 | 909 | 11.74 | 234 | 221 | 58.6 |
| A | 14 | 204 | 765 | 9.28 | 234 | 221 | 58.6 |
| A | 0 | 29 | 729 | 8.67 | 234 | 221 | 58.6 |
| B | 2 | 9 | 705 | 10.1 | 232 | 222 | 47.8 |
| B | 2 | 8 | 587 | 7.63 | 232 | 222 | 47.8 |
| B | 3 | 17 | 581 | 7.51 | 232 | 222 | 47.8 |
| C | 12 | 241 | 621 | 6.41 | 235 | 221 | 62.4 |
| C | 3 | 126 | 616 | 6.33 | 235 | 221 | 62.4 |
| C | 7 | 111 | 610 | 6.23 | 235 | 221 | 62.4 |
| D | 10 | 190 | 584 | 6.67 | 214 | 196 | 58.2 |
| D | 15 | 46 | 536 | 5.85 | 214 | 196 | 58.2 |
| D | 1 | 3 | 535 | 5.83 | 214 | 196 | 58.2 |
Histogram calculated using DETX and DETY for each event in the final _common_clean file
| Quadrant A | 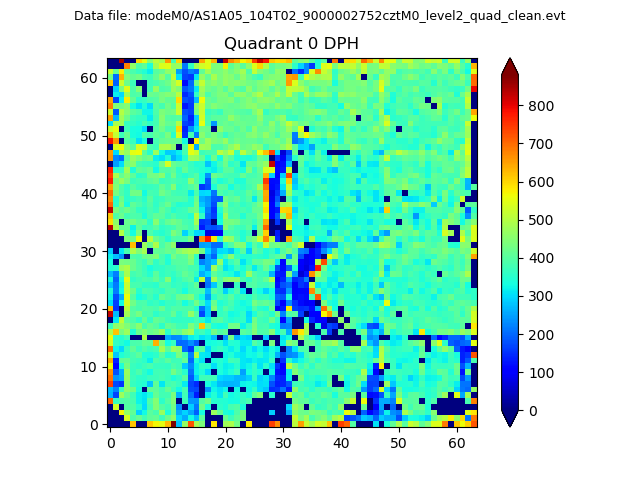 |
 |
Quadrant B |
|---|---|---|---|
| Quadrant D | 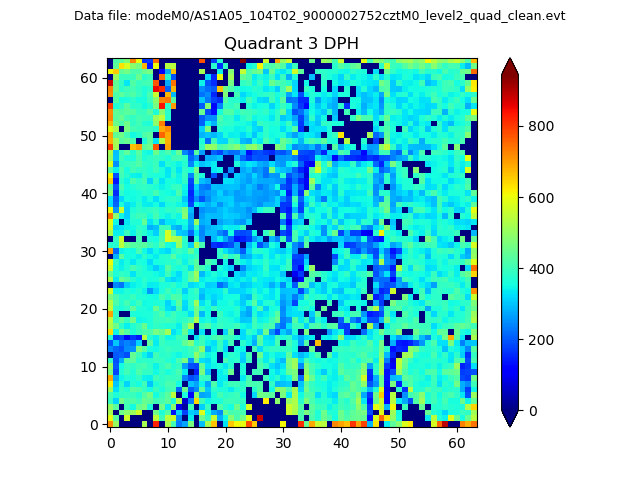 |
 |
Quadrant C |
| Plot type | Count rate plots | Images |
|---|---|---|
| Comparison with Poisson distribution Blue bars denote a histogram of data divided into 1 sec bins. Red curve is a Poisson curve with rate = median count rate of data. |
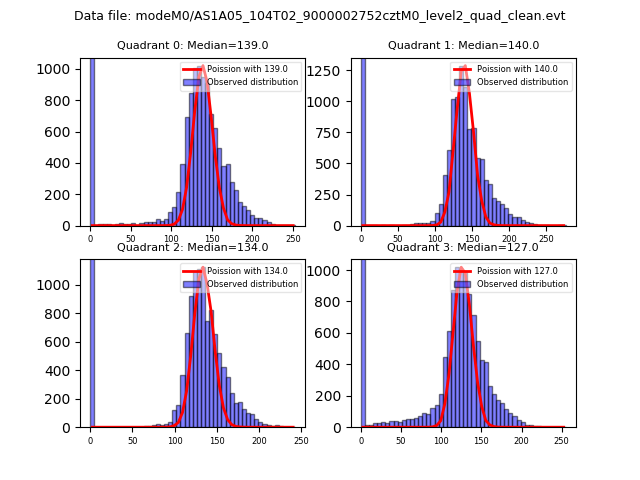 |
 |
| Quadrant-wise count rates Data is divided into 100 sec bins |
 |
|
| Module-wise count rates for Quadrant A Data is divided into 100 sec bins |
 |
 |
| Module-wise count rates for Quadrant B Data is divided into 100 sec bins |
 |
 |
| Module-wise count rates for Quadrant C Data is divided into 100 sec bins |
 |
 |
| Module-wise count rates for Quadrant D Data is divided into 100 sec bins |
 |
 |
| Parameter | Plot |
|---|---|
| CZT HV Monitor |  |
| D_VDD | 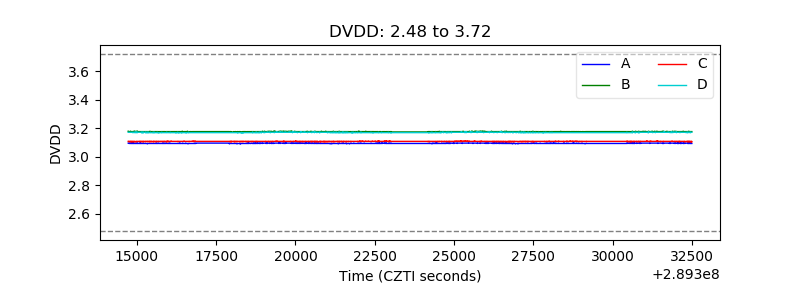 |
| Temperature 1 | 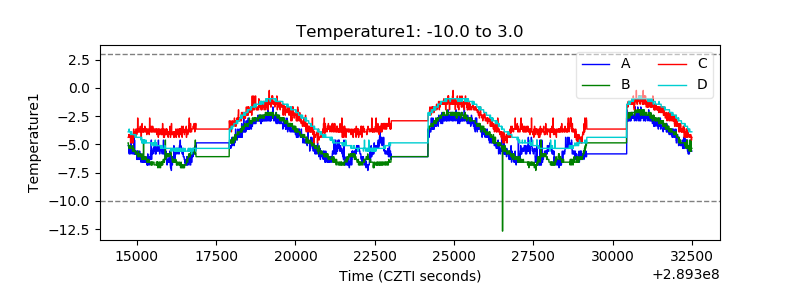 |
| Veto HV Monitor | 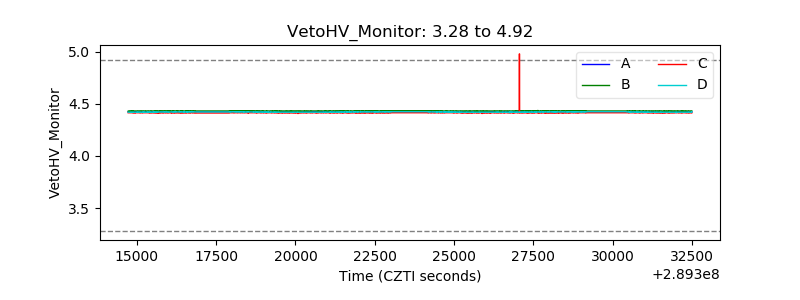 |
| Veto LLD |  |
| Alpha Counter |  |
| _CPM_Rate |  |
| CZT Counter |  |
| +2.5 Volts monitor |  |
| +5 Volts monitor | 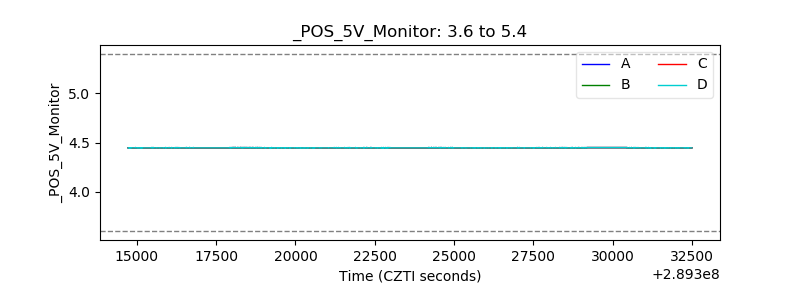 |
| _ROLL_ROT |  |
| _Roll_DEC |  |
| _Roll_RA |  |
| Veto Counter |  |