| Param | Original file | Final file |
|---|---|---|
| Filename | modeM0/AS1A05_104T02_9000002752_18537cztM0_level2.evt | modeM0/AS1A05_104T02_9000002752_18537cztM0_level2_quad_clean.evt |
| Size (bytes) | 290,004,480 | 52,462,080 |
| Size | 276.6 MB | 50.0 MB |
| Events in quadrant A | 1,872,692 | 341,679 |
| Events in quadrant B | 1,926,552 | 344,729 |
| Events in quadrant C | 1,827,833 | 327,521 |
| Events in quadrant D | 2,903,689 | 313,298 |
| Mode M9 | |||
|---|---|---|---|
| Quadrant | BADHDUFLAG | Total packets | Discarded packets |
| A | 0 | 11 | 0 |
| B | 0 | 11 | 0 |
| C | 0 | 11 | 0 |
| D | 0 | 11 | 0 |
| Mode M0 | |||
|---|---|---|---|
| Quadrant | BADHDUFLAG | Total packets | Discarded packets |
| A | 0 | 8054 | 1 |
| B | 0 | 8105 | 1 |
| C | 0 | 7782 | 2 |
| D | 0 | 11182 | 1 |
| Mode SS | |||
|---|---|---|---|
| Quadrant | BADHDUFLAG | Total packets | Discarded packets |
| A | 0 | 74 | 0 |
| B | 0 | 74 | 0 |
| C | 0 | 74 | 0 |
| D | 0 | 74 | 0 |
| Quadrant | Total seconds | Saturated seconds | Saturation percentage |
|---|---|---|---|
| A | 3697 | 75 | 2.028672% |
| B | 3697 | 76 | 2.055721% |
| C | 3696 | 74 | 2.002165% |
| D | 3696 | 278 | 7.521645% |
Noise dominated data is calculated using 1-second bins in cleaned event files. If a bin has >2000 counts, and if more than 50% of those come from <1% of pixels, then it is considered to be noise-dominated and hence unusable.
| Quadrant | # 1 sec bins | Bins with >0 counts | Bins with >2000 counts | High rate bins dominated by noise | Noise dominated (total time) | Noise dominated (detector-on time) | Marked lightcurve |
|---|---|---|---|---|---|---|---|
| A | 4737 | 3697 | 11 | 11 | 0.23% | 0.30% | 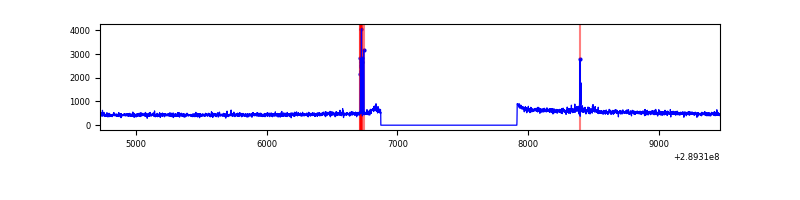 |
| B | 4737 | 3697 | 16 | 16 | 0.34% | 0.43% | 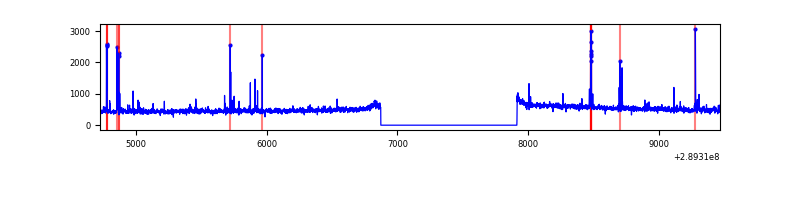 |
| C | 4736 | 3696 | 0 | 0 | 0.00% | 0.00% | 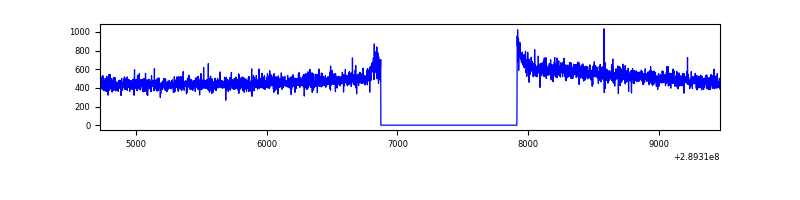 |
| D | 4736 | 3696 | 221 | 221 | 4.67% | 5.98% | 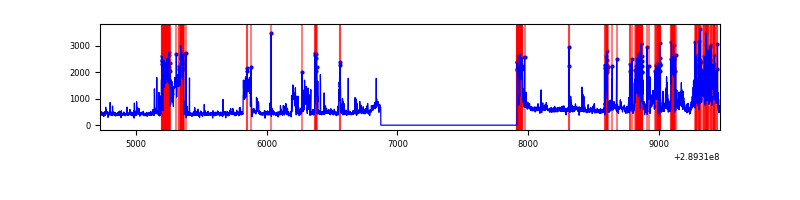 |
Top three noisy pixels from each quadrant. If the there are fewer than three noisy pixels in the level2.evt file, extra rows are filled as -1
| Pixel properties | Quadrant properties | ||||||
|---|---|---|---|---|---|---|---|
| Quadrant | DetID | PixID | Counts | Sigma | Mean | Median | Sigma |
| A | 0 | 13 | 48803 | 501.82 | 473 | 464 | 96.3 |
| A | 13 | 254 | 5674 | 54.09 | 473 | 464 | 96.3 |
| A | 0 | 226 | 4240 | 39.2 | 473 | 464 | 96.3 |
| B | 3 | 64 | 70769 | 767.43 | 469 | 456 | 91.6 |
| B | 4 | 80 | 13452 | 141.85 | 469 | 456 | 91.6 |
| B | 12 | 111 | 10796 | 112.86 | 469 | 456 | 91.6 |
| C | 14 | 238 | 69182 | 644.57 | 451 | 455 | 106.6 |
| C | 13 | 61 | 3152 | 25.29 | 451 | 455 | 106.6 |
| C | 3 | 233 | 1631 | 11.03 | 451 | 455 | 106.6 |
| D | 7 | 238 | 772943 | 6953.17 | 449 | 437 | 111.1 |
| D | 1 | 52 | 361657 | 3251.27 | 449 | 437 | 111.1 |
| D | 7 | 96 | 39488 | 351.49 | 449 | 437 | 111.1 |
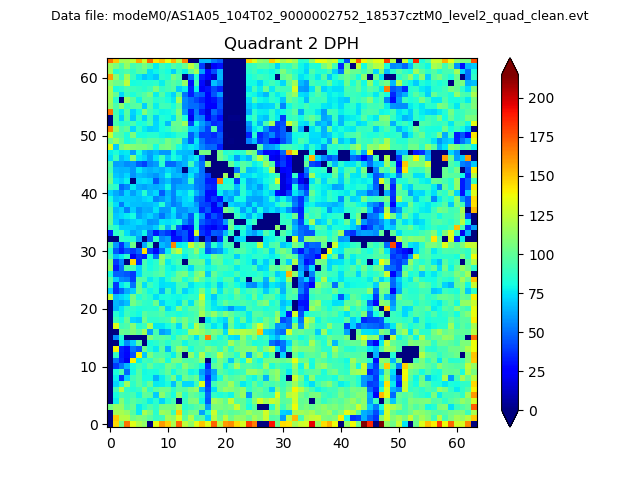
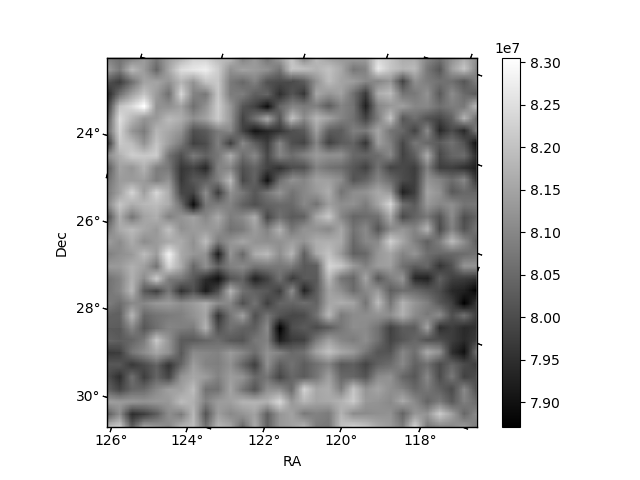
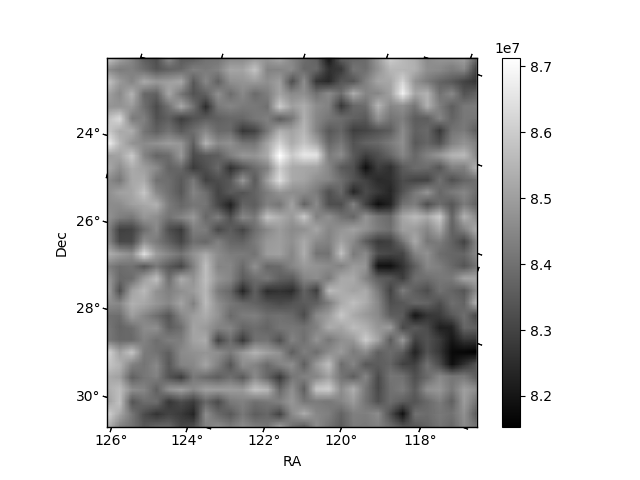
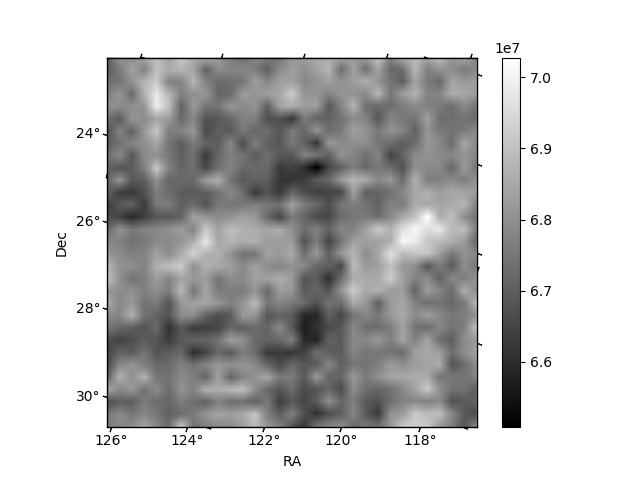
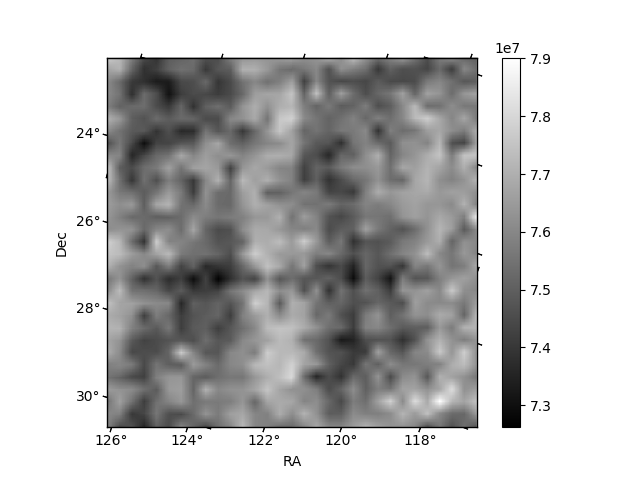
Histogram calculated using DETX and DETY for each event in the final _common_clean file
| Quadrant A | 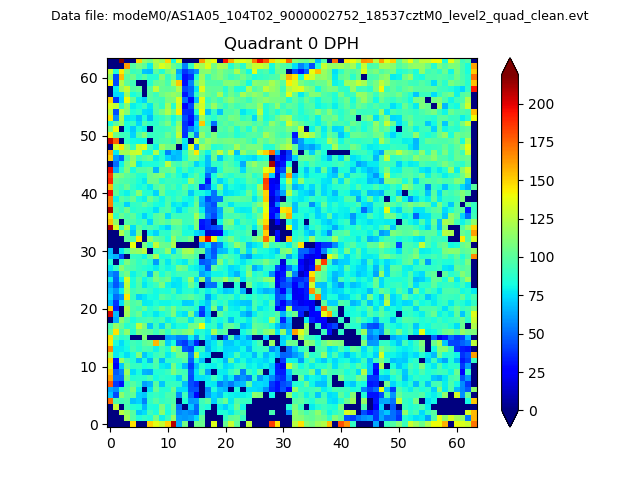 |
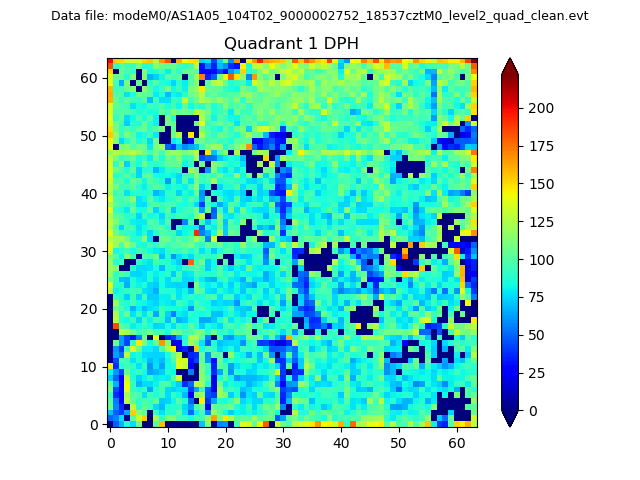 |
Quadrant B |
|---|---|---|---|
| Quadrant D | 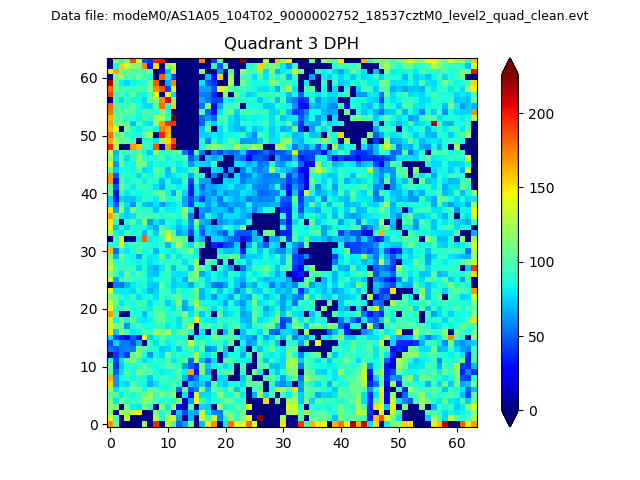 |
 |
Quadrant C |
| Plot type | Count rate plots | Images |
|---|---|---|
| Comparison with Poisson distribution Blue bars denote a histogram of data divided into 1 sec bins. Red curve is a Poisson curve with rate = median count rate of data. |
 |
 |
| Quadrant-wise count rates Data is divided into 100 sec bins |
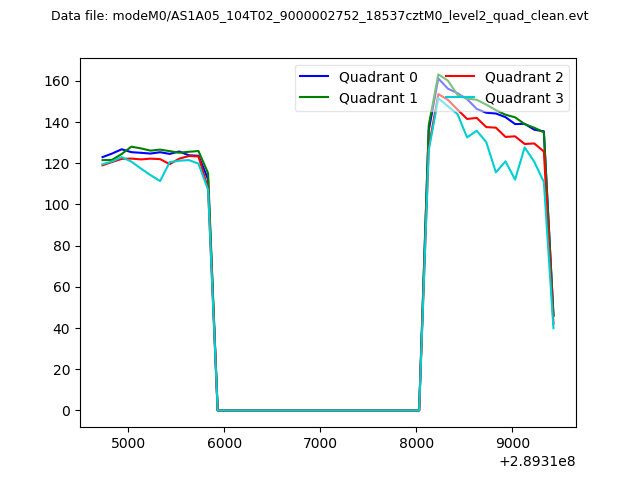 |
|
| Module-wise count rates for Quadrant A Data is divided into 100 sec bins |
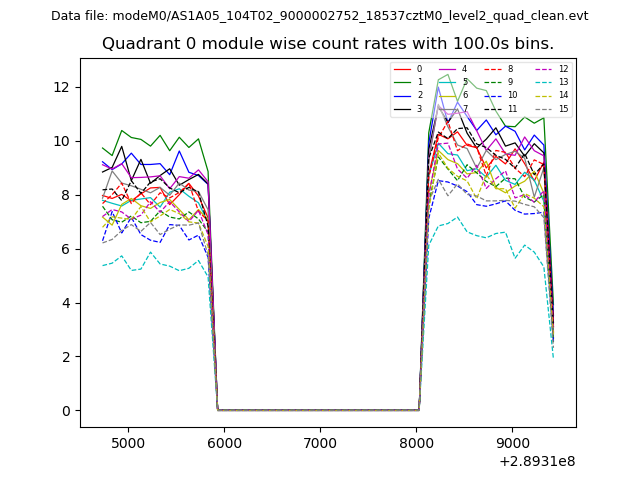 |
 |
| Module-wise count rates for Quadrant B Data is divided into 100 sec bins |
 |
 |
| Module-wise count rates for Quadrant C Data is divided into 100 sec bins |
 |
 |
| Module-wise count rates for Quadrant D Data is divided into 100 sec bins |
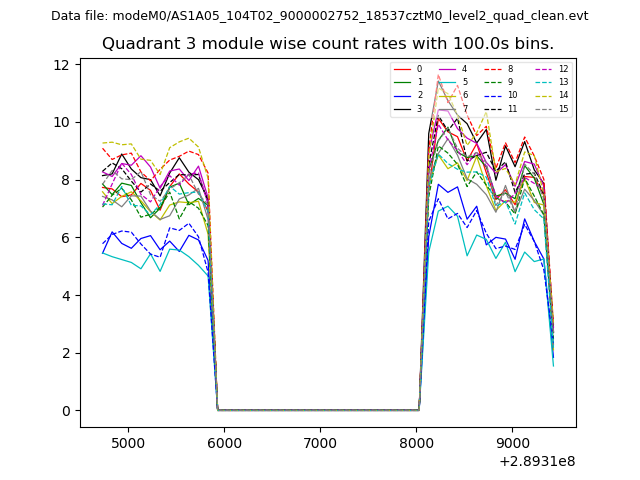 |
 |
| Parameter | Plot |
|---|---|
| CZT HV Monitor |  |
| D_VDD | 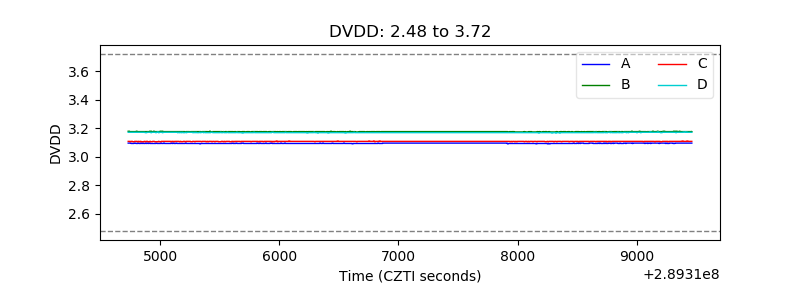 |
| Temperature 1 | 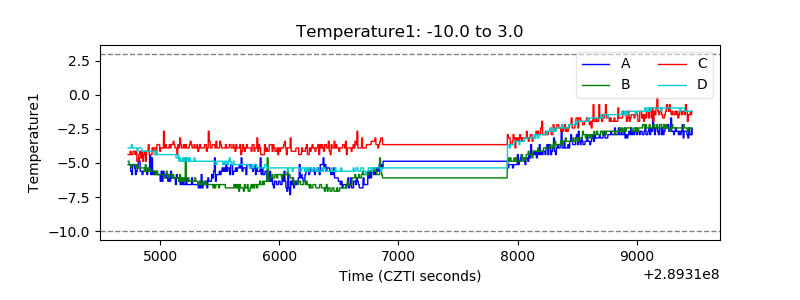 |
| Veto HV Monitor | 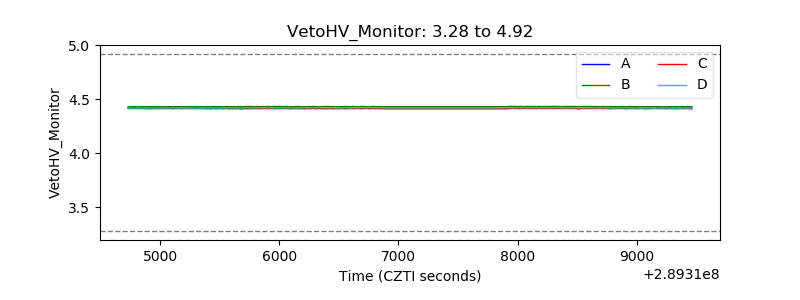 |
| Veto LLD | 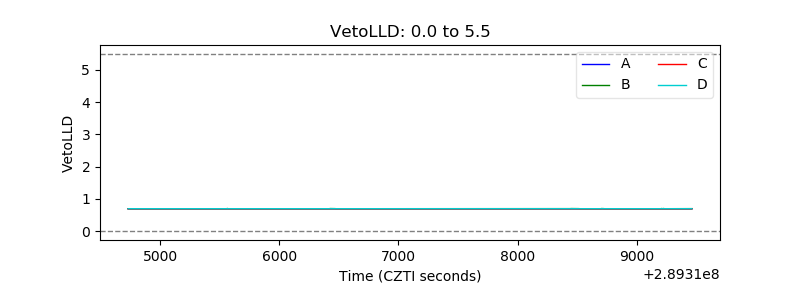 |
| Alpha Counter | 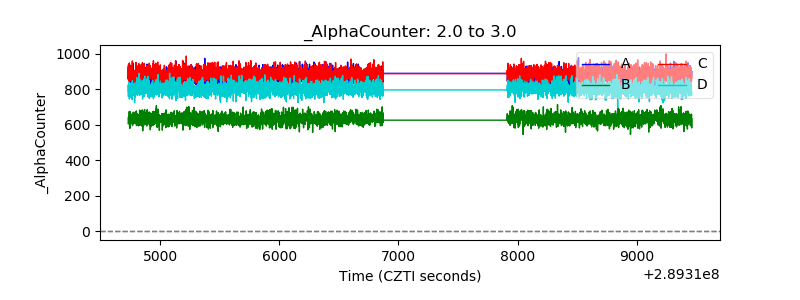 |
| _CPM_Rate | 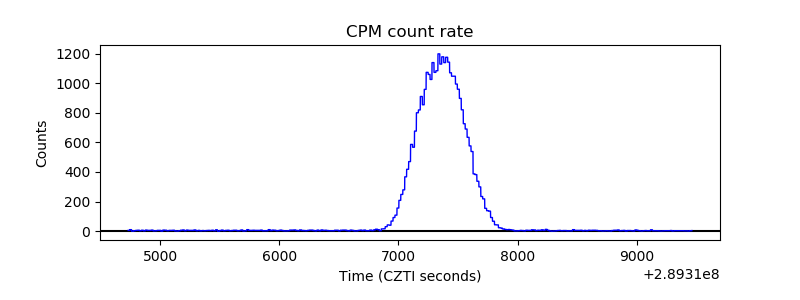 |
| CZT Counter | 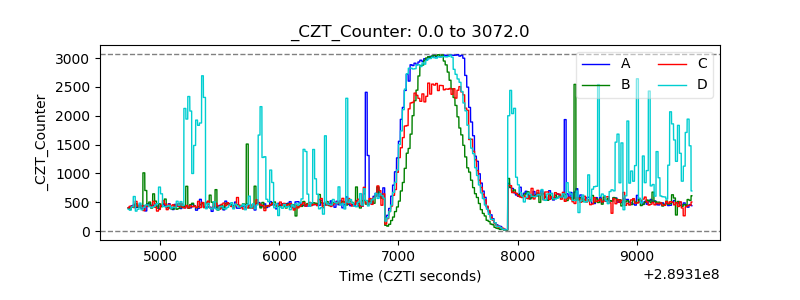 |
| +2.5 Volts monitor |  |
| +5 Volts monitor |  |
| _ROLL_ROT | 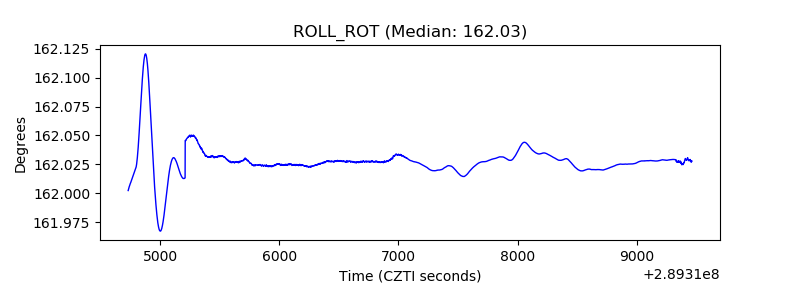 |
| _Roll_DEC | 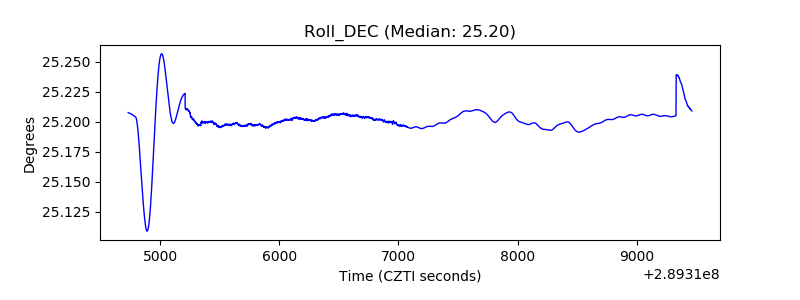 |
| _Roll_RA |  |
| Veto Counter | 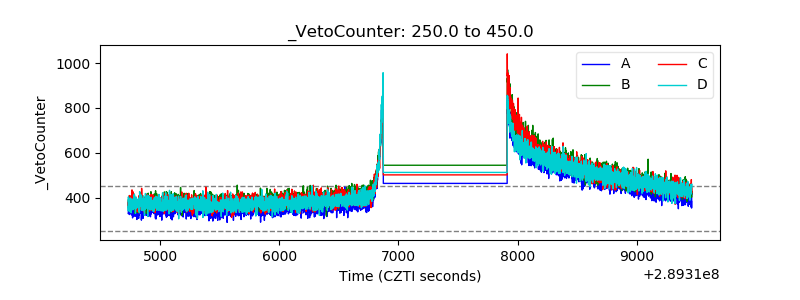 |