| Param | Original file | Final file |
|---|---|---|
| Filename | modeM0/AS1A05_104T02_9000002752_18539cztM0_level2.evt | modeM0/AS1A05_104T02_9000002752_18539cztM0_level2_quad_clean.evt |
| Size (bytes) | 516,191,040 | 103,728,960 |
| Size | 492.3 MB | 98.9 MB |
| Events in quadrant A | 3,104,963 | 707,027 |
| Events in quadrant B | 3,270,243 | 707,226 |
| Events in quadrant C | 3,060,480 | 670,341 |
| Events in quadrant D | 5,777,194 | 624,482 |
| Mode M9 | |||
|---|---|---|---|
| Quadrant | BADHDUFLAG | Total packets | Discarded packets |
| A | 0 | 11 | 0 |
| B | 0 | 11 | 0 |
| C | 0 | 11 | 0 |
| D | 0 | 11 | 0 |
| Mode M0 | |||
|---|---|---|---|
| Quadrant | BADHDUFLAG | Total packets | Discarded packets |
| A | 0 | 13380 | 1 |
| B | 0 | 13747 | 1 |
| C | 0 | 13054 | 1 |
| D | 0 | 21344 | 1 |
| Mode SS | |||
|---|---|---|---|
| Quadrant | BADHDUFLAG | Total packets | Discarded packets |
| A | 0 | 128 | 0 |
| B | 0 | 128 | 0 |
| C | 0 | 128 | 0 |
| D | 0 | 128 | 0 |
| Quadrant | Total seconds | Saturated seconds | Saturation percentage |
|---|---|---|---|
| A | 6183 | 79 | 1.277697% |
| B | 6184 | 110 | 1.778784% |
| C | 6184 | 84 | 1.358344% |
| D | 6184 | 677 | 10.947607% |
Noise dominated data is calculated using 1-second bins in cleaned event files. If a bin has >2000 counts, and if more than 50% of those come from <1% of pixels, then it is considered to be noise-dominated and hence unusable.
| Quadrant | # 1 sec bins | Bins with >0 counts | Bins with >2000 counts | High rate bins dominated by noise | Noise dominated (total time) | Noise dominated (detector-on time) | Marked lightcurve |
|---|---|---|---|---|---|---|---|
| A | 7333 | 6183 | 2 | 2 | 0.03% | 0.03% | 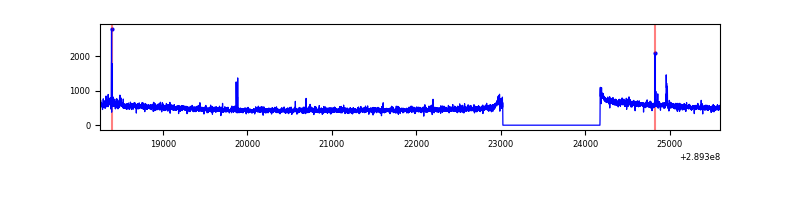 |
| B | 7334 | 6184 | 22 | 22 | 0.30% | 0.36% | 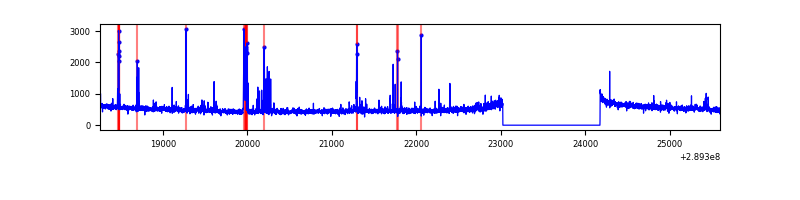 |
| C | 7334 | 6184 | 0 | 0 | 0.00% | 0.00% | 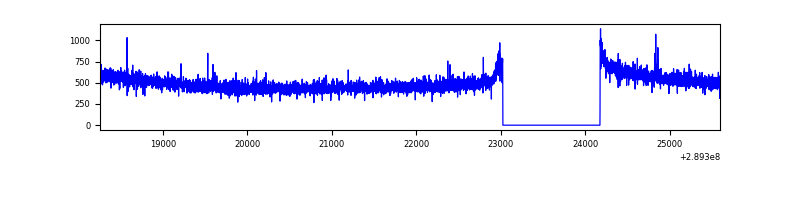 |
| D | 7334 | 6184 | 537 | 537 | 7.32% | 8.68% | 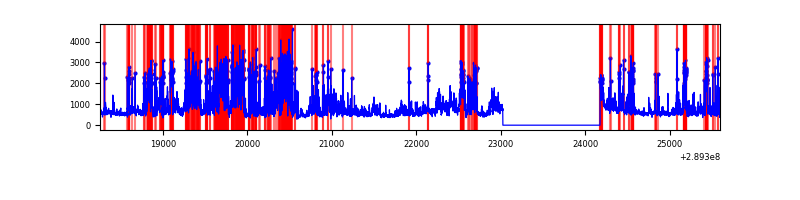 |
Top three noisy pixels from each quadrant. If the there are fewer than three noisy pixels in the level2.evt file, extra rows are filled as -1
| Pixel properties | Quadrant properties | ||||||
|---|---|---|---|---|---|---|---|
| Quadrant | DetID | PixID | Counts | Sigma | Mean | Median | Sigma |
| A | 0 | 13 | 44588 | 273.61 | 794 | 778 | 160.1 |
| A | 13 | 254 | 9790 | 56.28 | 794 | 778 | 160.1 |
| A | 0 | 226 | 6998 | 38.84 | 794 | 778 | 160.1 |
| B | 3 | 64 | 150208 | 1011.3 | 781 | 763 | 147.8 |
| B | 7 | 220 | 17297 | 111.89 | 781 | 763 | 147.8 |
| B | 12 | 111 | 16990 | 109.81 | 781 | 763 | 147.8 |
| C | 14 | 238 | 119011 | 677.12 | 752 | 759 | 174.6 |
| C | 0 | 207 | 8588 | 44.83 | 752 | 759 | 174.6 |
| C | 13 | 61 | 5312 | 26.07 | 752 | 759 | 174.6 |
| D | 7 | 238 | 1636703 | 9129.95 | 742 | 721 | 179.2 |
| D | 1 | 52 | 1230950 | 6865.55 | 742 | 721 | 179.2 |
| D | 7 | 96 | 41176 | 225.77 | 742 | 721 | 179.2 |
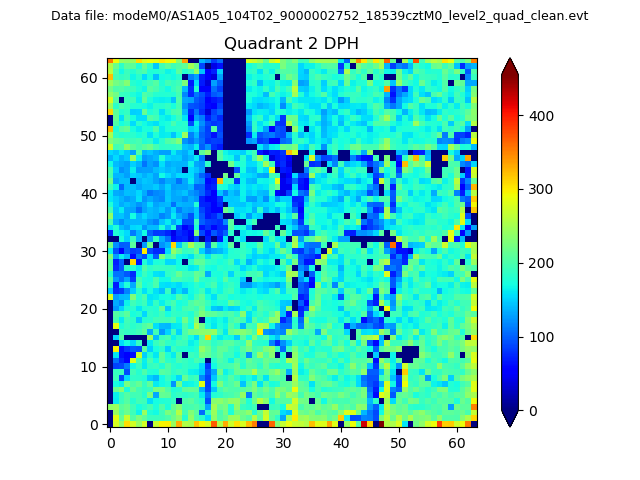
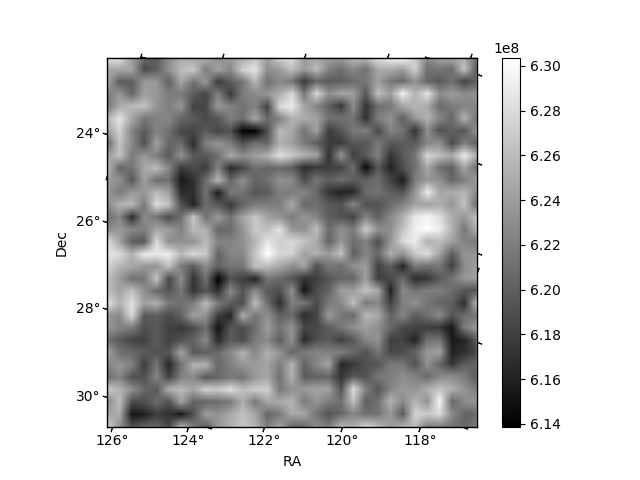
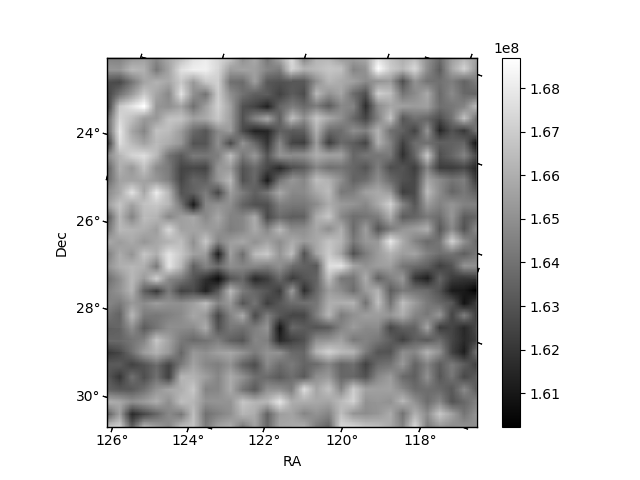
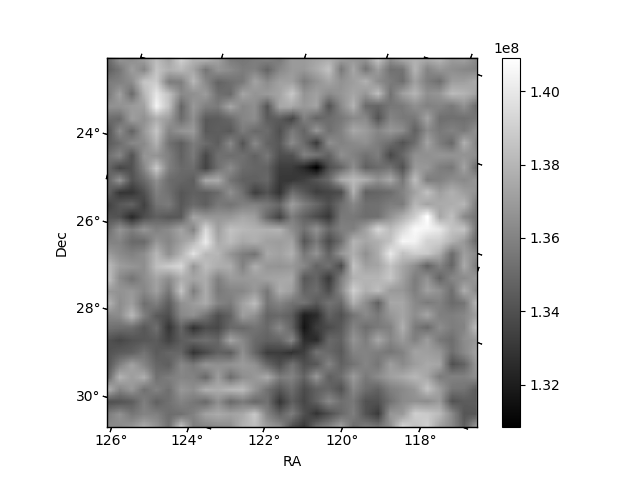
Histogram calculated using DETX and DETY for each event in the final _common_clean file
| Quadrant A | 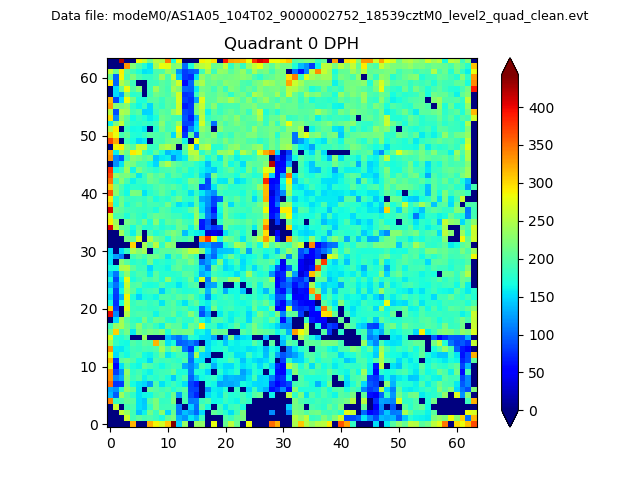 |
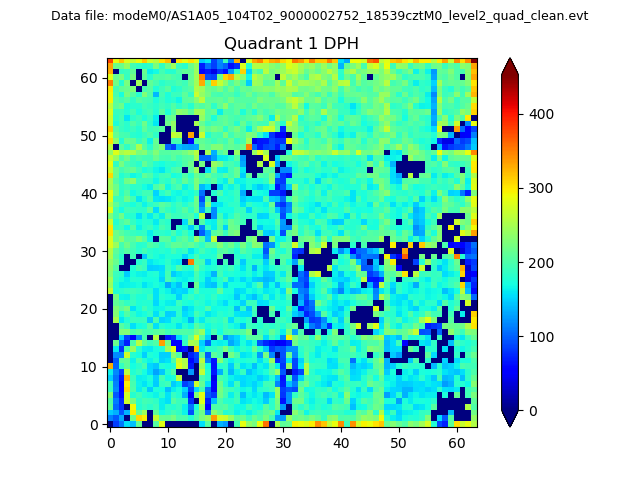 |
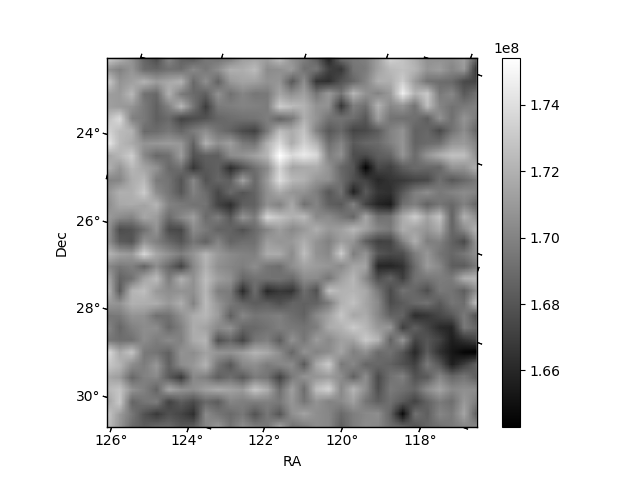
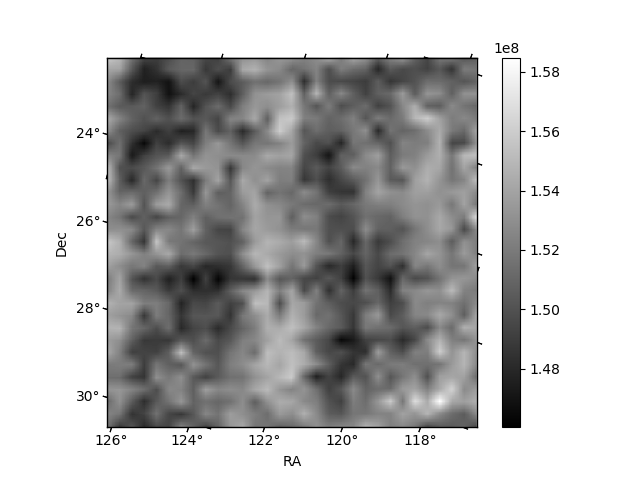
Quadrant B |
|---|---|---|---|
| Quadrant D | 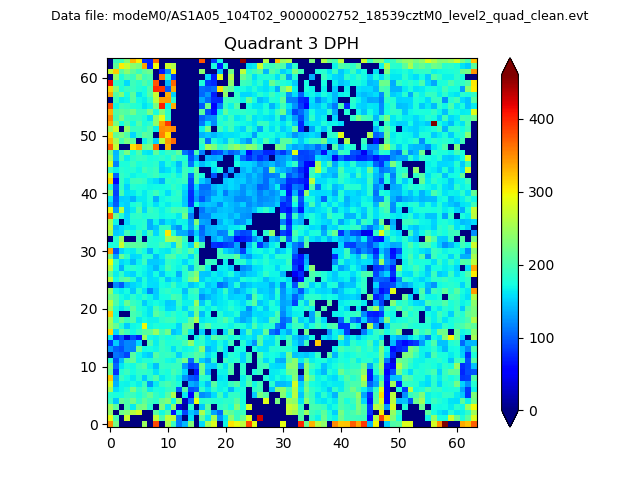 |
 |
Quadrant C |
| Plot type | Count rate plots | Images |
|---|---|---|
| Comparison with Poisson distribution Blue bars denote a histogram of data divided into 1 sec bins. Red curve is a Poisson curve with rate = median count rate of data. |
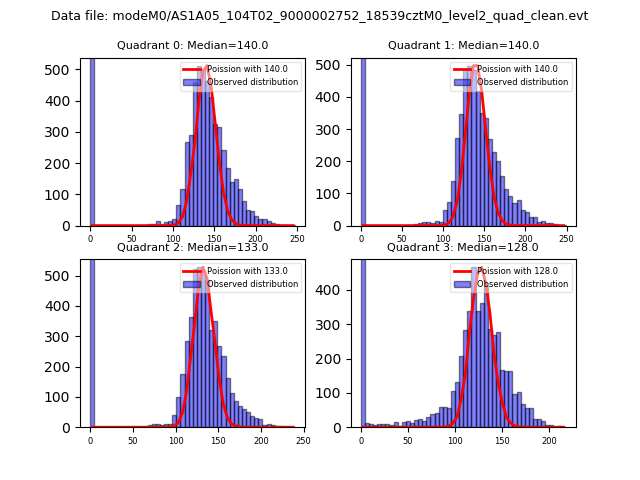 |
 |
| Quadrant-wise count rates Data is divided into 100 sec bins |
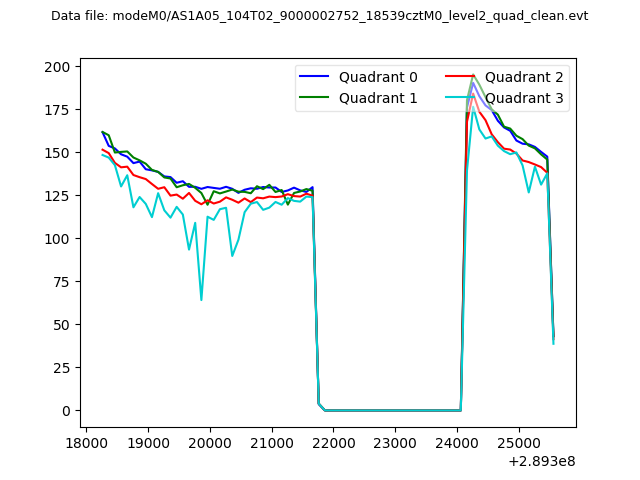 |
|
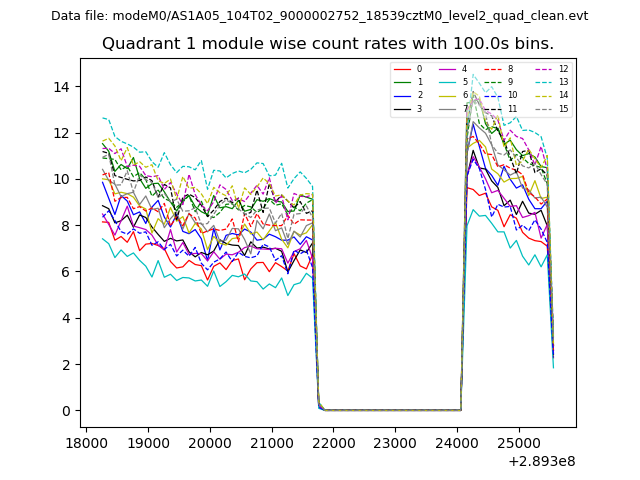
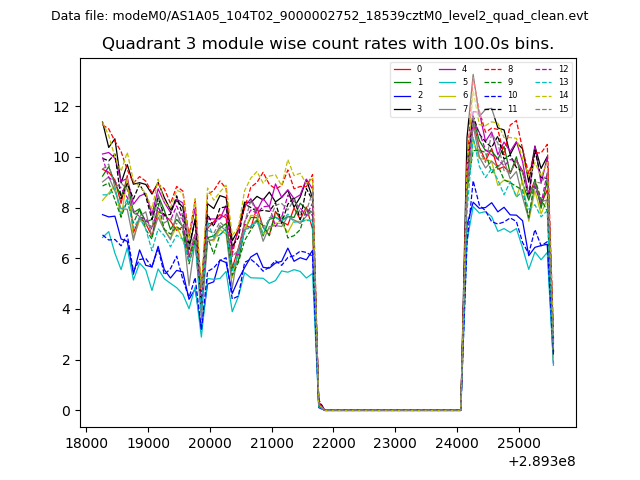
| Module-wise count rates for Quadrant A Data is divided into 100 sec bins |
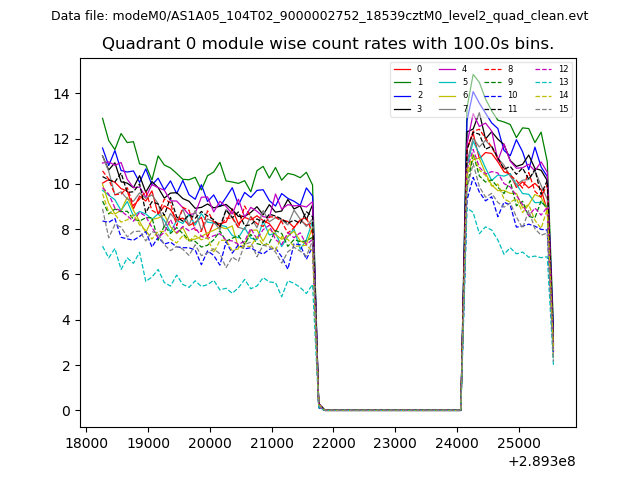 |
 |
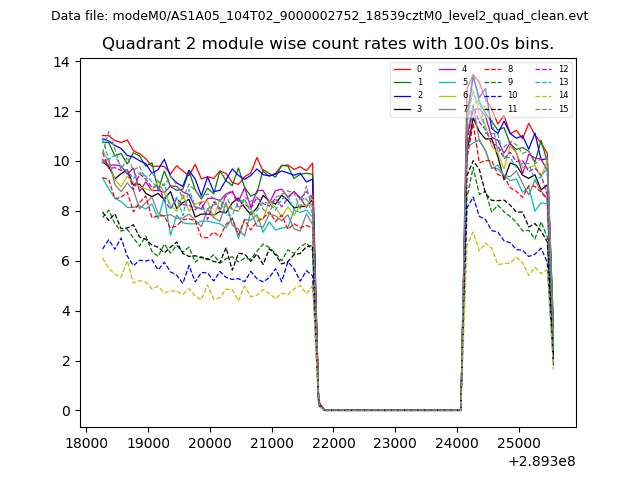
| Module-wise count rates for Quadrant B Data is divided into 100 sec bins |
 |
 |
| Module-wise count rates for Quadrant C Data is divided into 100 sec bins |
 |
 |
| Module-wise count rates for Quadrant D Data is divided into 100 sec bins |
 |
 |
| Parameter | Plot |
|---|---|
| CZT HV Monitor | 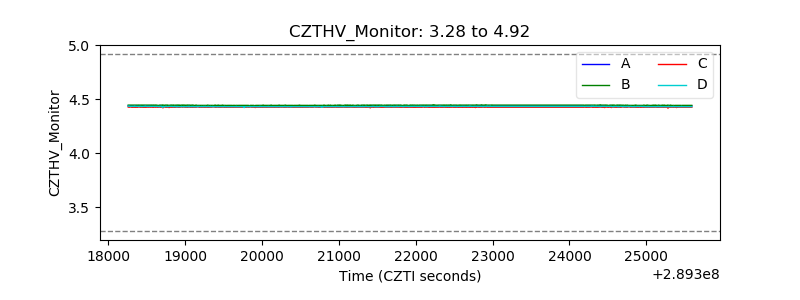 |
| D_VDD | 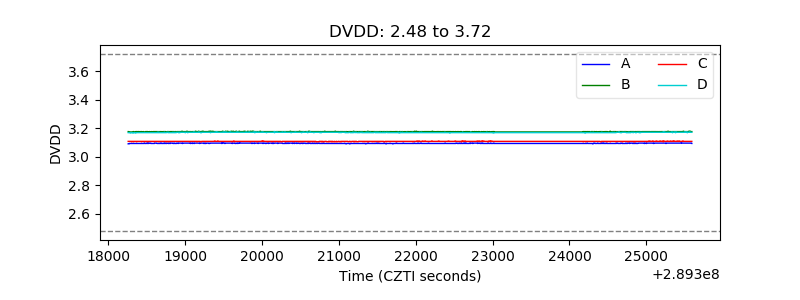 |
| Temperature 1 | 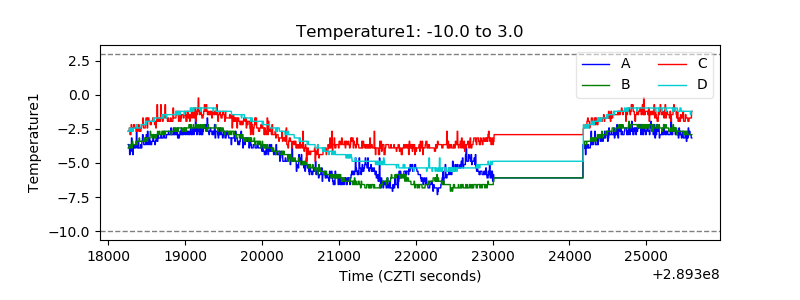 |
| Veto HV Monitor | 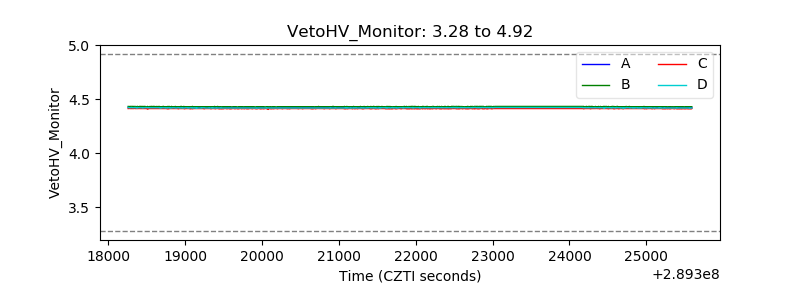 |
| Veto LLD | 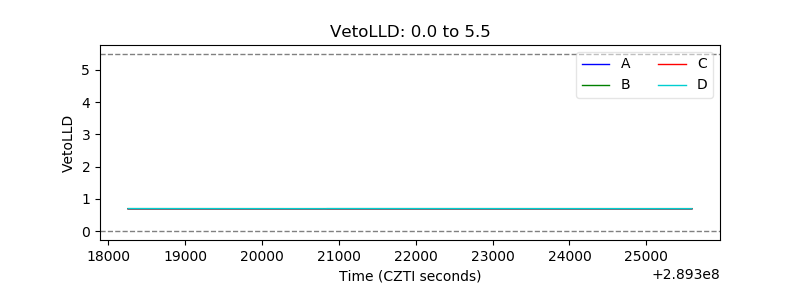 |
| Alpha Counter | 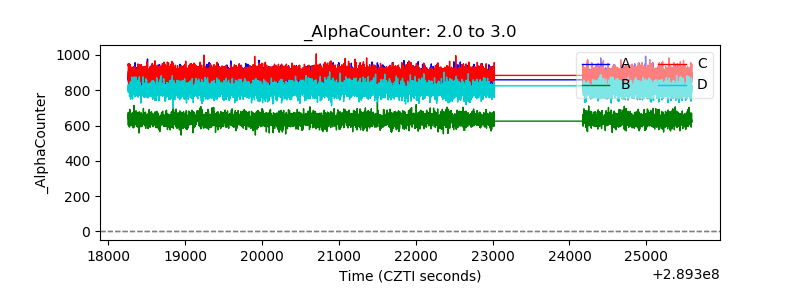 |
| _CPM_Rate | 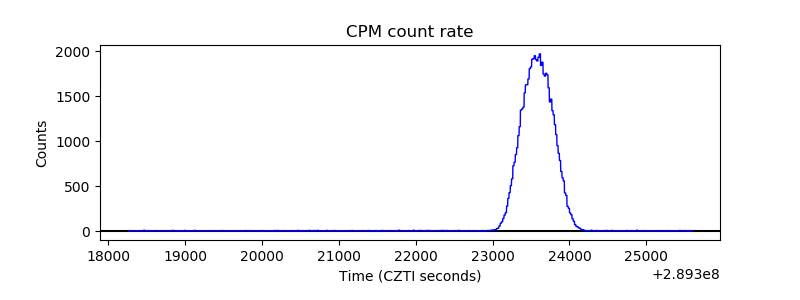 |
| CZT Counter | 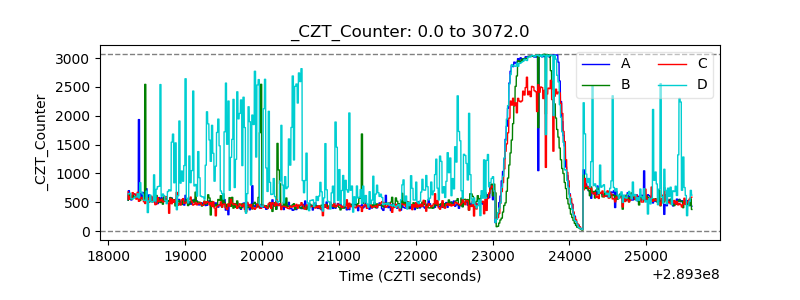 |
| +2.5 Volts monitor |  |
| +5 Volts monitor |  |
| _ROLL_ROT | 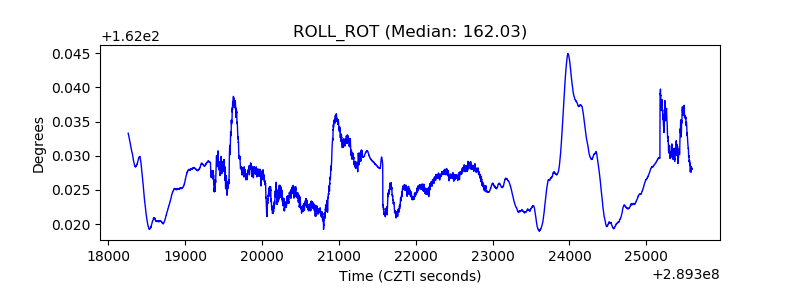 |
| _Roll_DEC | 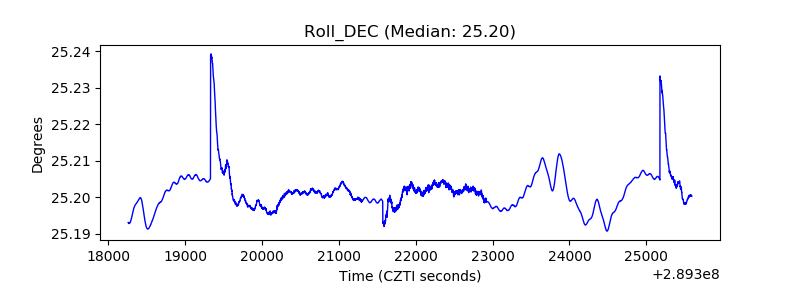 |
| _Roll_RA | 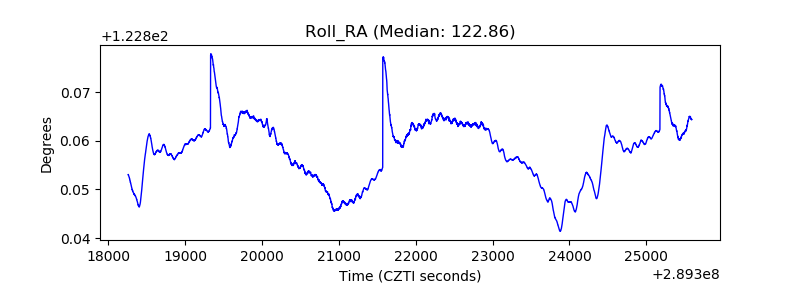 |
| Veto Counter | 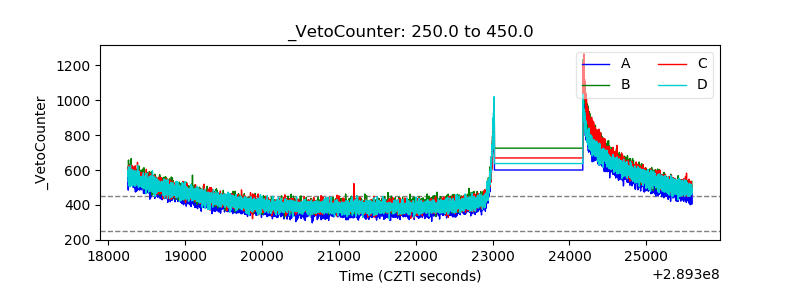 |