| Param | Original file | Final file |
|---|---|---|
| Filename | modeM0/AS1A05_104T02_9000002752_18540cztM0_level2.evt | modeM0/AS1A05_104T02_9000002752_18540cztM0_level2_quad_clean.evt |
| Size (bytes) | 603,673,920 | 110,309,760 |
| Size | 575.7 MB | 105.2 MB |
| Events in quadrant A | 5,182,896 | 728,886 |
| Events in quadrant B | 3,553,090 | 765,180 |
| Events in quadrant C | 3,356,652 | 719,687 |
| Events in quadrant D | 5,752,589 | 676,582 |
| Mode M9 | |||
|---|---|---|---|
| Quadrant | BADHDUFLAG | Total packets | Discarded packets |
| A | 0 | 16 | 0 |
| B | 0 | 17 | 0 |
| C | 0 | 17 | 0 |
| D | 0 | 17 | 0 |
| Mode M0 | |||
|---|---|---|---|
| Quadrant | BADHDUFLAG | Total packets | Discarded packets |
| A | 0 | 19781 | 2 |
| B | 0 | 14744 | 2 |
| C | 0 | 14105 | 3 |
| D | 0 | 21484 | 2 |
| Mode SS | |||
|---|---|---|---|
| Quadrant | BADHDUFLAG | Total packets | Discarded packets |
| A | 0 | 130 | 0 |
| B | 0 | 130 | 0 |
| C | 0 | 130 | 0 |
| D | 0 | 130 | 0 |
| Quadrant | Total seconds | Saturated seconds | Saturation percentage |
|---|---|---|---|
| A | 6460 | 685 | 10.603715% |
| B | 6460 | 105 | 1.625387% |
| C | 6459 | 111 | 1.718532% |
| D | 6459 | 610 | 9.444186% |
Noise dominated data is calculated using 1-second bins in cleaned event files. If a bin has >2000 counts, and if more than 50% of those come from <1% of pixels, then it is considered to be noise-dominated and hence unusable.
| Quadrant | # 1 sec bins | Bins with >0 counts | Bins with >2000 counts | High rate bins dominated by noise | Noise dominated (total time) | Noise dominated (detector-on time) | Marked lightcurve |
|---|---|---|---|---|---|---|---|
| A | 7710 | 6460 | 506 | 506 | 6.56% | 7.83% | 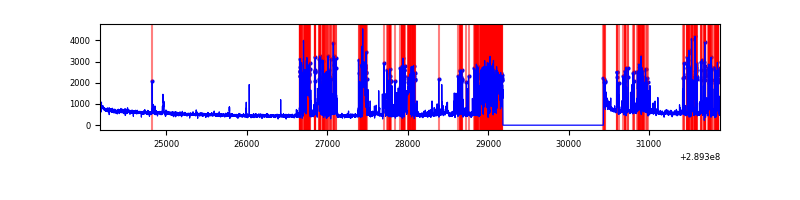 |
| B | 7710 | 6460 | 16 | 16 | 0.21% | 0.25% | 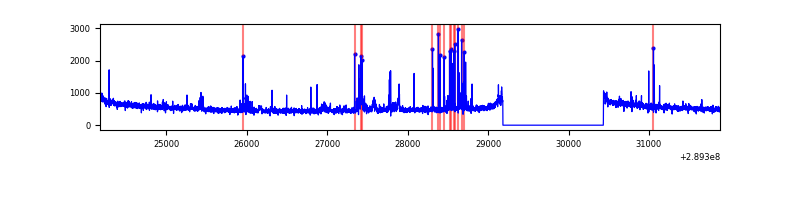 |
| C | 7709 | 6459 | 4 | 4 | 0.05% | 0.06% | 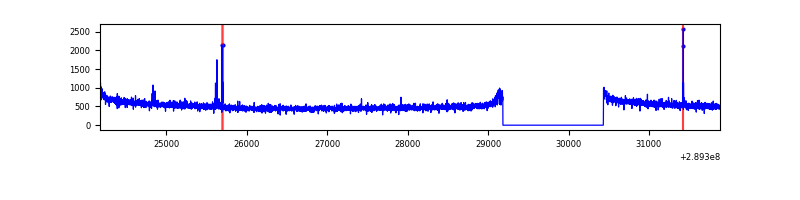 |
| D | 7708 | 6458 | 518 | 518 | 6.72% | 8.02% | 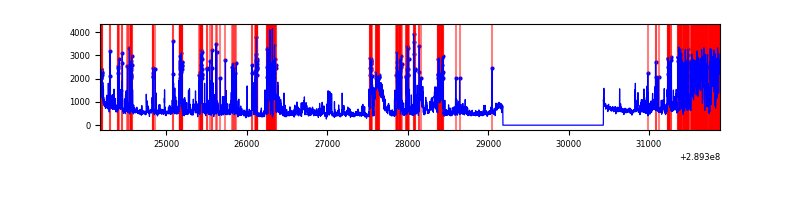 |
Top three noisy pixels from each quadrant. If the there are fewer than three noisy pixels in the level2.evt file, extra rows are filled as -1
| Pixel properties | Quadrant properties | ||||||
|---|---|---|---|---|---|---|---|
| Quadrant | DetID | PixID | Counts | Sigma | Mean | Median | Sigma |
| A | 0 | 13 | 1989013 | 12043.44 | 824 | 809 | 165.1 |
| A | 14 | 111 | 21033 | 122.51 | 824 | 809 | 165.1 |
| A | 13 | 254 | 10300 | 57.49 | 824 | 809 | 165.1 |
| B | 3 | 64 | 82193 | 507.12 | 854 | 836 | 160.4 |
| B | 15 | 222 | 59667 | 366.71 | 854 | 836 | 160.4 |
| B | 4 | 80 | 53727 | 329.68 | 854 | 836 | 160.4 |
| C | 14 | 238 | 128058 | 671.13 | 821 | 828 | 189.6 |
| C | 0 | 207 | 28465 | 145.78 | 821 | 828 | 189.6 |
| C | 13 | 61 | 5811 | 26.29 | 821 | 828 | 189.6 |
| D | 7 | 238 | 2092458 | 10570.42 | 819 | 798 | 197.9 |
| D | 1 | 52 | 496225 | 2503.69 | 819 | 798 | 197.9 |
| D | 15 | 0 | 29924 | 147.19 | 819 | 798 | 197.9 |
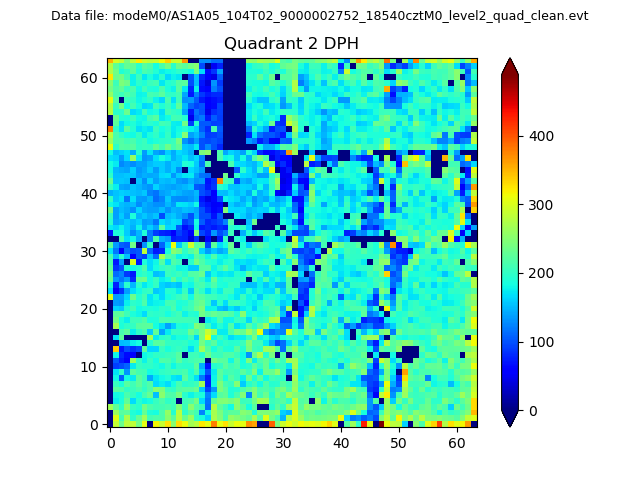
Histogram calculated using DETX and DETY for each event in the final _common_clean file
| Quadrant A | 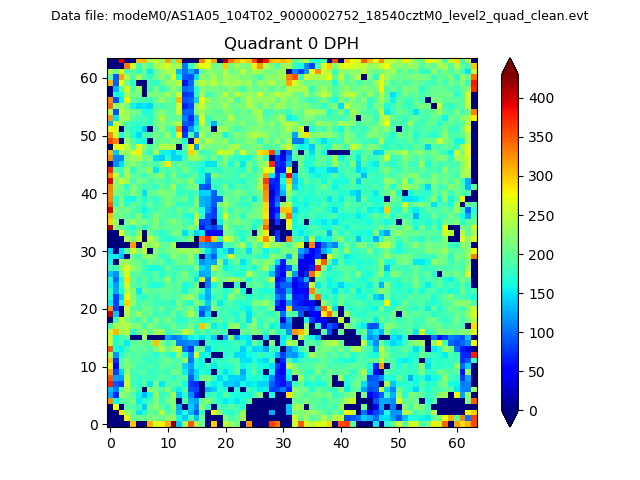 |
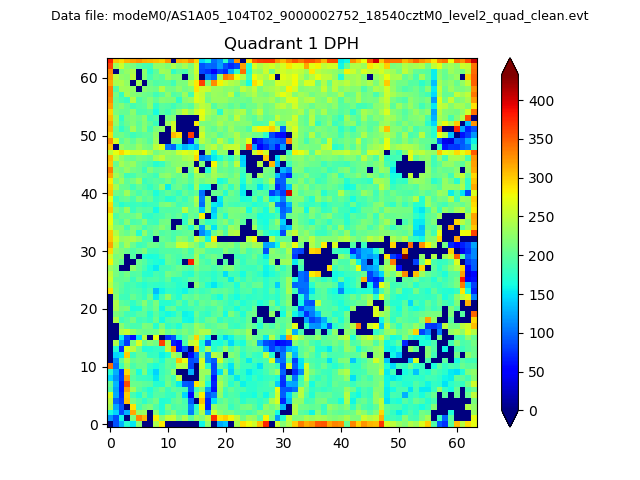 |
Quadrant B |
|---|---|---|---|
| Quadrant D | 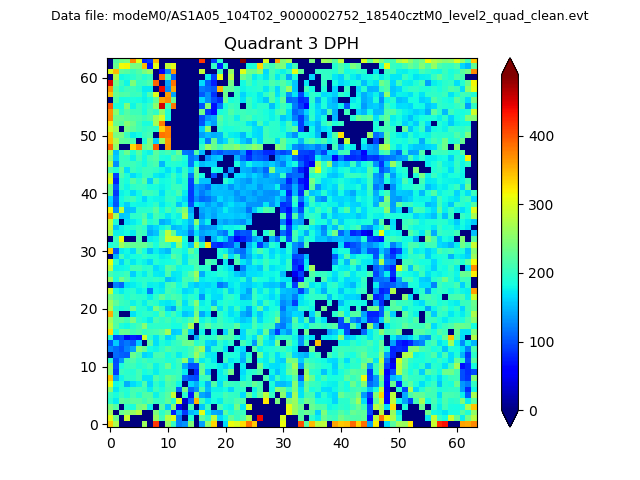 |
 |
Quadrant C |
| Plot type | Count rate plots | Images |
|---|---|---|
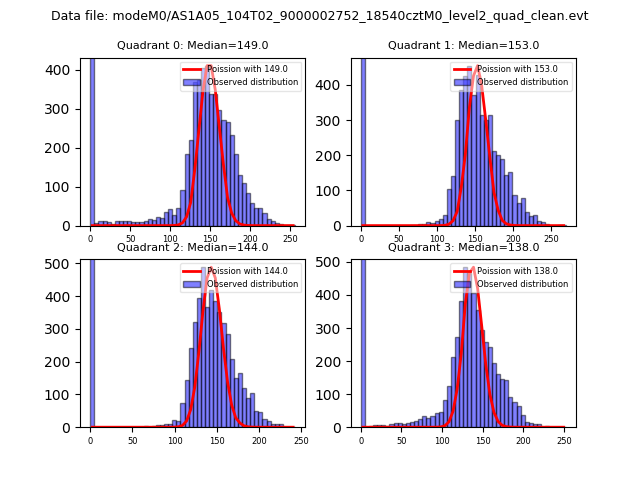
| Comparison with Poisson distribution Blue bars denote a histogram of data divided into 1 sec bins. Red curve is a Poisson curve with rate = median count rate of data. |
 |
 |
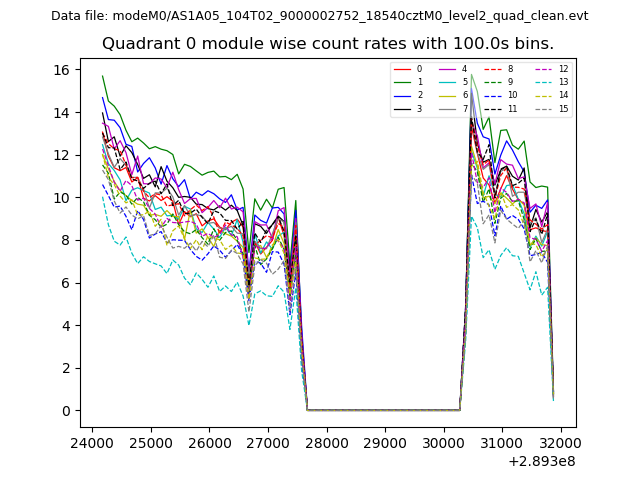
| Quadrant-wise count rates Data is divided into 100 sec bins |
 |
|
| Module-wise count rates for Quadrant A Data is divided into 100 sec bins |
 |
 |
| Module-wise count rates for Quadrant B Data is divided into 100 sec bins |
 |
 |
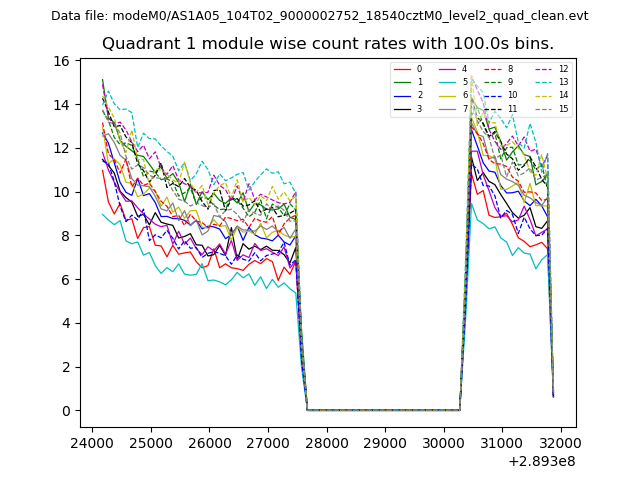
| Module-wise count rates for Quadrant C Data is divided into 100 sec bins |
 |
 |
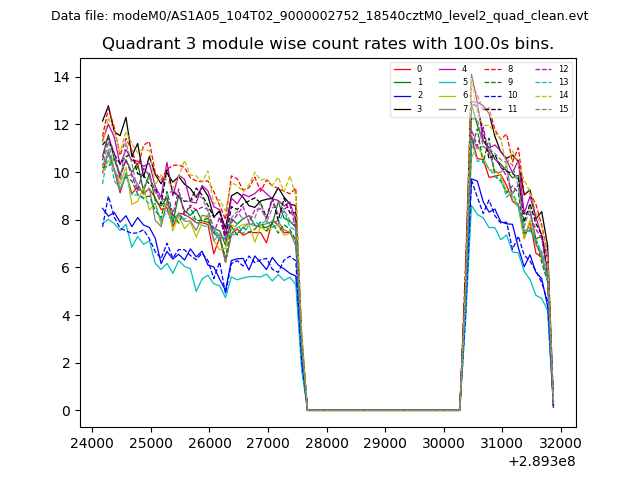
| Module-wise count rates for Quadrant D Data is divided into 100 sec bins |
 |
 |
| Parameter | Plot |
|---|---|
| CZT HV Monitor |  |
| D_VDD | 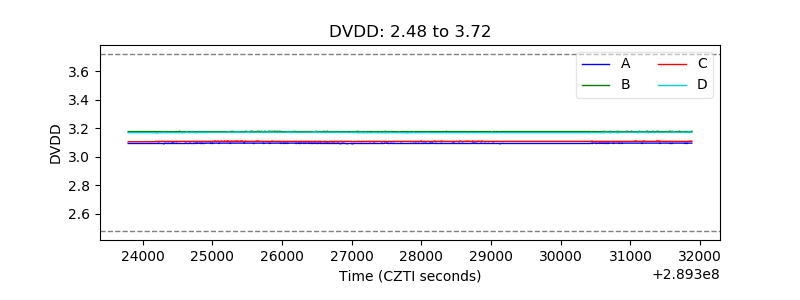 |
| Temperature 1 | 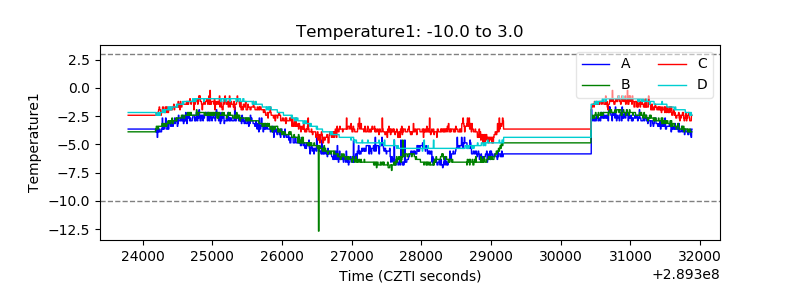 |
| Veto HV Monitor | 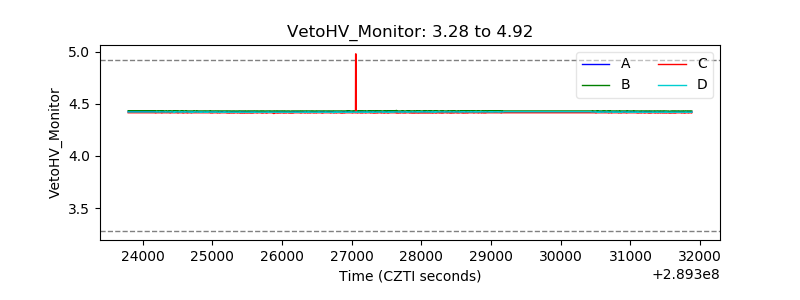 |
| Veto LLD | 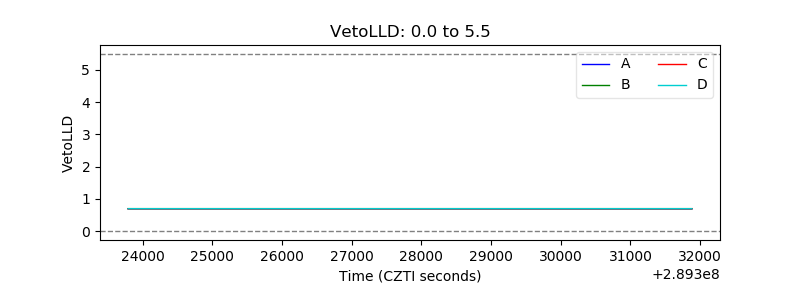 |
| Alpha Counter | 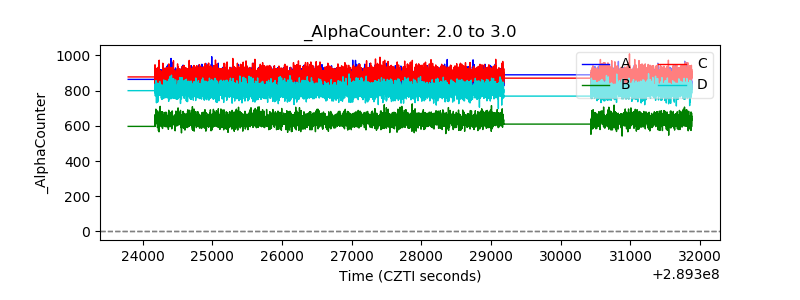 |
| _CPM_Rate | 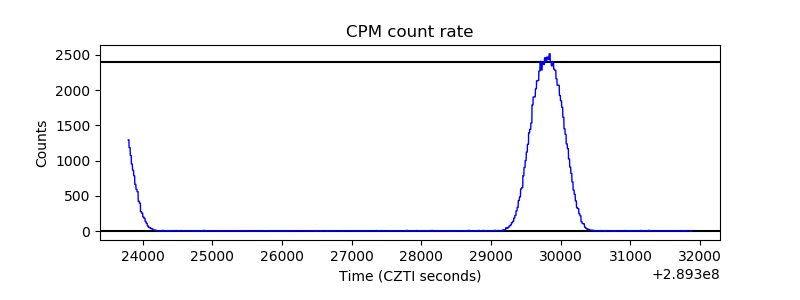 |
| CZT Counter | 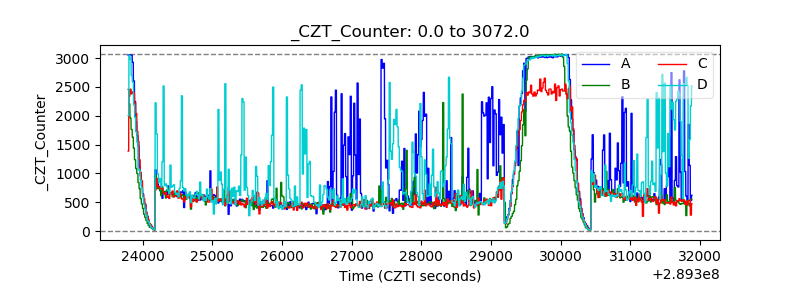 |
| +2.5 Volts monitor |  |
| +5 Volts monitor |  |
| _ROLL_ROT | 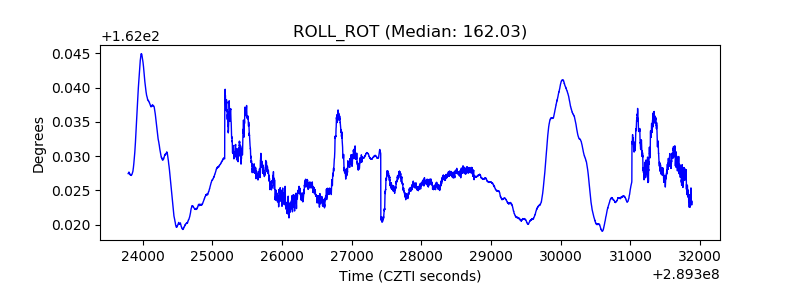 |
| _Roll_DEC | 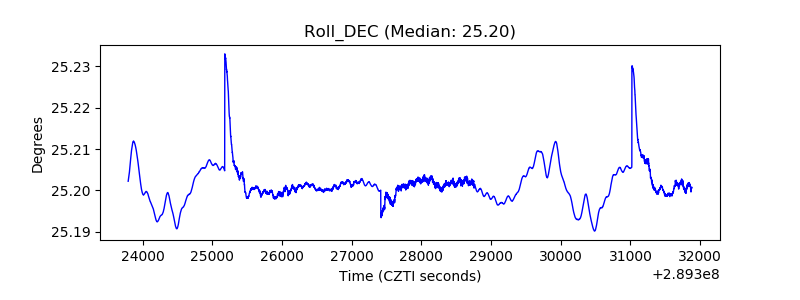 |
| _Roll_RA | 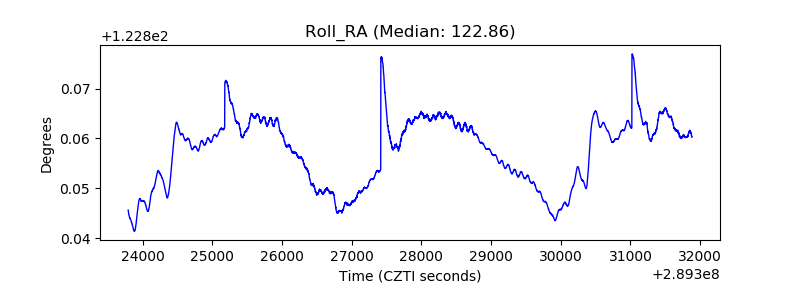 |
| Veto Counter | 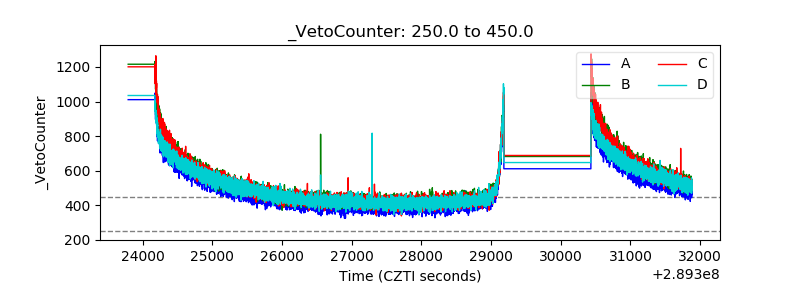 |