| Param | Original file | Final file |
|---|---|---|
| Filename | modeM0/AS1A05_104T02_9000002752_18541cztM0_level2.evt | modeM0/AS1A05_104T02_9000002752_18541cztM0_level2_quad_clean.evt |
| Size (bytes) | 231,868,800 | 46,284,480 |
| Size | 221.1 MB | 44.1 MB |
| Events in quadrant A | 1,931,543 | 314,536 |
| Events in quadrant B | 1,132,640 | 341,289 |
| Events in quadrant C | 1,121,164 | 318,326 |
| Events in quadrant D | 2,694,983 | 277,358 |
| Mode M9 | |||
|---|---|---|---|
| Quadrant | BADHDUFLAG | Total packets | Discarded packets |
| A | 1 | 139843579120520 | 46 |
| B | 1 | -1 | -1 |
| C | 1 | -1 | -1 |
| D | 1 | -1 | -1 |
| Mode M0 | |||
|---|---|---|---|
| Quadrant | BADHDUFLAG | Total packets | Discarded packets |
| A | 0 | 7160 | 1 |
| B | 0 | 4685 | 1 |
| C | 0 | 4635 | 1 |
| D | 0 | 9487 | 1 |
| Mode SS | |||
|---|---|---|---|
| Quadrant | BADHDUFLAG | Total packets | Discarded packets |
| A | 0 | 42 | 0 |
| B | 0 | 42 | 0 |
| C | 0 | 42 | 0 |
| D | 0 | 42 | 0 |
| Quadrant | Total seconds | Saturated seconds | Saturation percentage |
|---|---|---|---|
| A | 2058 | 269 | 13.070943% |
| B | 2058 | 10 | 0.485909% |
| C | 2058 | 23 | 1.117590% |
| D | 2058 | 511 | 24.829932% |
Noise dominated data is calculated using 1-second bins in cleaned event files. If a bin has >2000 counts, and if more than 50% of those come from <1% of pixels, then it is considered to be noise-dominated and hence unusable.
| Quadrant | # 1 sec bins | Bins with >0 counts | Bins with >2000 counts | High rate bins dominated by noise | Noise dominated (total time) | Noise dominated (detector-on time) | Marked lightcurve |
|---|---|---|---|---|---|---|---|
| A | 2058 | 2058 | 188 | 188 | 9.14% | 9.14% | 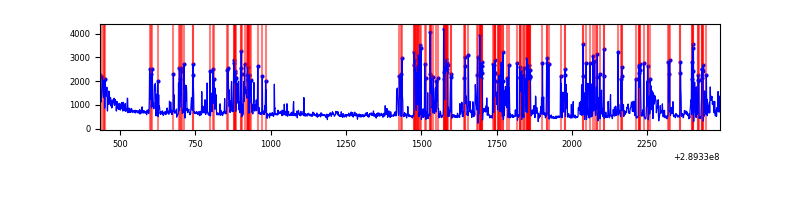 |
| B | 2058 | 2058 | 1 | 1 | 0.05% | 0.05% | 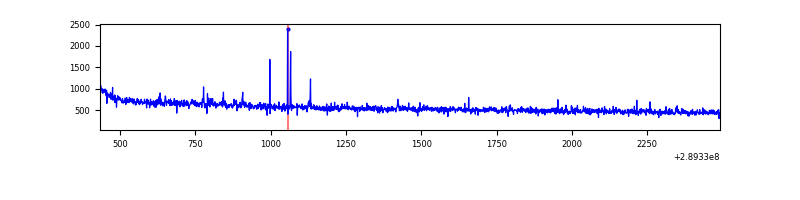 |
| C | 2058 | 2058 | 2 | 2 | 0.10% | 0.10% | 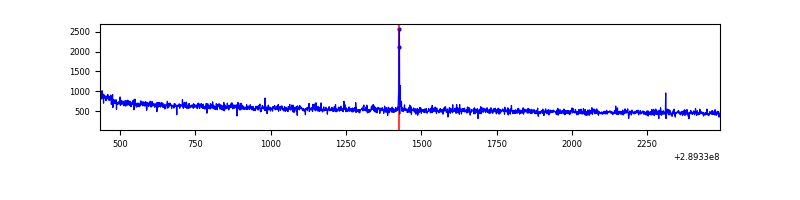 |
| D | 2058 | 2058 | 480 | 480 | 23.32% | 23.32% | 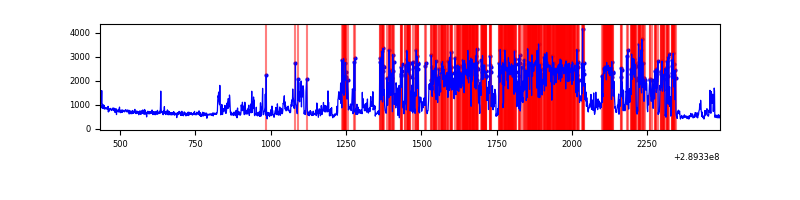 |
Top three noisy pixels from each quadrant. If the there are fewer than three noisy pixels in the level2.evt file, extra rows are filled as -1
| Pixel properties | Quadrant properties | ||||||
|---|---|---|---|---|---|---|---|
| Quadrant | DetID | PixID | Counts | Sigma | Mean | Median | Sigma |
| A | 0 | 13 | 844960 | 14975.31 | 276 | 271 | 56.4 |
| A | 14 | 111 | 20055 | 350.75 | 276 | 271 | 56.4 |
| A | 13 | 254 | 4077 | 67.48 | 276 | 271 | 56.4 |
| B | 3 | 64 | 9489 | 169.34 | 286 | 281 | 54.4 |
| B | 12 | 111 | 5588 | 97.6 | 286 | 281 | 54.4 |
| B | 11 | 111 | 4983 | 86.47 | 286 | 281 | 54.4 |
| C | 14 | 238 | 43876 | 675.73 | 274 | 277 | 64.5 |
| C | 0 | 207 | 7795 | 116.52 | 274 | 277 | 64.5 |
| C | 13 | 61 | 1896 | 25.09 | 274 | 277 | 64.5 |
| D | 7 | 238 | 1505563 | 23689.91 | 258 | 249 | 63.5 |
| D | 1 | 52 | 186860 | 2936.79 | 258 | 249 | 63.5 |
| D | 15 | 0 | 10076 | 154.64 | 258 | 249 | 63.5 |
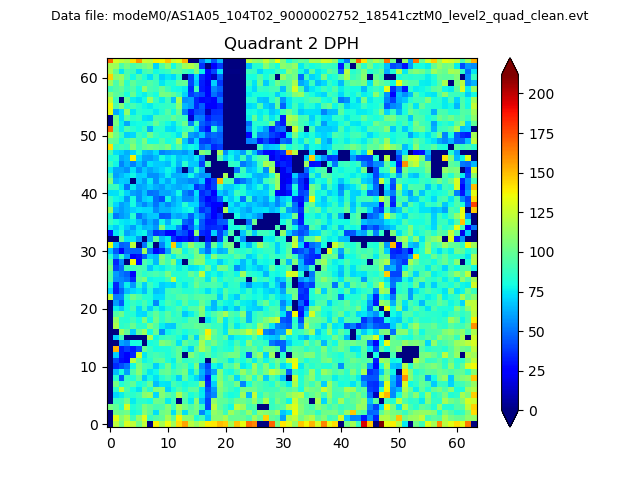
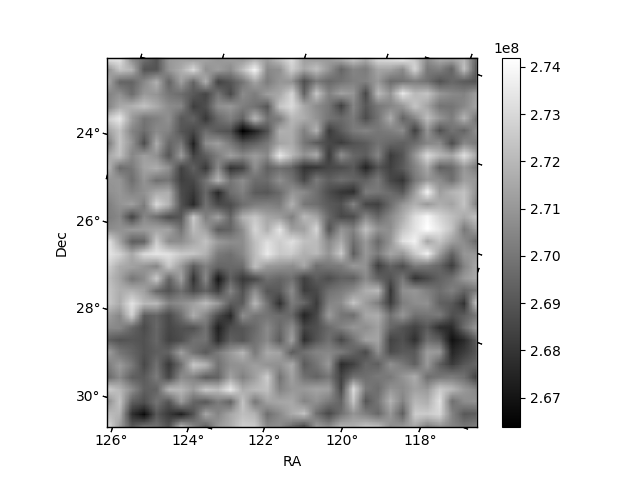
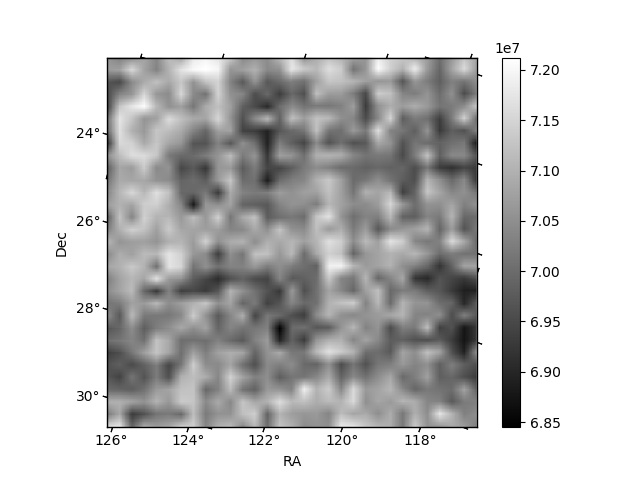
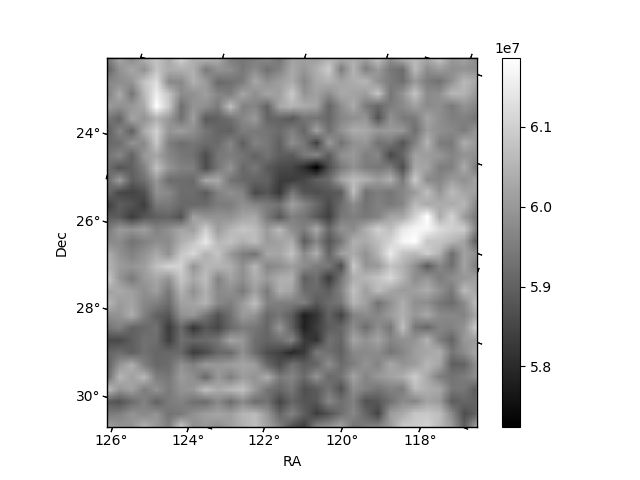
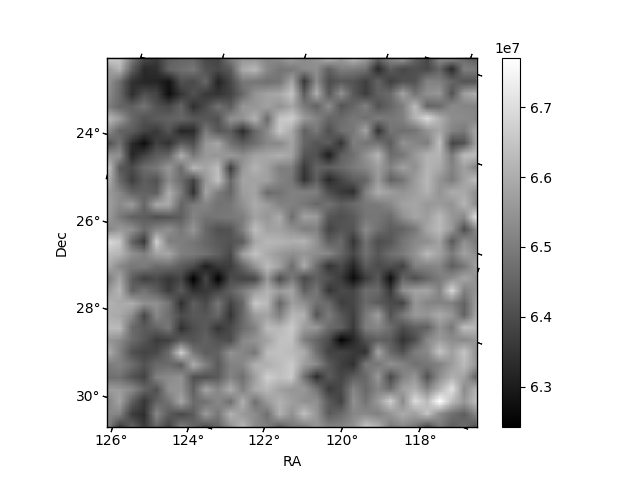
Histogram calculated using DETX and DETY for each event in the final _common_clean file
| Quadrant A | 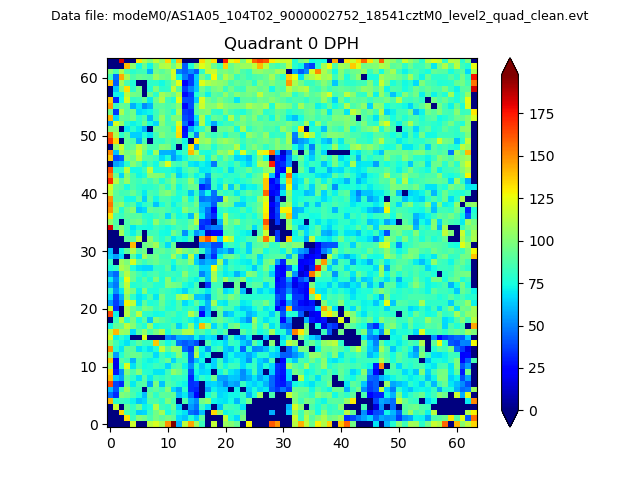 |
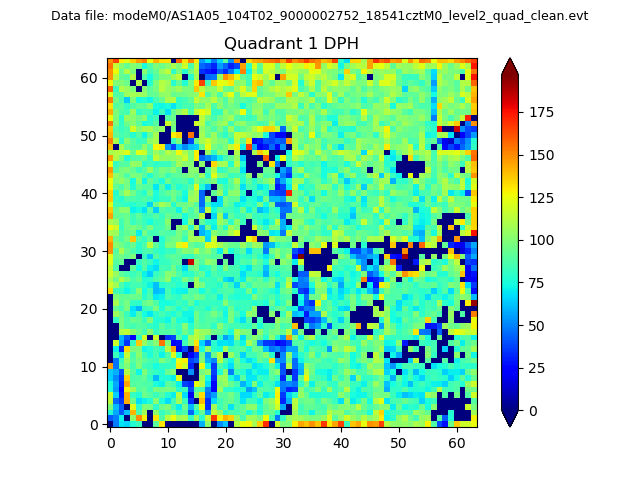 |
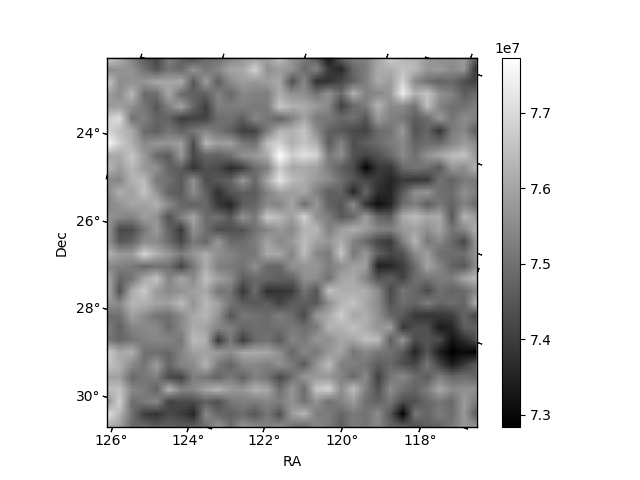
Quadrant B |
|---|---|---|---|
| Quadrant D | 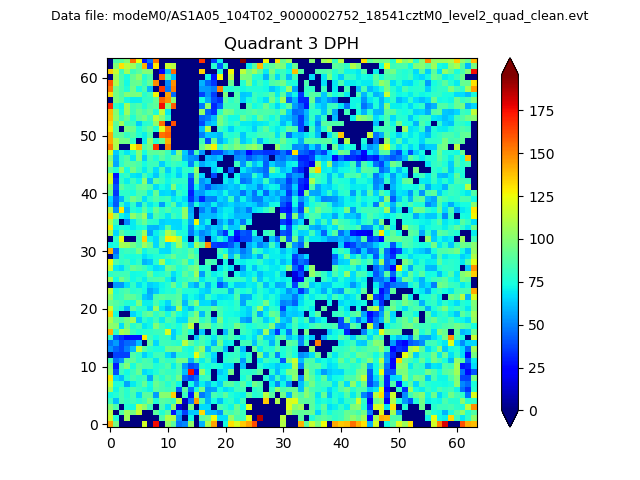 |
 |
Quadrant C |
| Plot type | Count rate plots | Images |
|---|---|---|
| Comparison with Poisson distribution Blue bars denote a histogram of data divided into 1 sec bins. Red curve is a Poisson curve with rate = median count rate of data. |
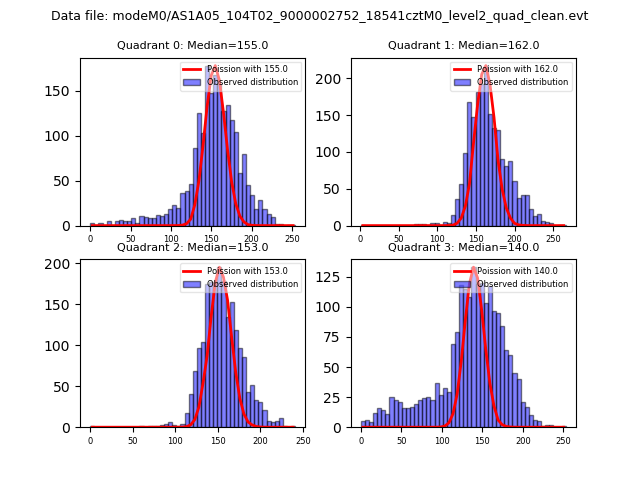 |
 |
| Quadrant-wise count rates Data is divided into 100 sec bins |
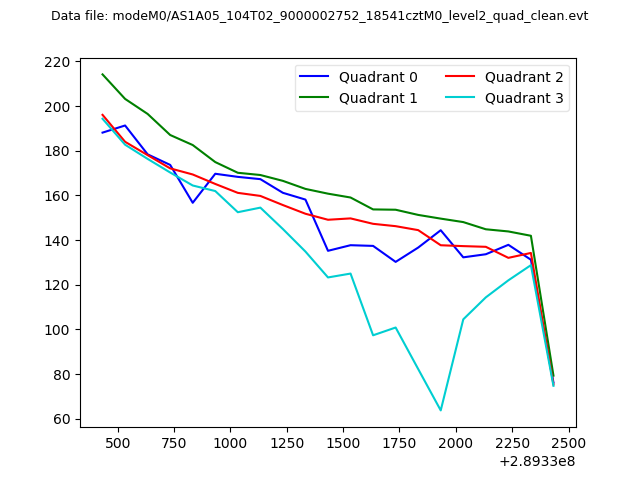 |
|
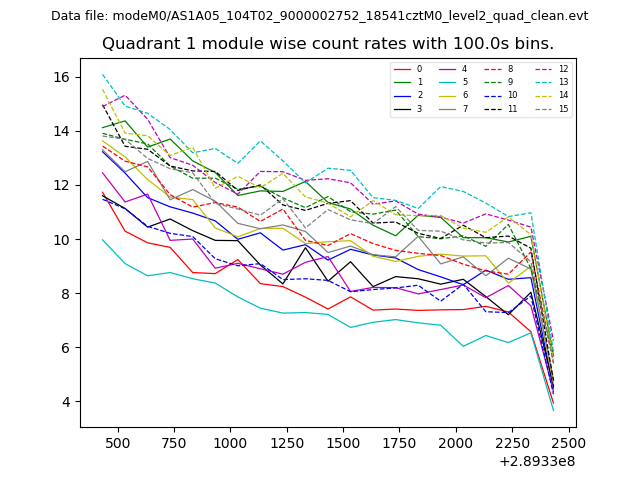
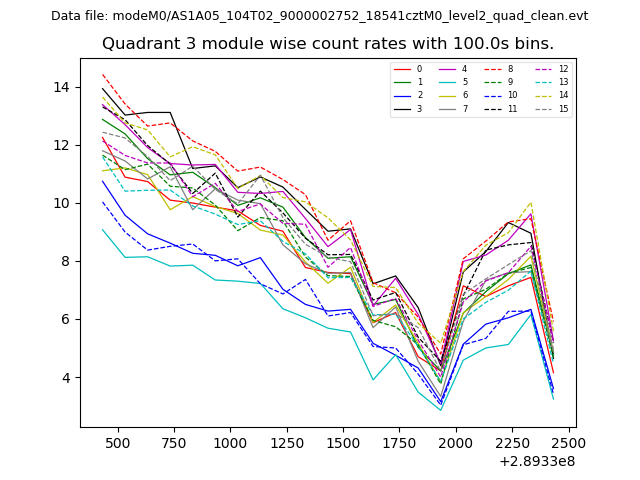
| Module-wise count rates for Quadrant A Data is divided into 100 sec bins |
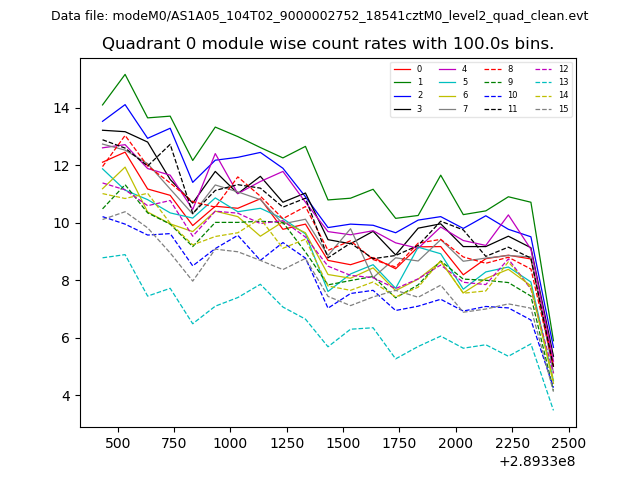 |
 |
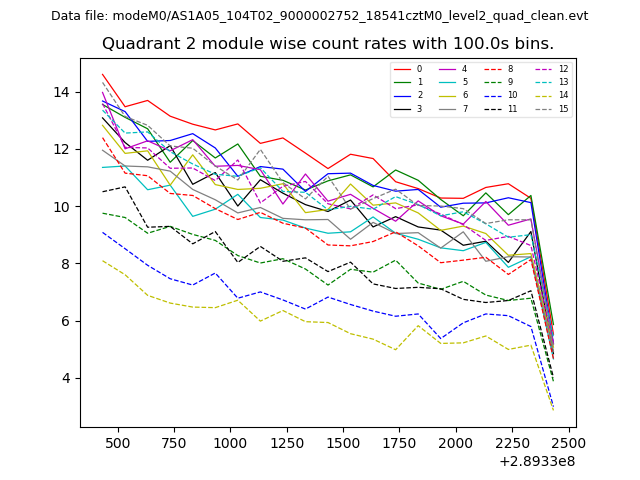
| Module-wise count rates for Quadrant B Data is divided into 100 sec bins |
 |
 |
| Module-wise count rates for Quadrant C Data is divided into 100 sec bins |
 |
 |
| Module-wise count rates for Quadrant D Data is divided into 100 sec bins |
 |
 |
| Parameter | Plot |
|---|---|
| CZT HV Monitor | 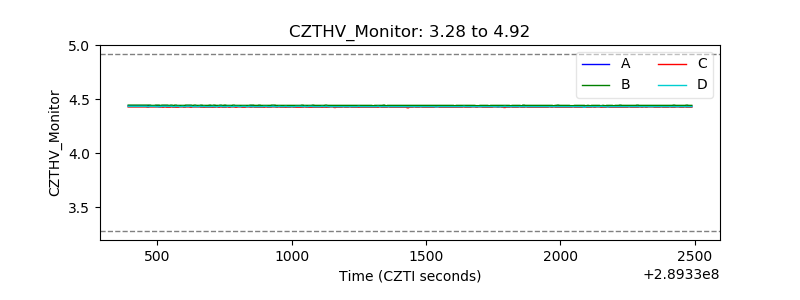 |
| D_VDD | 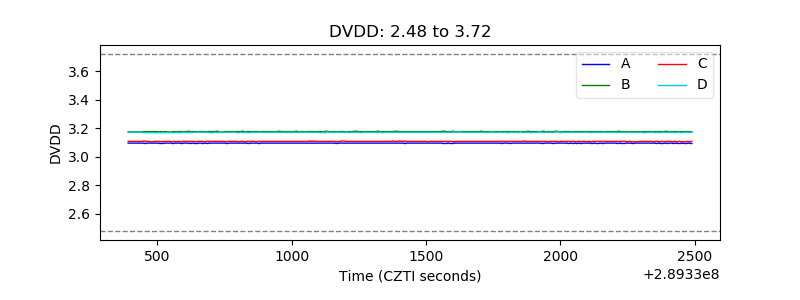 |
| Temperature 1 | 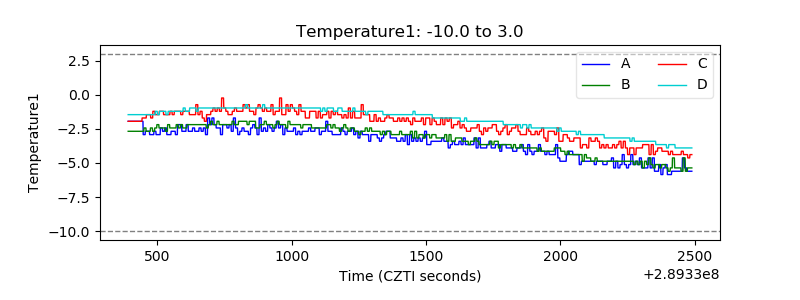 |
| Veto HV Monitor | 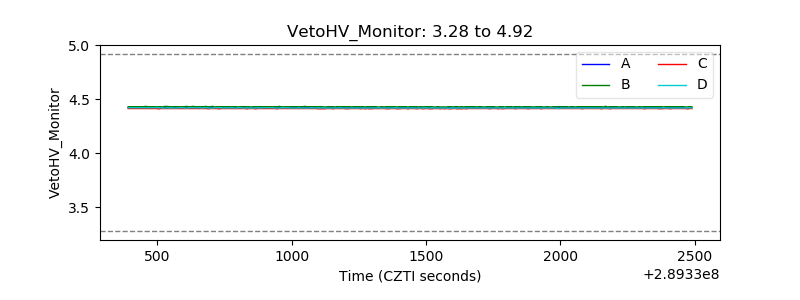 |
| Veto LLD | 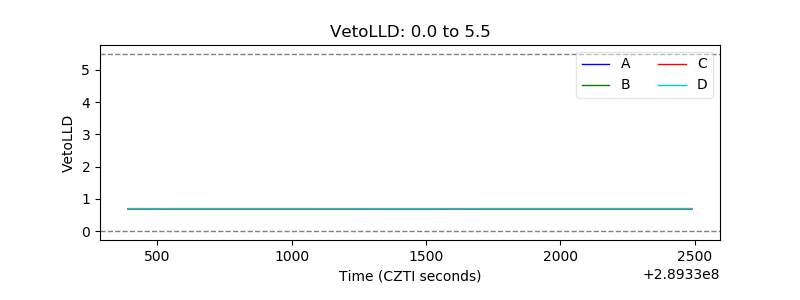 |
| Alpha Counter |  |
| _CPM_Rate | 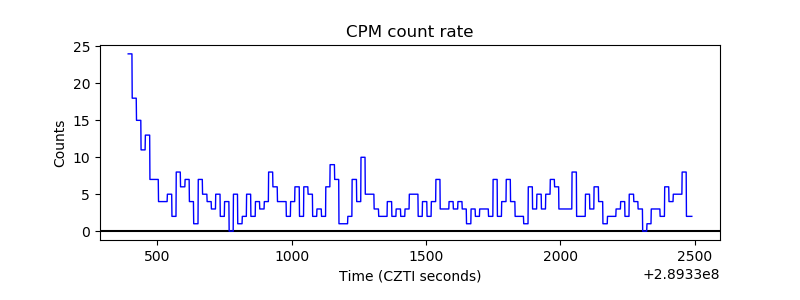 |
| CZT Counter | 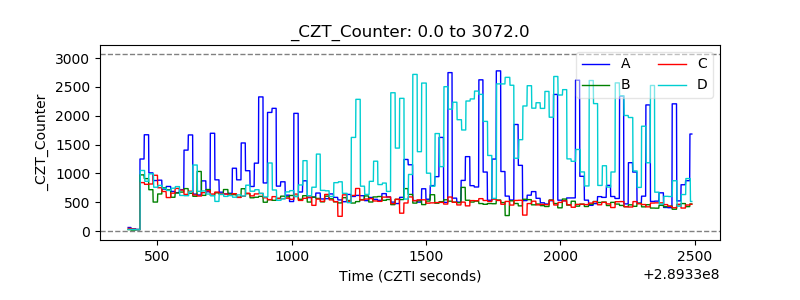 |
| +2.5 Volts monitor | 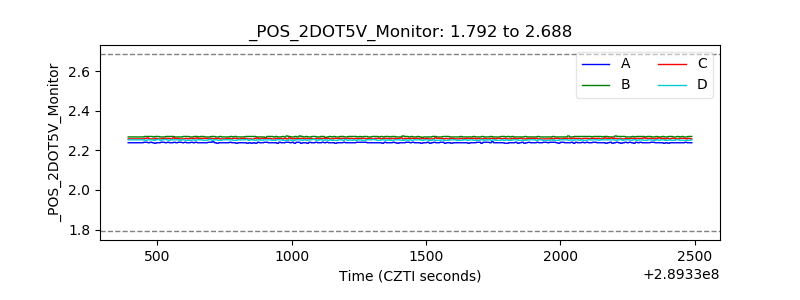 |
| +5 Volts monitor |  |
| _ROLL_ROT | 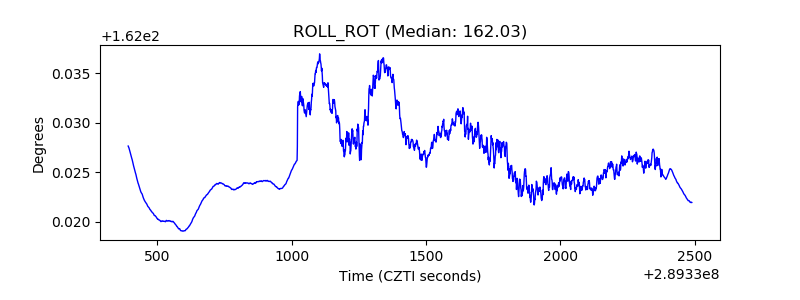 |
| _Roll_DEC | 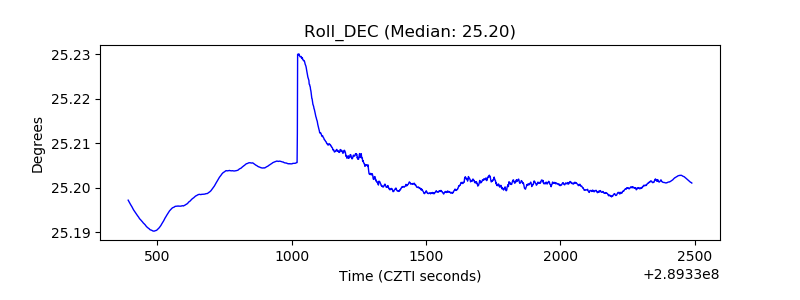 |
| _Roll_RA | 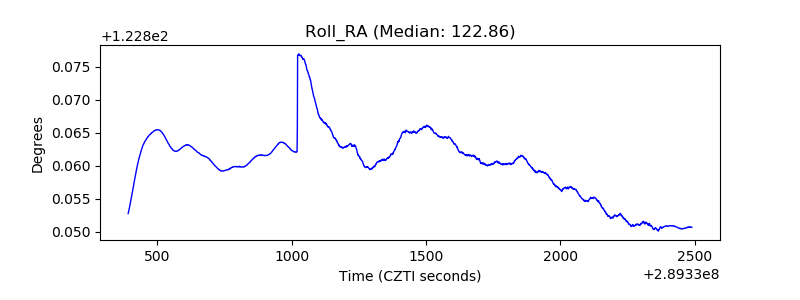 |
| Veto Counter | 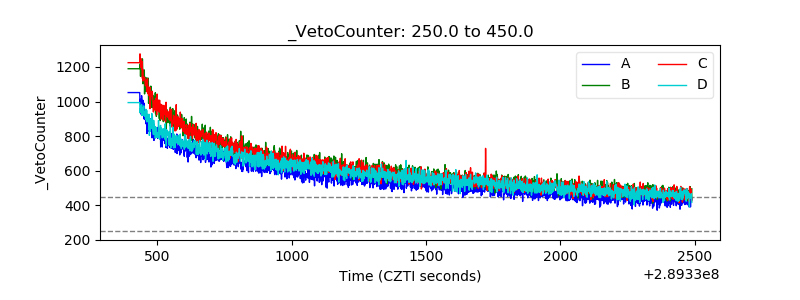 |