| Param | Original file | Final file |
|---|---|---|
| Filename | modeM0/AS1A05_188T01_9000002756cztM0_level2.fits | modeM0/AS1A05_188T01_9000002756cztM0_level2_quad_clean.evt |
| Size (bytes) | 887,978,880 | 860,575,680 |
| Size | 846.8 MB | 820.7 MB |
| Events in quadrant A | 5,354,382 | 5,115,942 |
| Events in quadrant B | 5,287,752 | 5,270,853 |
| Events in quadrant C | 5,336,136 | 4,965,639 |
| Events in quadrant D | 4,474,018 | 4,274,457 |
| Mode SS | |||
|---|---|---|---|
| Quadrant | BADHDUFLAG | Total packets | Discarded packets |
| A | 0 | 1908 | 0 |
| B | 0 | 1908 | 0 |
| C | 0 | 1908 | 0 |
| D | 0 | 1908 | 0 |
| Mode M9 | |||
|---|---|---|---|
| Quadrant | BADHDUFLAG | Total packets | Discarded packets |
| A | 0 | 133 | 0 |
| B | 0 | 133 | 0 |
| C | 0 | 133 | 0 |
| D | 0 | 133 | 0 |
| Mode M0 | |||
|---|---|---|---|
| Quadrant | BADHDUFLAG | Total packets | Discarded packets |
| A | 0 | 229382 | 0 |
| B | 0 | 203855 | 0 |
| C | 0 | 196725 | 0 |
| D | 0 | 270406 | 0 |
| Quadrant | Total seconds | Saturated seconds | Saturation percentage |
|---|---|---|---|
| A | 93907 | 4212 | 4.485289% |
| B | 93907 | 1686 | 1.795393% |
| C | 93907 | 1489 | 1.585611% |
| D | 93907 | 7065 | 7.523401% |
Noise dominated data is calculated using 1-second bins in cleaned event files. If a bin has >2000 counts, and if more than 50% of those come from <1% of pixels, then it is considered to be noise-dominated and hence unusable.
| Quadrant | # 1 sec bins | Bins with >0 counts | Bins with >2000 counts | High rate bins dominated by noise | Noise dominated (total time) | Noise dominated (detector-on time) | Marked lightcurve |
|---|---|---|---|---|---|---|---|
| A | 106903 | 93811 | 0 | 0 | 0.00% | 0.00% |  |
| B | 106903 | 93885 | 0 | 0 | 0.00% | 0.00% |  |
| C | 106903 | 93895 | 0 | 0 | 0.00% | 0.00% |  |
| D | 106903 | 93830 | 0 | 0 | 0.00% | 0.00% |  |
Top three noisy pixels from each quadrant. If the there are fewer than three noisy pixels in the level2.evt file, extra rows are filled as -1
| Pixel properties | Quadrant properties | ||||||
|---|---|---|---|---|---|---|---|
| Quadrant | DetID | PixID | Counts | Sigma | Mean | Median | Sigma |
| A | 0 | 29 | 4556 | 9.33 | 1397 | 1311 | 347.7 |
| A | 7 | 110 | 4436 | 8.99 | 1397 | 1311 | 347.7 |
| A | 9 | 19 | 4073 | 7.94 | 1397 | 1311 | 347.7 |
| B | 2 | 9 | 4400 | 11.07 | 1399 | 1335 | 276.9 |
| B | 2 | 8 | 3654 | 8.38 | 1399 | 1335 | 276.9 |
| B | 14 | 254 | 3542 | 7.97 | 1399 | 1335 | 276.9 |
| C | 1 | 80 | 4079 | 7.66 | 1408 | 1310 | 361.4 |
| C | 1 | 81 | 4017 | 7.49 | 1408 | 1310 | 361.4 |
| C | 12 | 241 | 3804 | 6.9 | 1408 | 1310 | 361.4 |
| D | 10 | 190 | 3313 | 6.4 | 1275 | 1161 | 336.1 |
| D | 3 | 14 | 3293 | 6.34 | 1275 | 1161 | 336.1 |
| D | 3 | 31 | 3210 | 6.1 | 1275 | 1161 | 336.1 |
Histogram calculated using DETX and DETY for each event in the final _common_clean file
| Quadrant A |  |
 |
Quadrant B |
|---|---|---|---|
| Quadrant D | 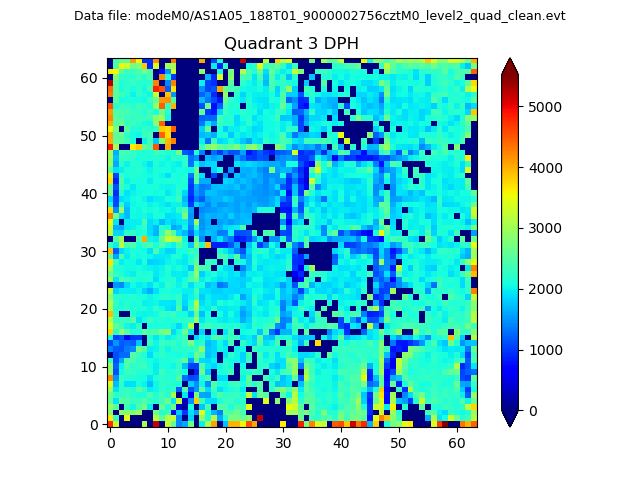 |
 |
Quadrant C |
| Plot type | Count rate plots | Images |
|---|---|---|
| Comparison with Poisson distribution Blue bars denote a histogram of data divided into 1 sec bins. Red curve is a Poisson curve with rate = median count rate of data. |
 |
 |
| Quadrant-wise count rates Data is divided into 100 sec bins |
 |
|
| Module-wise count rates for Quadrant A Data is divided into 100 sec bins |
 |
 |
| Module-wise count rates for Quadrant B Data is divided into 100 sec bins |
 |
 |
| Module-wise count rates for Quadrant C Data is divided into 100 sec bins |
 |
 |
| Module-wise count rates for Quadrant D Data is divided into 100 sec bins |
 |
 |
| Parameter | Plot |
|---|---|
| CZT HV Monitor | 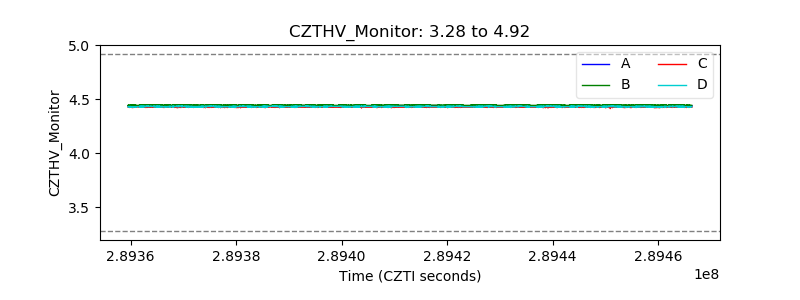 |
| D_VDD | 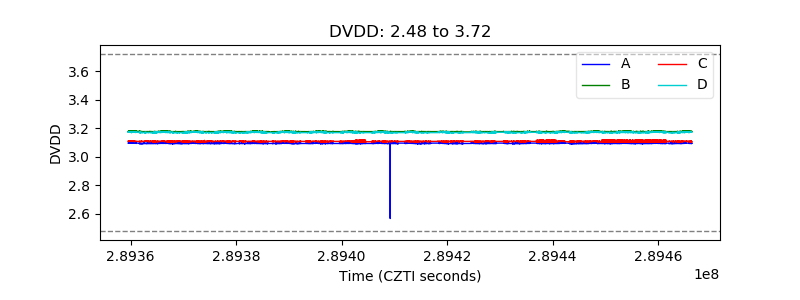 |
| Temperature 1 |  |
| Veto HV Monitor |  |
| Veto LLD |  |
| Alpha Counter |  |
| _CPM_Rate |  |
| CZT Counter |  |
| +2.5 Volts monitor |  |
| +5 Volts monitor | 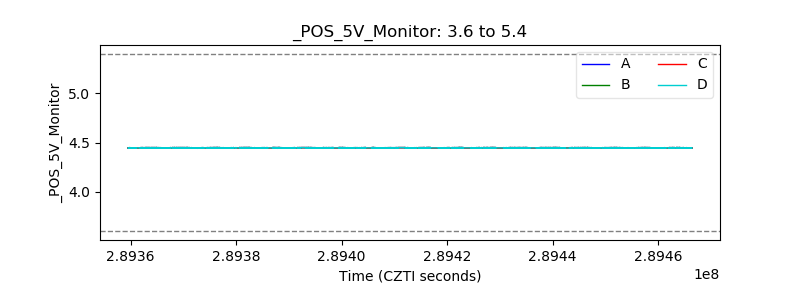 |
| _ROLL_ROT | 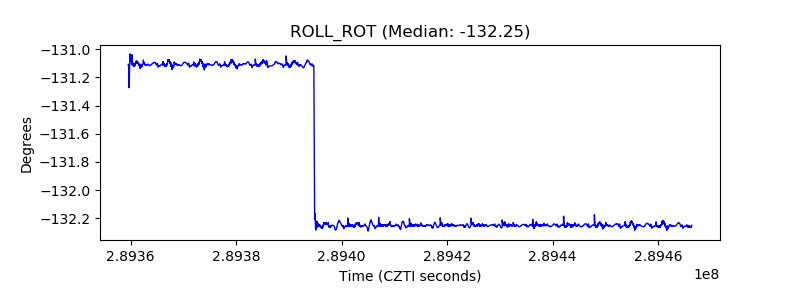 |
| _Roll_DEC |  |
| _Roll_RA |  |
| Veto Counter |  |