| Param | Original file | Final file |
|---|---|---|
| Filename | modeM0/AS1A05_188T01_9000002756_18545cztM0_level2.evt | modeM0/AS1A05_188T01_9000002756_18545cztM0_level2_quad_clean.evt |
| Size (bytes) | 310,397,760 | 51,649,920 |
| Size | 296.0 MB | 49.3 MB |
| Events in quadrant A | 2,671,611 | 331,913 |
| Events in quadrant B | 1,748,933 | 361,960 |
| Events in quadrant C | 1,498,655 | 343,246 |
| Events in quadrant D | 3,265,318 | 301,566 |
| Mode SS | |||
|---|---|---|---|
| Quadrant | BADHDUFLAG | Total packets | Discarded packets |
| A | 0 | 64 | 0 |
| B | 0 | 64 | 0 |
| C | 0 | 64 | 0 |
| D | 0 | 64 | 0 |
| Mode M9 | |||
|---|---|---|---|
| Quadrant | BADHDUFLAG | Total packets | Discarded packets |
| A | 0 | 6 | 0 |
| B | 0 | 6 | 0 |
| C | 0 | 6 | 0 |
| D | 0 | 6 | 0 |
| Mode M0 | |||
|---|---|---|---|
| Quadrant | BADHDUFLAG | Total packets | Discarded packets |
| A | 0 | 10093 | 1 |
| B | 0 | 7276 | 1 |
| C | 0 | 6500 | 1 |
| D | 0 | 11846 | 1 |
| Quadrant | Total seconds | Saturated seconds | Saturation percentage |
|---|---|---|---|
| A | 3164 | 356 | 11.251580% |
| B | 3164 | 76 | 2.402023% |
| C | 3164 | 60 | 1.896334% |
| D | 3163 | 533 | 16.851091% |
Noise dominated data is calculated using 1-second bins in cleaned event files. If a bin has >2000 counts, and if more than 50% of those come from <1% of pixels, then it is considered to be noise-dominated and hence unusable.
| Quadrant | # 1 sec bins | Bins with >0 counts | Bins with >2000 counts | High rate bins dominated by noise | Noise dominated (total time) | Noise dominated (detector-on time) | Marked lightcurve |
|---|---|---|---|---|---|---|---|
| A | 3699 | 3165 | 211 | 211 | 5.70% | 6.67% | 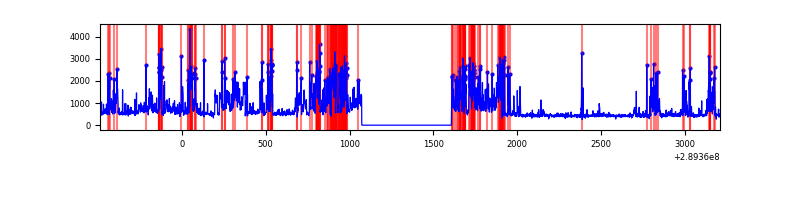 |
| B | 3699 | 3165 | 17 | 17 | 0.46% | 0.54% | 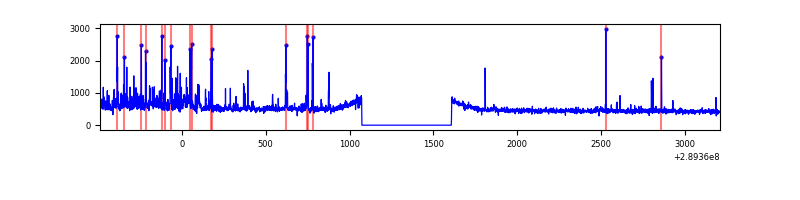 |
| C | 3699 | 3164 | 0 | 0 | 0.00% | 0.00% | 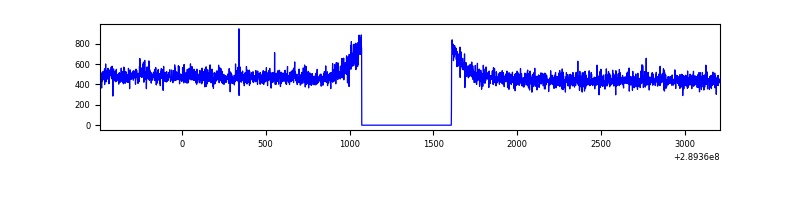 |
| D | 3698 | 3163 | 453 | 453 | 12.25% | 14.32% | 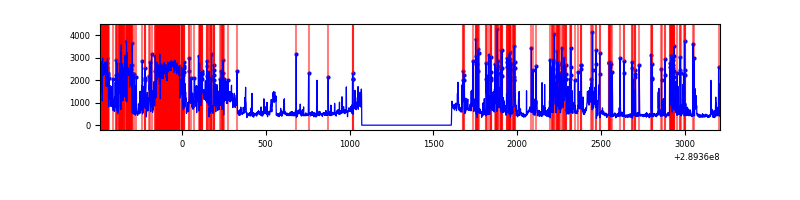 |
Top three noisy pixels from each quadrant. If the there are fewer than three noisy pixels in the level2.evt file, extra rows are filled as -1
| Pixel properties | Quadrant properties | ||||||
|---|---|---|---|---|---|---|---|
| Quadrant | DetID | PixID | Counts | Sigma | Mean | Median | Sigma |
| A | 0 | 13 | 1228772 | 15964.88 | 371 | 363 | 76.9 |
| A | 13 | 170 | 9631 | 120.45 | 371 | 363 | 76.9 |
| A | 13 | 254 | 5582 | 67.83 | 371 | 363 | 76.9 |
| B | 7 | 220 | 145644 | 1908.42 | 389 | 379 | 76.1 |
| B | 3 | 64 | 54286 | 708.2 | 389 | 379 | 76.1 |
| B | 4 | 80 | 9226 | 116.23 | 389 | 379 | 76.1 |
| C | 14 | 238 | 57271 | 652.52 | 369 | 370 | 87.2 |
| C | 13 | 61 | 2702 | 26.74 | 369 | 370 | 87.2 |
| C | 3 | 233 | 1159 | 9.05 | 369 | 370 | 87.2 |
| D | 7 | 238 | 831430 | 9677.13 | 345 | 333 | 85.9 |
| D | 13 | 153 | 577518 | 6720.63 | 345 | 333 | 85.9 |
| D | 1 | 52 | 340839 | 3964.79 | 345 | 333 | 85.9 |
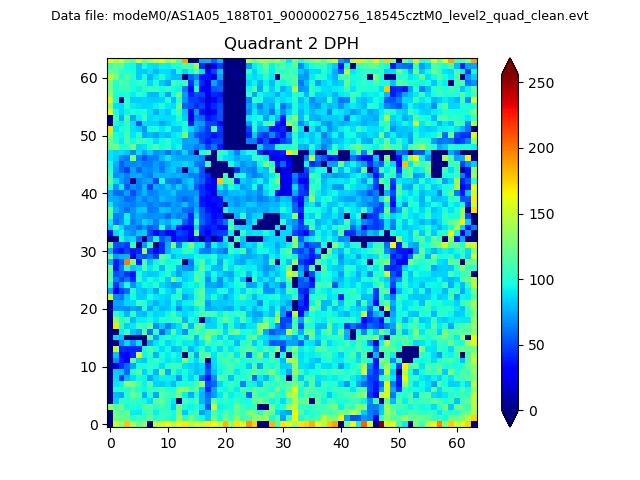
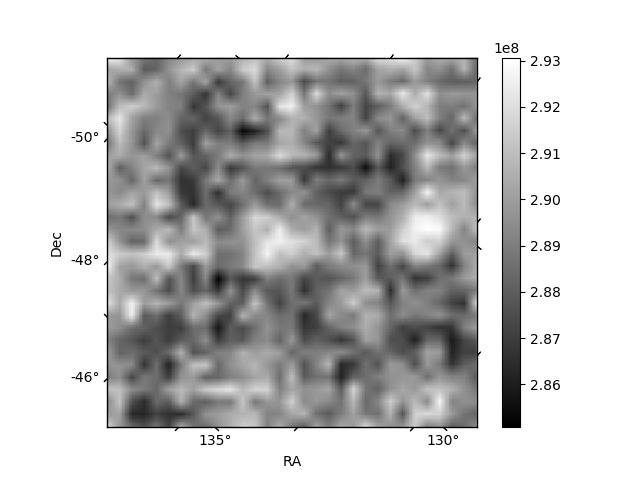
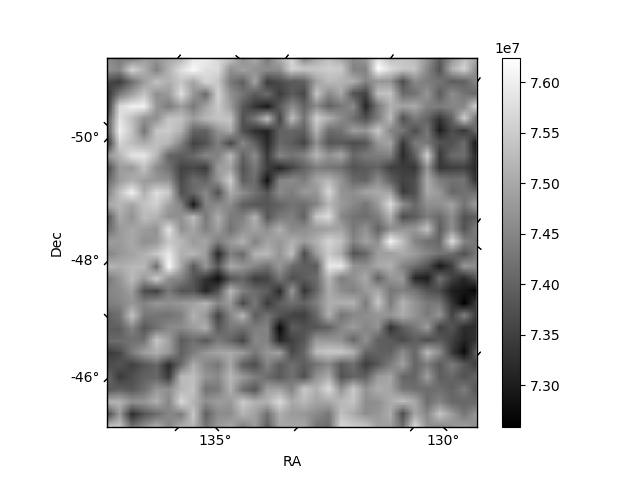
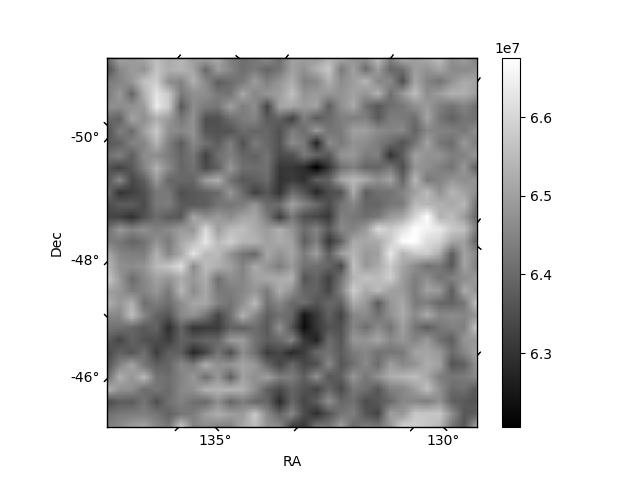
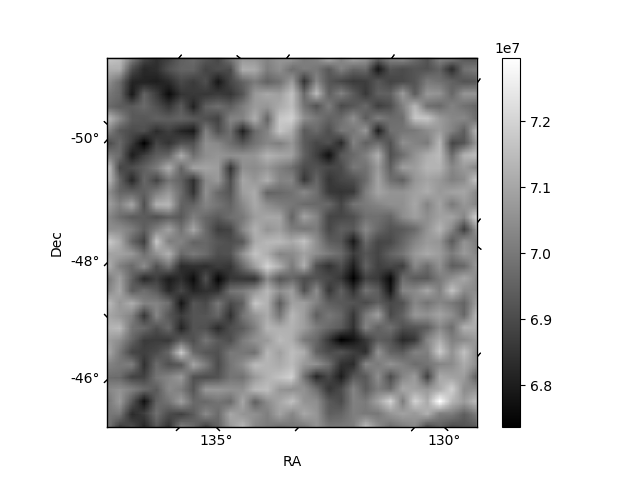
Histogram calculated using DETX and DETY for each event in the final _common_clean file
| Quadrant A | 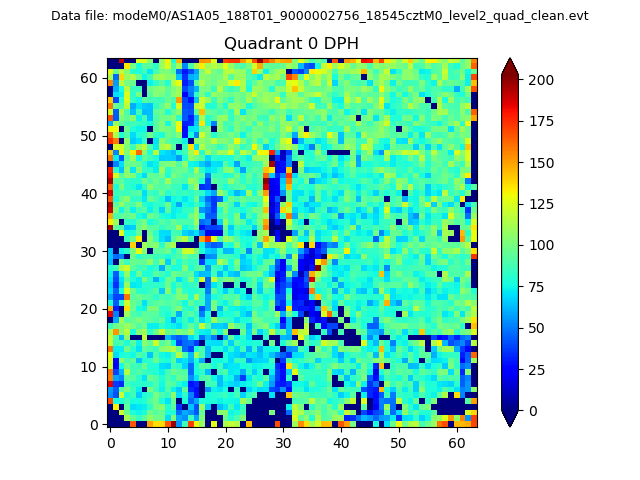 |
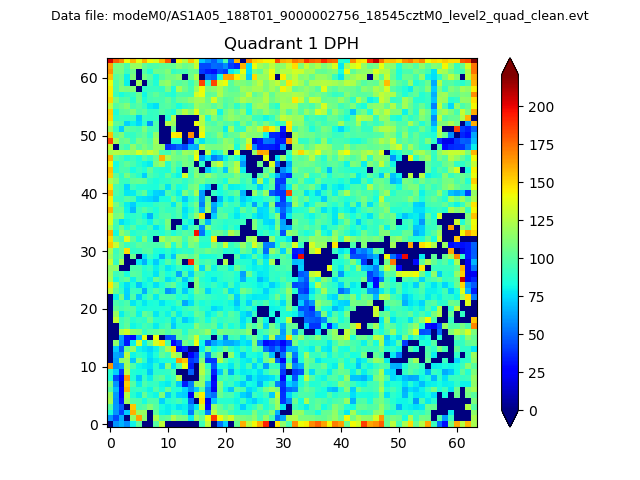 |
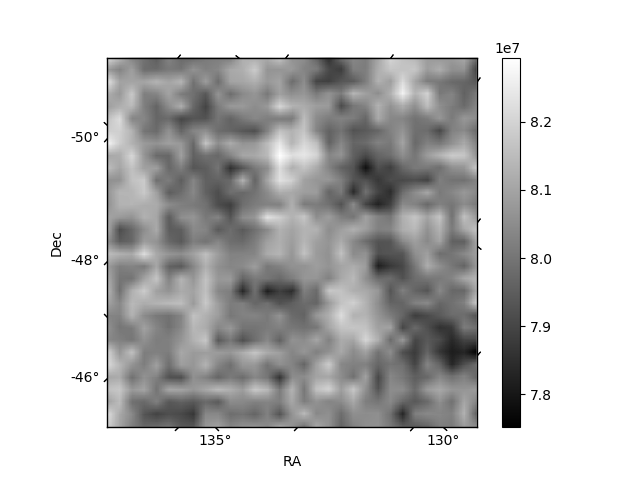
Quadrant B |
|---|---|---|---|
| Quadrant D | 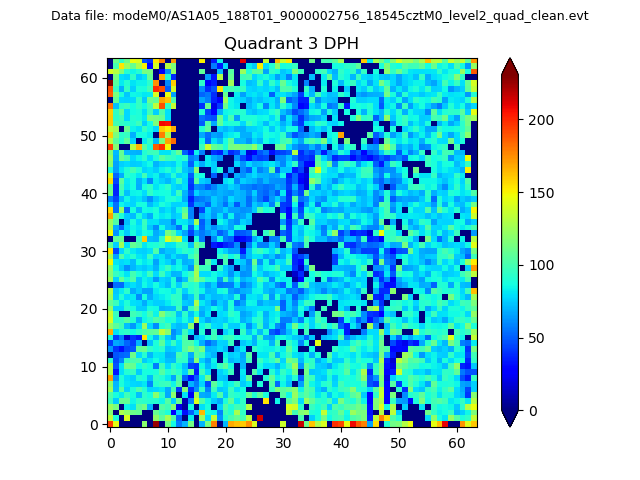 |
 |
Quadrant C |
| Plot type | Count rate plots | Images |
|---|---|---|
| Comparison with Poisson distribution Blue bars denote a histogram of data divided into 1 sec bins. Red curve is a Poisson curve with rate = median count rate of data. |
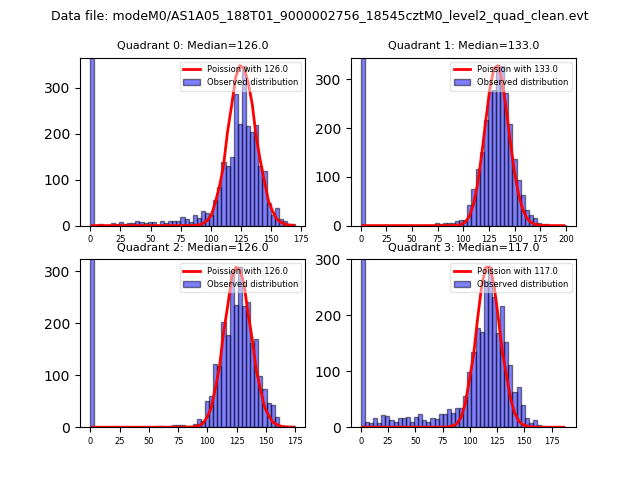 |
 |
| Quadrant-wise count rates Data is divided into 100 sec bins |
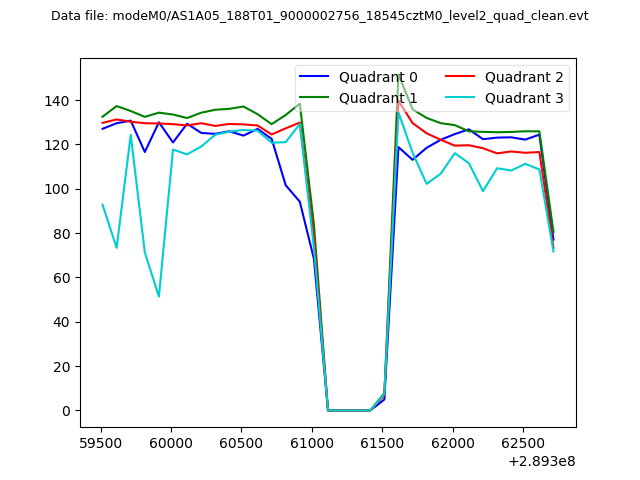 |
|
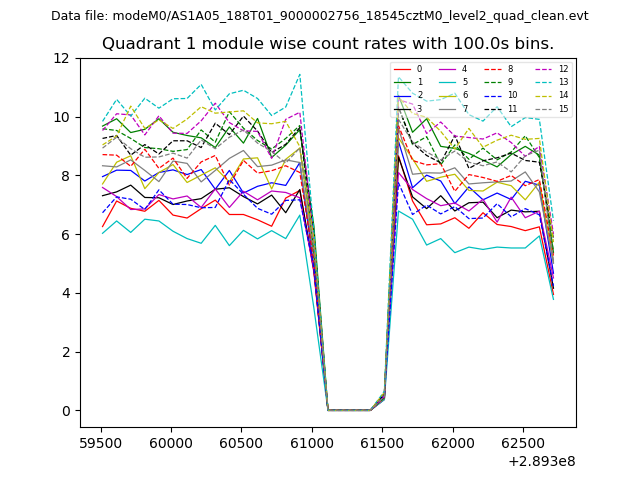
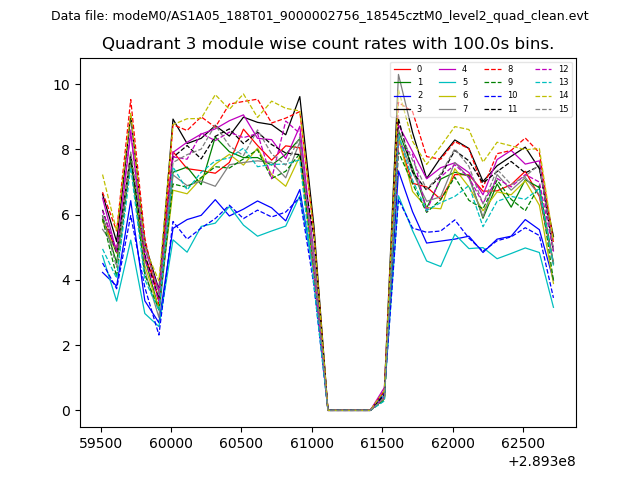
| Module-wise count rates for Quadrant A Data is divided into 100 sec bins |
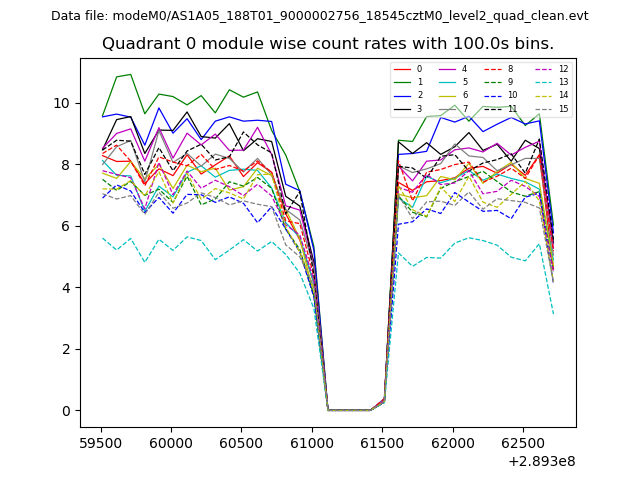 |
 |
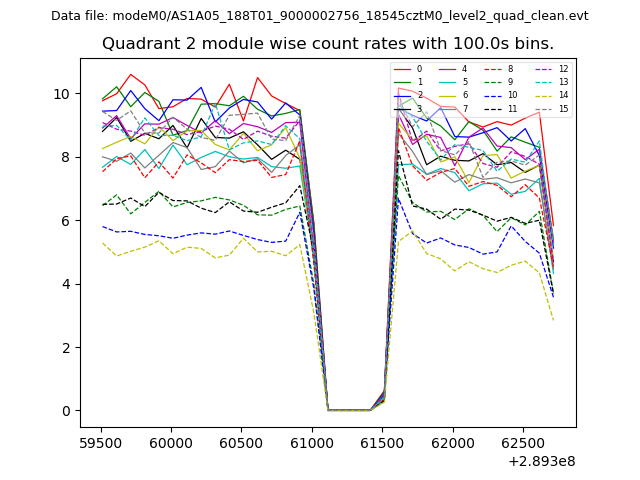
| Module-wise count rates for Quadrant B Data is divided into 100 sec bins |
 |
 |
| Module-wise count rates for Quadrant C Data is divided into 100 sec bins |
 |
 |
| Module-wise count rates for Quadrant D Data is divided into 100 sec bins |
 |
 |
| Parameter | Plot |
|---|---|
| CZT HV Monitor | 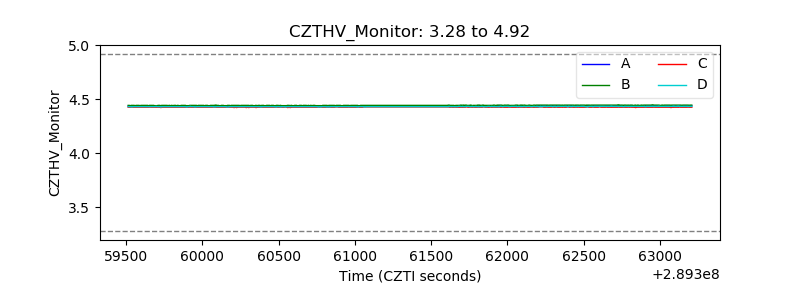 |
| D_VDD | 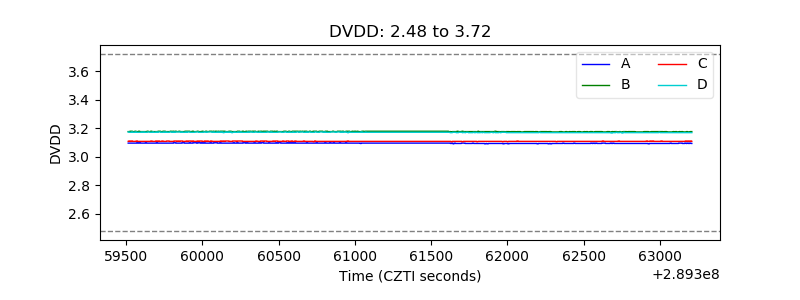 |
| Temperature 1 | 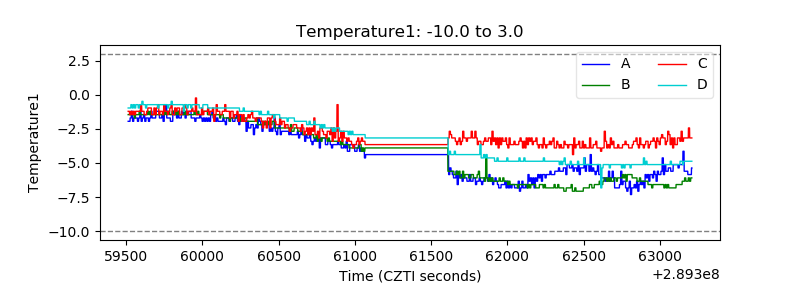 |
| Veto HV Monitor |  |
| Veto LLD | 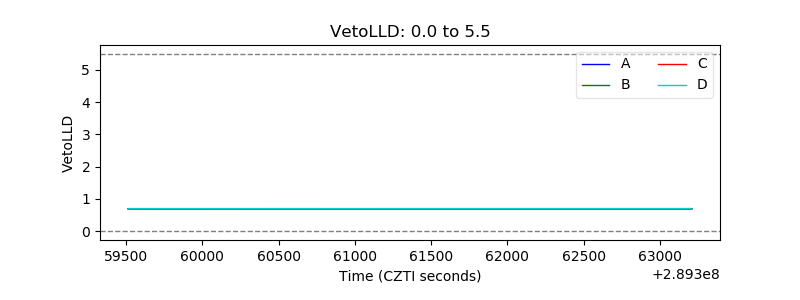 |
| Alpha Counter | 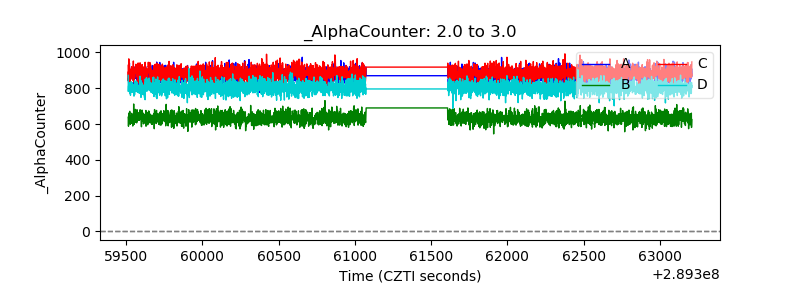 |
| _CPM_Rate |  |
| CZT Counter | 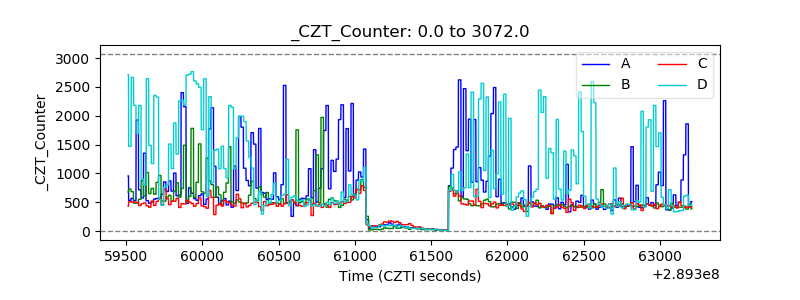 |
| +2.5 Volts monitor |  |
| +5 Volts monitor |  |
| _ROLL_ROT | 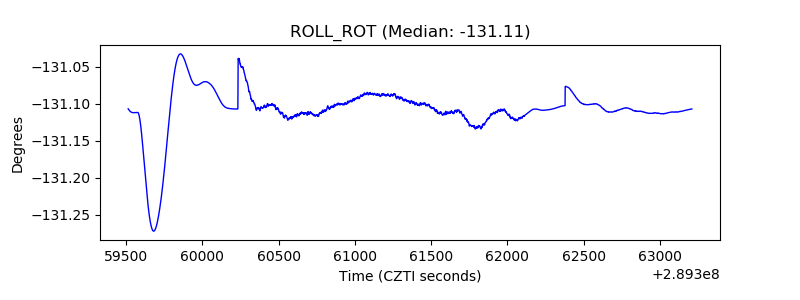 |
| _Roll_DEC | 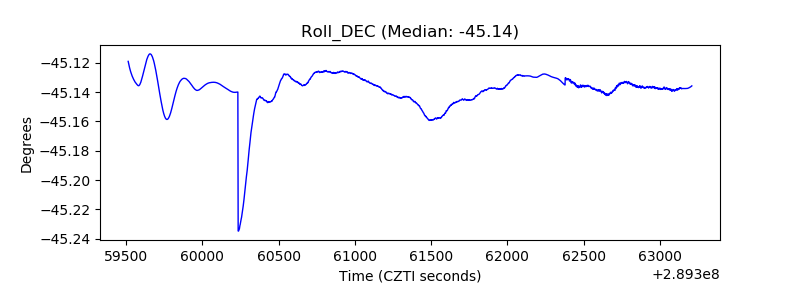 |
| _Roll_RA | 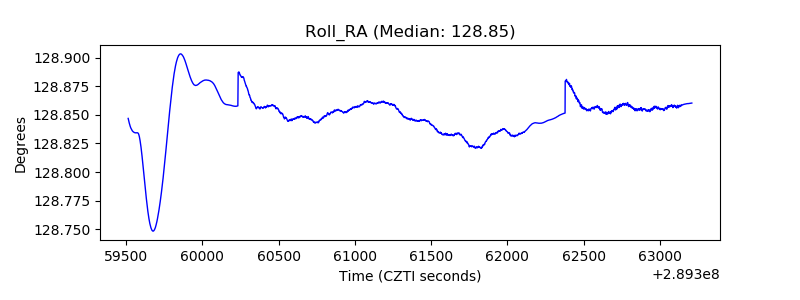 |
| Veto Counter | 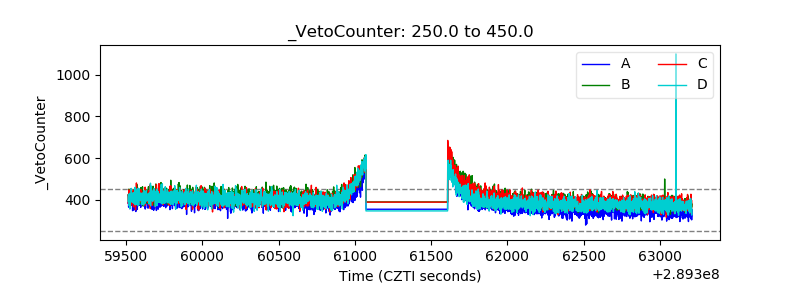 |