| Param | Original file | Final file |
|---|---|---|
| Filename | modeM0/AS1A05_188T01_9000002756_18550cztM0_level2.evt | modeM0/AS1A05_188T01_9000002756_18550cztM0_level2_quad_clean.evt |
| Size (bytes) | 1,465,364,160 | 239,071,680 |
| Size | 1.4 GB | 228.0 MB |
| Events in quadrant A | 11,491,334 | 1,502,750 |
| Events in quadrant B | 9,816,673 | 1,545,066 |
| Events in quadrant C | 9,064,326 | 1,492,521 |
| Events in quadrant D | 12,748,015 | 1,416,316 |
| Mode SS | |||
|---|---|---|---|
| Quadrant | BADHDUFLAG | Total packets | Discarded packets |
| A | 0 | 380 | 0 |
| B | 0 | 380 | 0 |
| C | 0 | 380 | 0 |
| D | 0 | 380 | 0 |
| Mode M9 | |||
|---|---|---|---|
| Quadrant | BADHDUFLAG | Total packets | Discarded packets |
| A | 0 | 22 | 0 |
| B | 0 | 22 | 0 |
| C | 0 | 22 | 0 |
| D | 0 | 22 | 0 |
| Mode M0 | |||
|---|---|---|---|
| Quadrant | BADHDUFLAG | Total packets | Discarded packets |
| A | 0 | 46443 | 4 |
| B | 0 | 41171 | 4 |
| C | 0 | 39229 | 4 |
| D | 0 | 50681 | 4 |
| Quadrant | Total seconds | Saturated seconds | Saturation percentage |
|---|---|---|---|
| A | 18636 | 1011 | 5.424984% |
| B | 18636 | 589 | 3.160549% |
| C | 18636 | 426 | 2.285898% |
| D | 18636 | 1301 | 6.981112% |
Noise dominated data is calculated using 1-second bins in cleaned event files. If a bin has >2000 counts, and if more than 50% of those come from <1% of pixels, then it is considered to be noise-dominated and hence unusable.
| Quadrant | # 1 sec bins | Bins with >0 counts | Bins with >2000 counts | High rate bins dominated by noise | Noise dominated (total time) | Noise dominated (detector-on time) | Marked lightcurve |
|---|---|---|---|---|---|---|---|
| A | 20741 | 18636 | 599 | 599 | 2.89% | 3.21% | 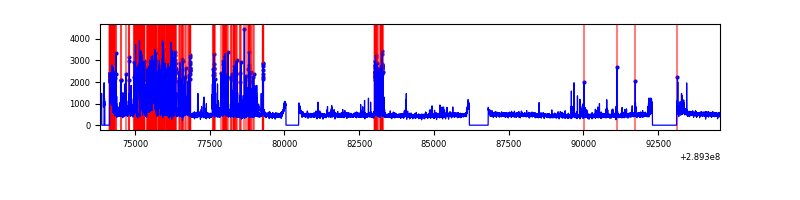 |
| B | 20741 | 18637 | 252 | 252 | 1.21% | 1.35% | 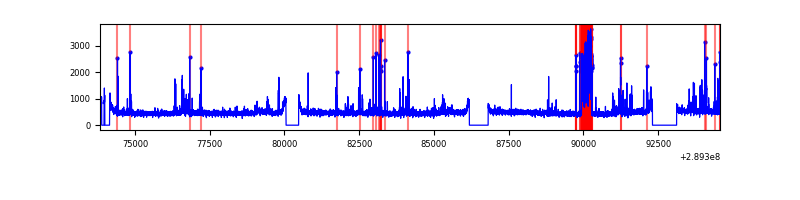 |
| C | 20741 | 18636 | 29 | 29 | 0.14% | 0.16% | 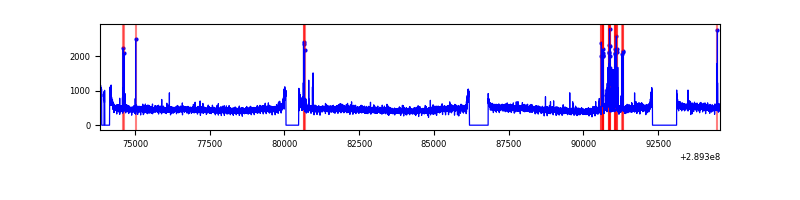 |
| D | 20741 | 18637 | 948 | 948 | 4.57% | 5.09% | 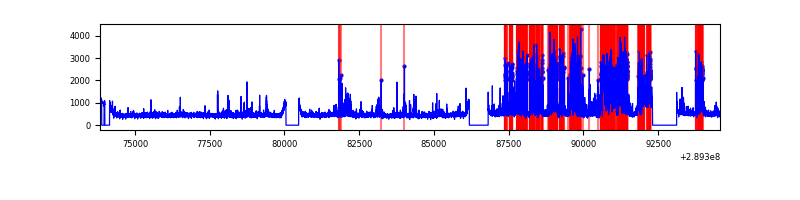 |
Top three noisy pixels from each quadrant. If the there are fewer than three noisy pixels in the level2.evt file, extra rows are filled as -1
| Pixel properties | Quadrant properties | ||||||
|---|---|---|---|---|---|---|---|
| Quadrant | DetID | PixID | Counts | Sigma | Mean | Median | Sigma |
| A | 0 | 13 | 3018789 | 6788.8 | 2190 | 2141 | 444.4 |
| A | 13 | 254 | 29934 | 62.55 | 2190 | 2141 | 444.4 |
| A | 0 | 226 | 18835 | 37.57 | 2190 | 2141 | 444.4 |
| B | 12 | 18 | 532298 | 1252.56 | 2220 | 2165 | 423.2 |
| B | 3 | 64 | 214104 | 500.75 | 2220 | 2165 | 423.2 |
| B | 15 | 222 | 131400 | 305.35 | 2220 | 2165 | 423.2 |
| C | 9 | 54 | 380131 | 758.29 | 2138 | 2150 | 498.5 |
| C | 14 | 238 | 330379 | 658.48 | 2138 | 2150 | 498.5 |
| C | 3 | 233 | 22434 | 40.69 | 2138 | 2150 | 498.5 |
| D | 7 | 238 | 4433787 | 8587.23 | 2122 | 2058 | 516.1 |
| D | 1 | 52 | 136615 | 260.73 | 2122 | 2058 | 516.1 |
| D | 2 | 234 | 81083 | 153.12 | 2122 | 2058 | 516.1 |
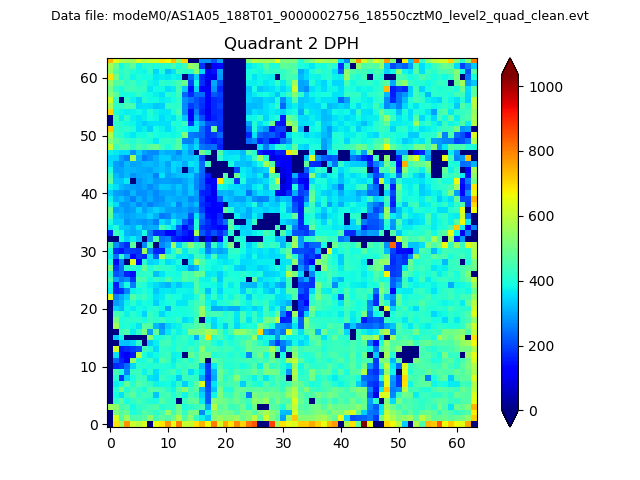
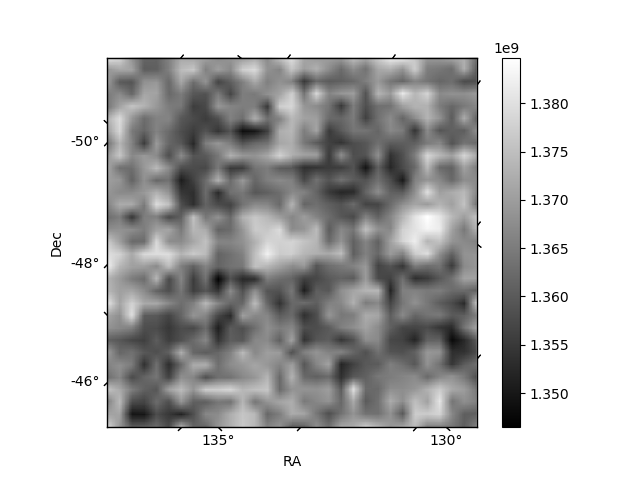
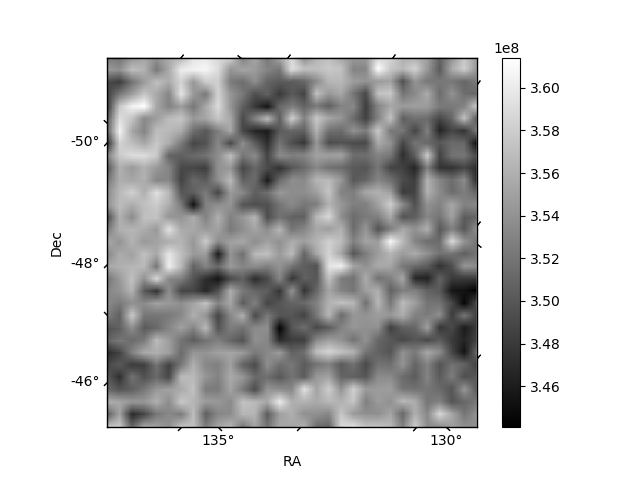
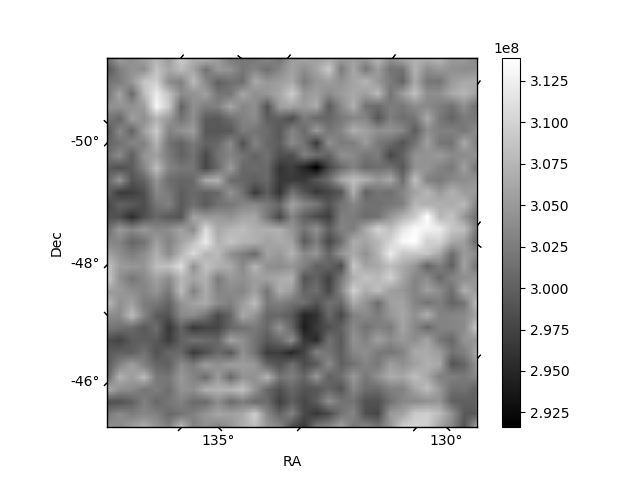
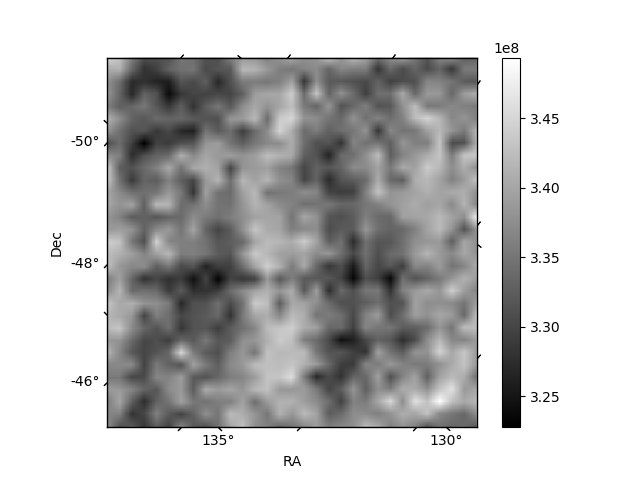
Histogram calculated using DETX and DETY for each event in the final _common_clean file
| Quadrant A | 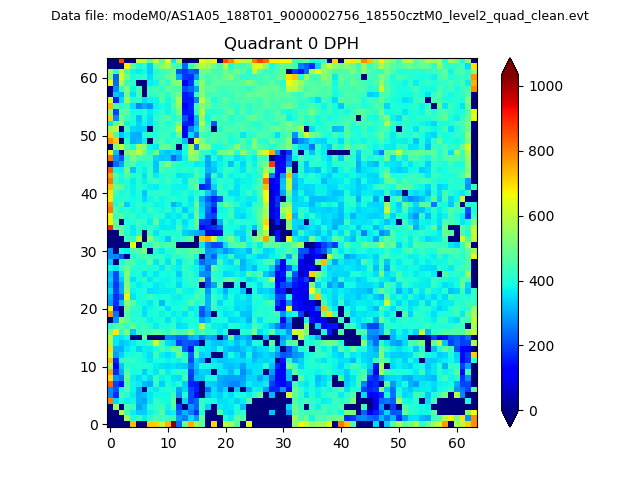 |
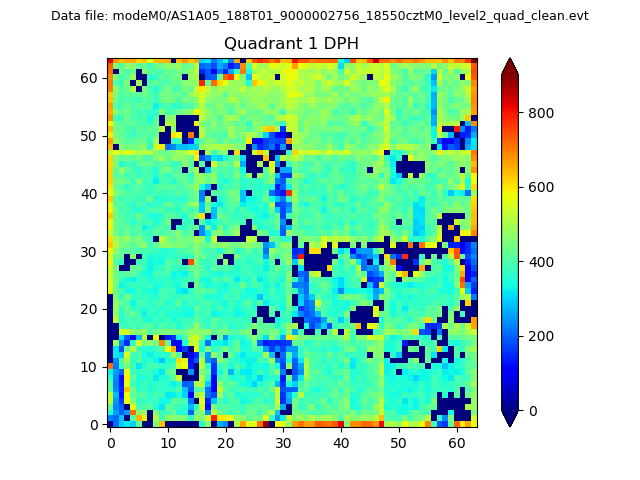 |
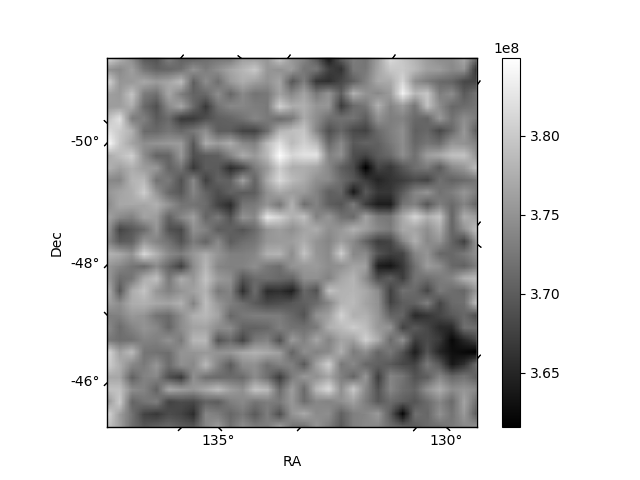
Quadrant B |
|---|---|---|---|
| Quadrant D | 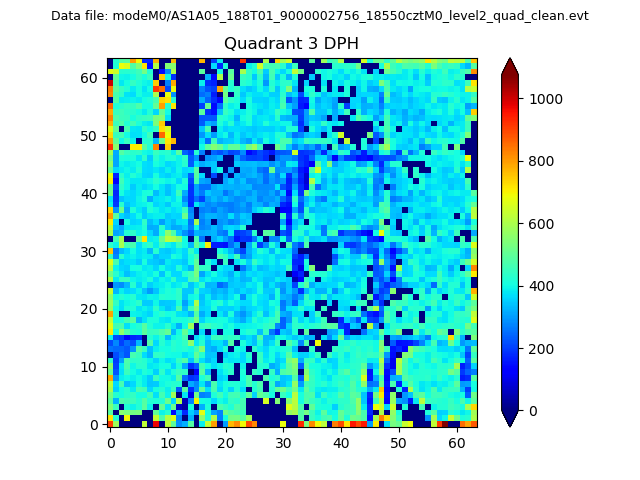 |
 |
Quadrant C |
| Plot type | Count rate plots | Images |
|---|---|---|
| Comparison with Poisson distribution Blue bars denote a histogram of data divided into 1 sec bins. Red curve is a Poisson curve with rate = median count rate of data. |
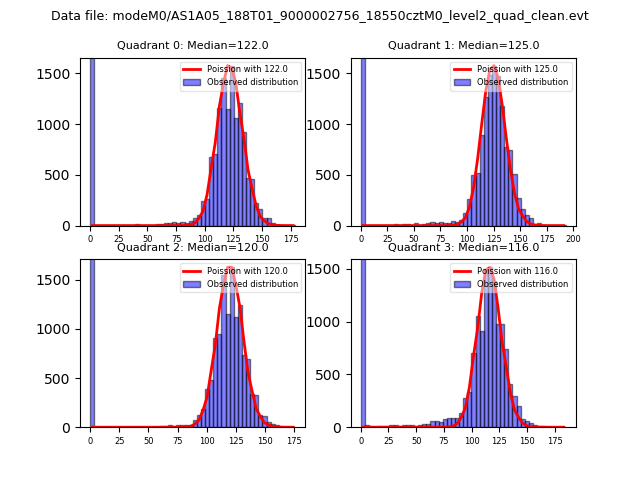 |
 |
| Quadrant-wise count rates Data is divided into 100 sec bins |
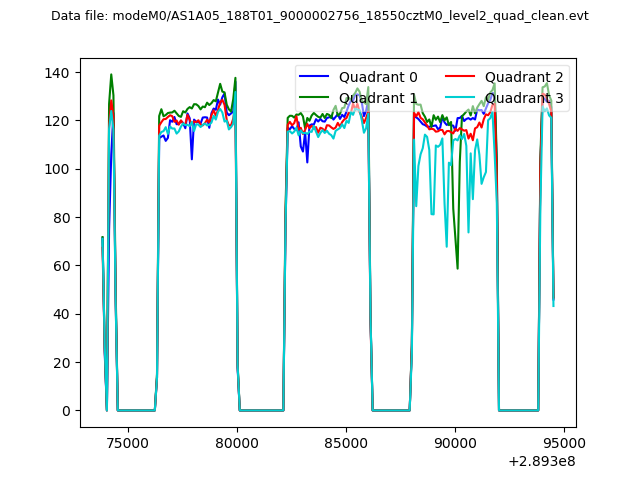 |
|
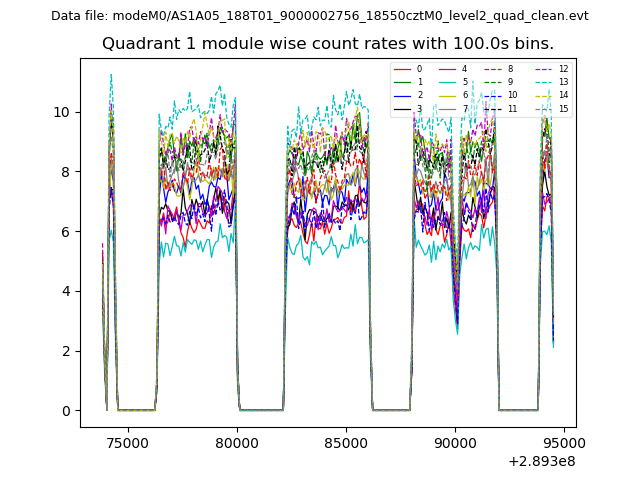
| Module-wise count rates for Quadrant A Data is divided into 100 sec bins |
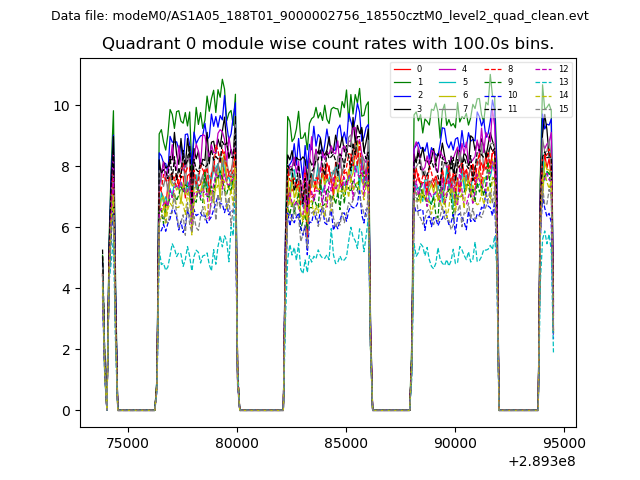 |
 |
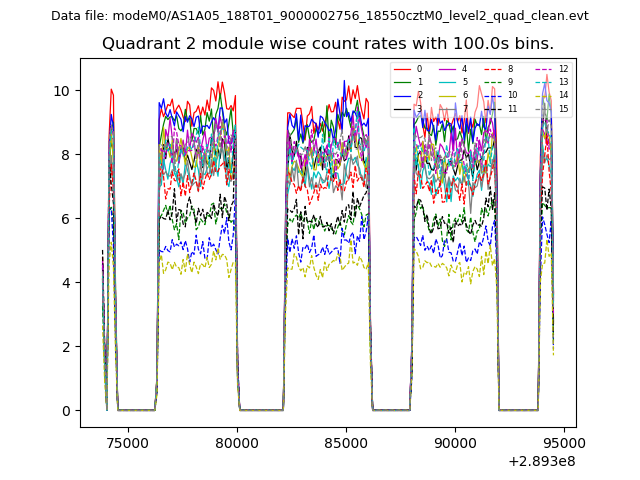
| Module-wise count rates for Quadrant B Data is divided into 100 sec bins |
 |
 |
| Module-wise count rates for Quadrant C Data is divided into 100 sec bins |
 |
 |
| Module-wise count rates for Quadrant D Data is divided into 100 sec bins |
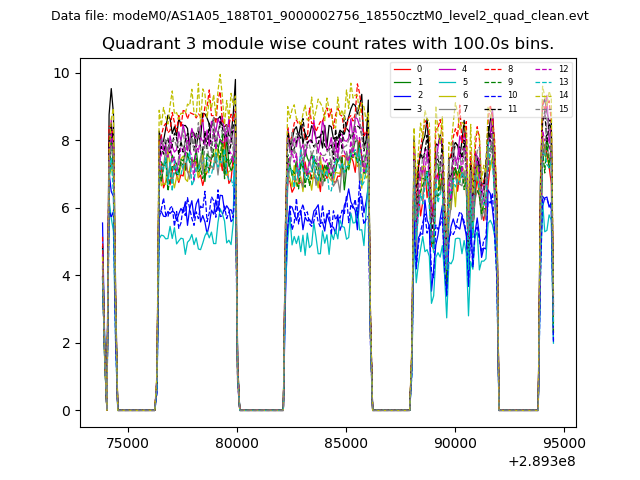 |
 |
| Parameter | Plot |
|---|---|
| CZT HV Monitor | 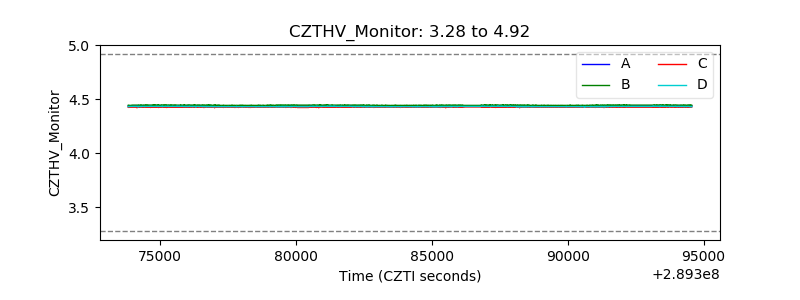 |
| D_VDD | 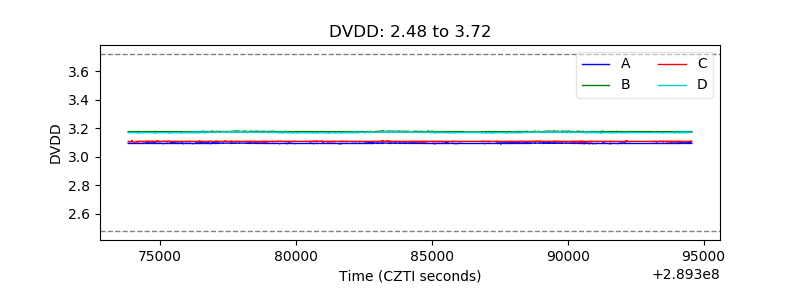 |
| Temperature 1 | 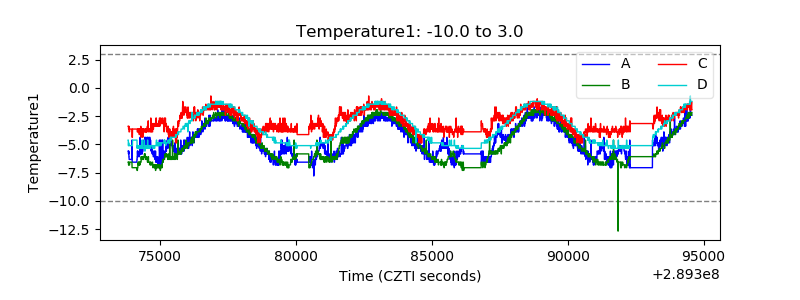 |
| Veto HV Monitor | 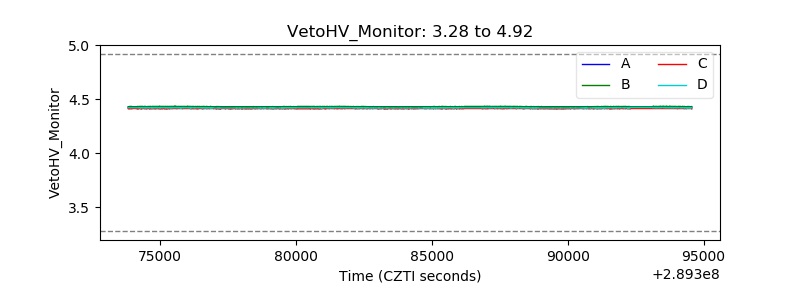 |
| Veto LLD | 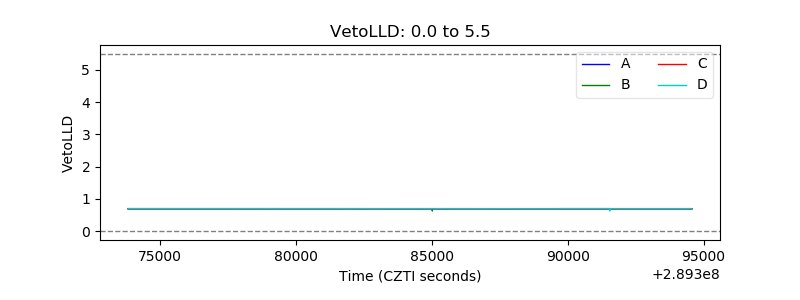 |
| Alpha Counter | 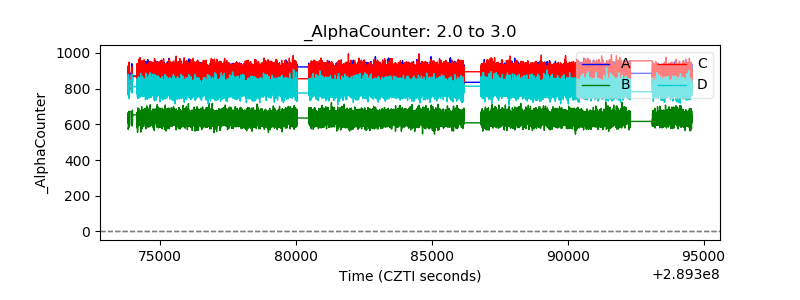 |
| _CPM_Rate | 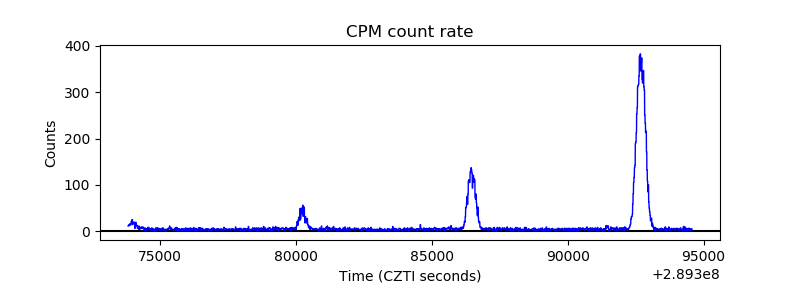 |
| CZT Counter | 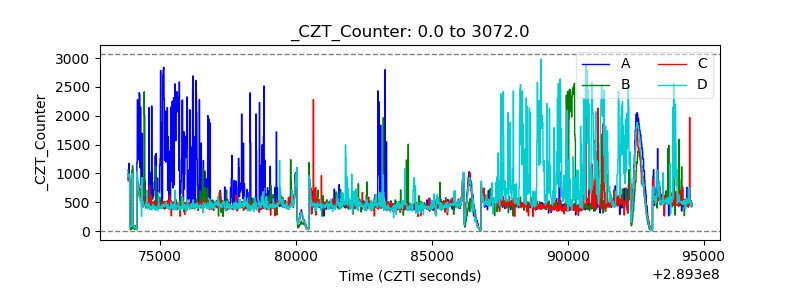 |
| +2.5 Volts monitor |  |
| +5 Volts monitor |  |
| _ROLL_ROT | 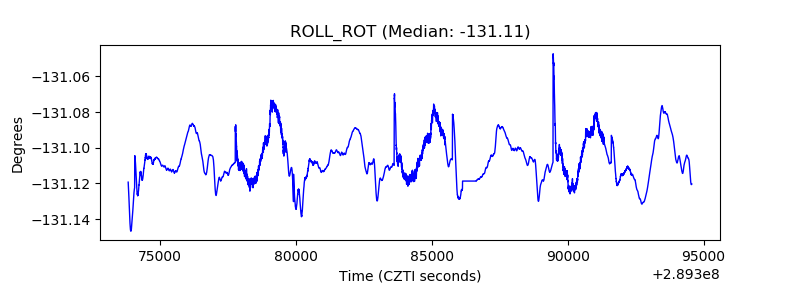 |
| _Roll_DEC | 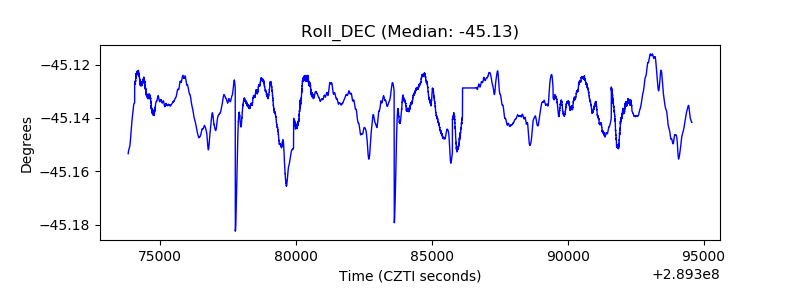 |
| _Roll_RA | 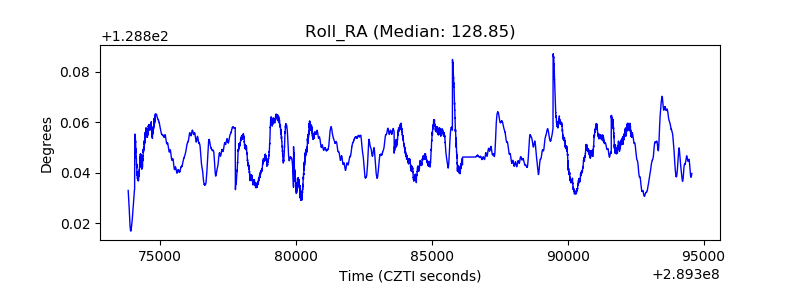 |
| Veto Counter | 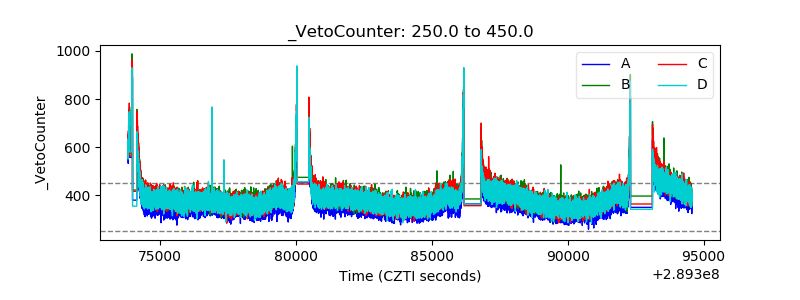 |