| Param | Original file | Final file |
|---|---|---|
| Filename | modeM0/AS1A05_188T01_9000002756_18551cztM0_level2.evt | modeM0/AS1A05_188T01_9000002756_18551cztM0_level2_quad_clean.evt |
| Size (bytes) | 492,589,440 | 94,561,920 |
| Size | 469.8 MB | 90.2 MB |
| Events in quadrant A | 3,121,154 | 615,262 |
| Events in quadrant B | 3,606,620 | 625,541 |
| Events in quadrant C | 3,372,553 | 595,021 |
| Events in quadrant D | 4,376,130 | 574,343 |
| Mode SS | |||
|---|---|---|---|
| Quadrant | BADHDUFLAG | Total packets | Discarded packets |
| A | 0 | 132 | 0 |
| B | 0 | 132 | 0 |
| C | 0 | 132 | 0 |
| D | 0 | 132 | 0 |
| Mode M9 | |||
|---|---|---|---|
| Quadrant | BADHDUFLAG | Total packets | Discarded packets |
| A | 0 | 10 | 0 |
| B | 0 | 10 | 0 |
| C | 0 | 10 | 0 |
| D | 0 | 10 | 0 |
| Mode M0 | |||
|---|---|---|---|
| Quadrant | BADHDUFLAG | Total packets | Discarded packets |
| A | 0 | 13545 | 1 |
| B | 0 | 14905 | 2 |
| C | 0 | 14262 | 1 |
| D | 0 | 17241 | 1 |
| Quadrant | Total seconds | Saturated seconds | Saturation percentage |
|---|---|---|---|
| A | 6503 | 46 | 0.707366% |
| B | 6503 | 136 | 2.091342% |
| C | 6503 | 171 | 2.629556% |
| D | 6503 | 297 | 4.567123% |
Noise dominated data is calculated using 1-second bins in cleaned event files. If a bin has >2000 counts, and if more than 50% of those come from <1% of pixels, then it is considered to be noise-dominated and hence unusable.
| Quadrant | # 1 sec bins | Bins with >0 counts | Bins with >2000 counts | High rate bins dominated by noise | Noise dominated (total time) | Noise dominated (detector-on time) | Marked lightcurve |
|---|---|---|---|---|---|---|---|
| A | 7503 | 6503 | 0 | 0 | 0.00% | 0.00% | 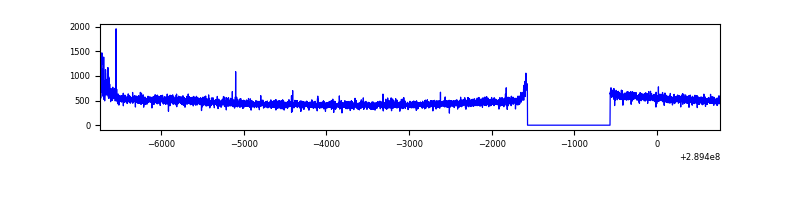 |
| B | 7503 | 6503 | 62 | 62 | 0.83% | 0.95% | 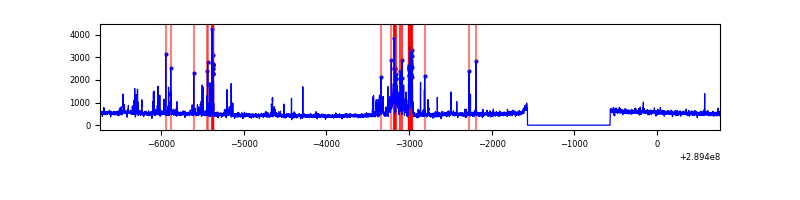 |
| C | 7503 | 6503 | 61 | 61 | 0.81% | 0.94% | 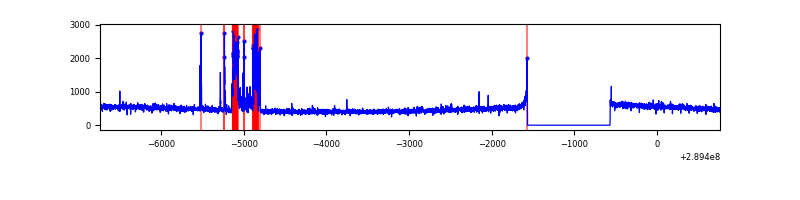 |
| D | 7503 | 6503 | 246 | 246 | 3.28% | 3.78% | 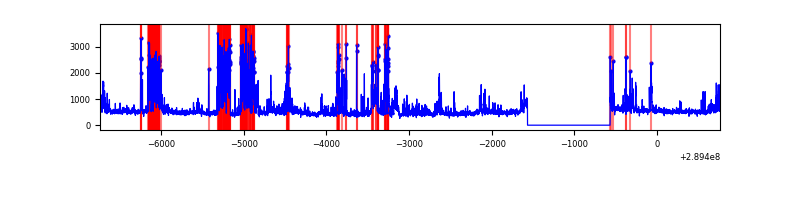 |
Top three noisy pixels from each quadrant. If the there are fewer than three noisy pixels in the level2.evt file, extra rows are filled as -1
| Pixel properties | Quadrant properties | ||||||
|---|---|---|---|---|---|---|---|
| Quadrant | DetID | PixID | Counts | Sigma | Mean | Median | Sigma |
| A | 0 | 13 | 44250 | 267.19 | 797 | 778 | 162.7 |
| A | 13 | 254 | 11349 | 64.97 | 797 | 778 | 162.7 |
| A | 0 | 226 | 7064 | 38.64 | 797 | 778 | 162.7 |
| B | 3 | 64 | 469462 | 3107.99 | 792 | 770 | 150.8 |
| B | 12 | 111 | 17888 | 113.51 | 792 | 770 | 150.8 |
| B | 11 | 111 | 15811 | 99.74 | 792 | 770 | 150.8 |
| C | 9 | 54 | 300951 | 1689.52 | 756 | 762 | 177.7 |
| C | 14 | 238 | 118806 | 664.37 | 756 | 762 | 177.7 |
| C | 3 | 233 | 6783 | 33.89 | 756 | 762 | 177.7 |
| D | 7 | 238 | 1335419 | 7221.18 | 760 | 736 | 184.8 |
| D | 14 | 34 | 102286 | 549.42 | 760 | 736 | 184.8 |
| D | 2 | 234 | 26856 | 141.32 | 760 | 736 | 184.8 |
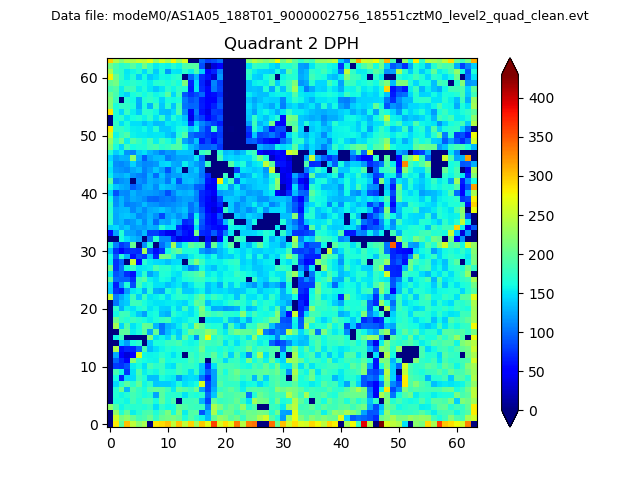
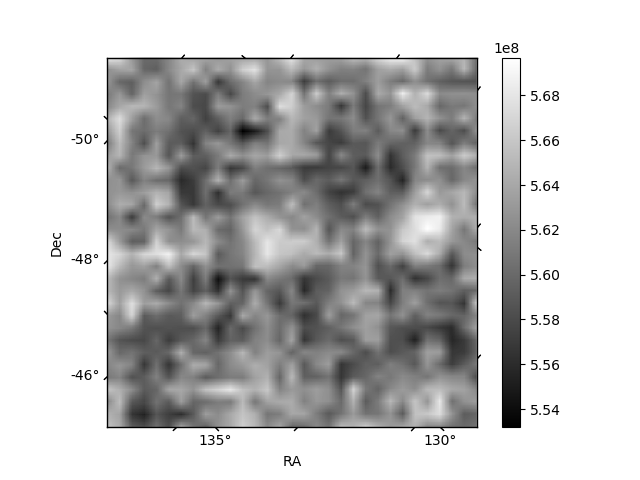
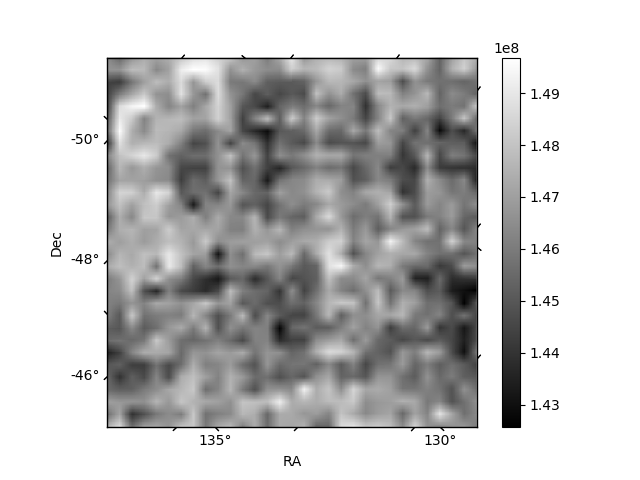
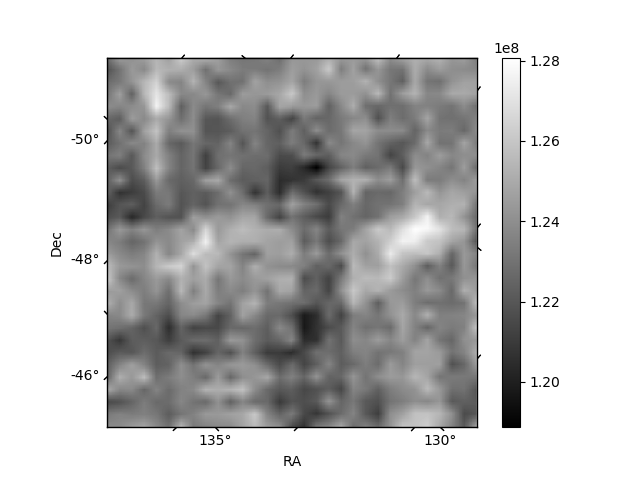
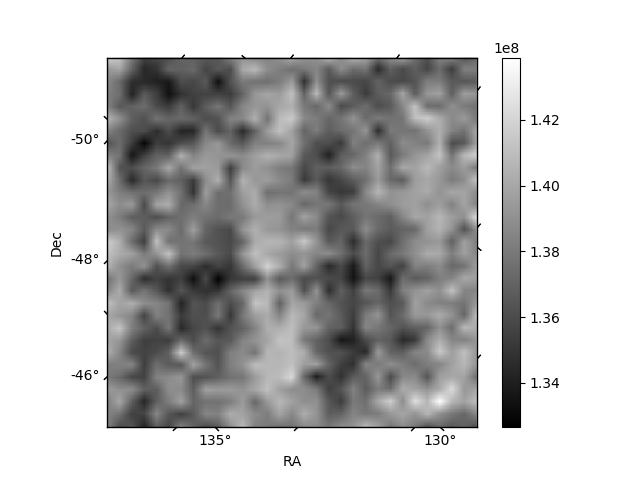
Histogram calculated using DETX and DETY for each event in the final _common_clean file
| Quadrant A | 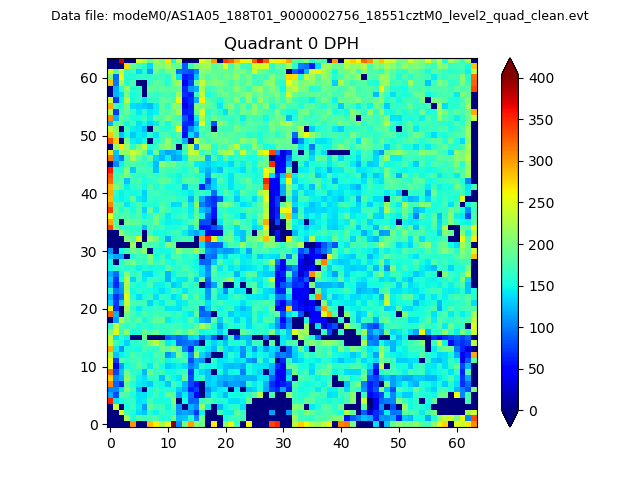 |
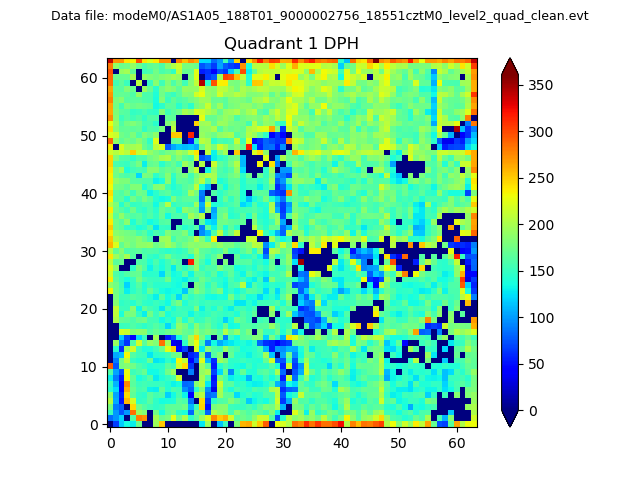 |
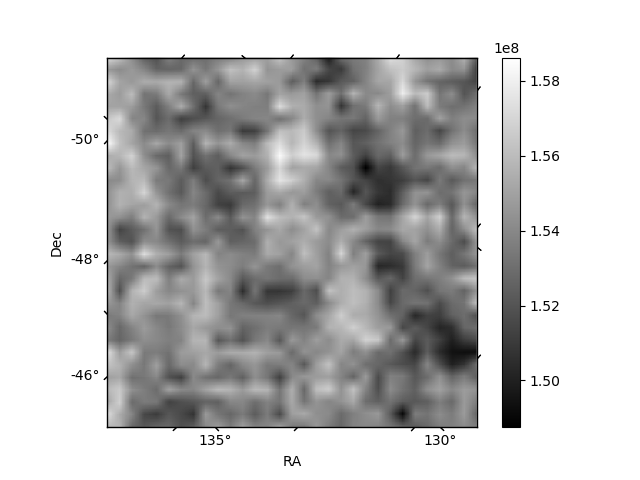
Quadrant B |
|---|---|---|---|
| Quadrant D | 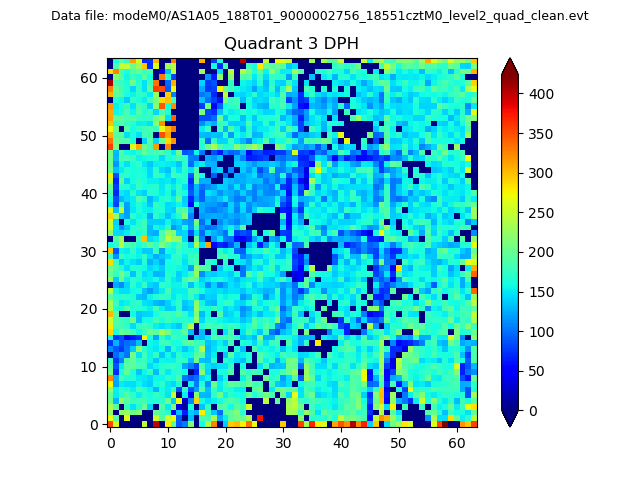 |
 |
Quadrant C |
| Plot type | Count rate plots | Images |
|---|---|---|
| Comparison with Poisson distribution Blue bars denote a histogram of data divided into 1 sec bins. Red curve is a Poisson curve with rate = median count rate of data. |
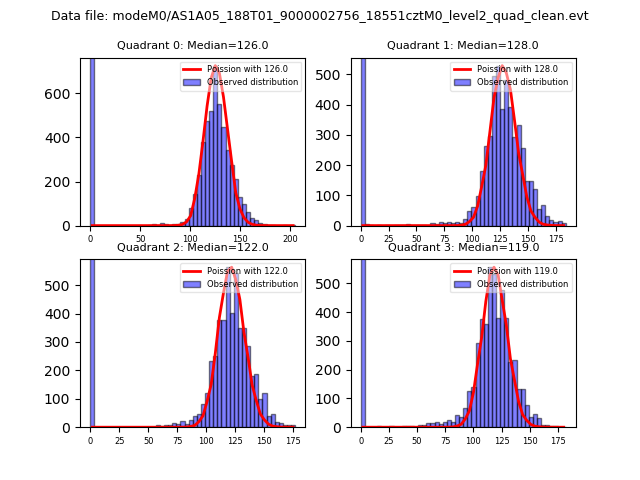 |
 |
| Quadrant-wise count rates Data is divided into 100 sec bins |
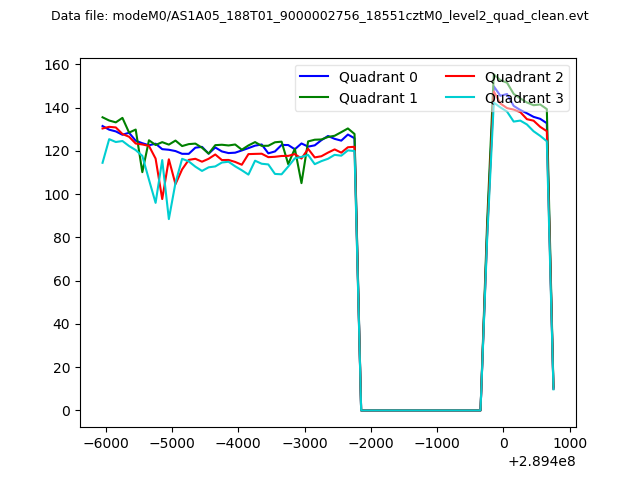 |
|
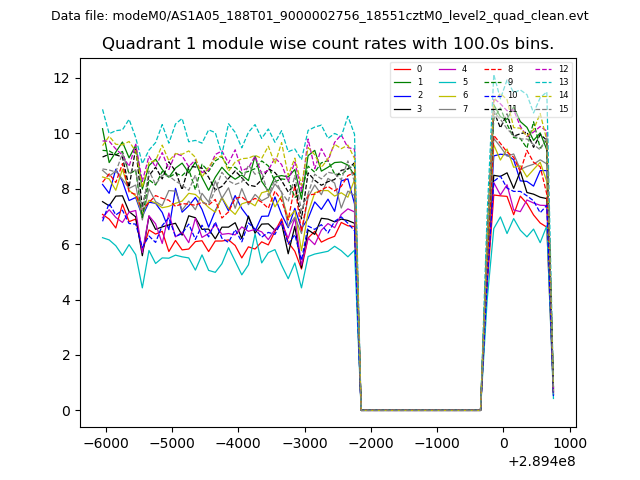
| Module-wise count rates for Quadrant A Data is divided into 100 sec bins |
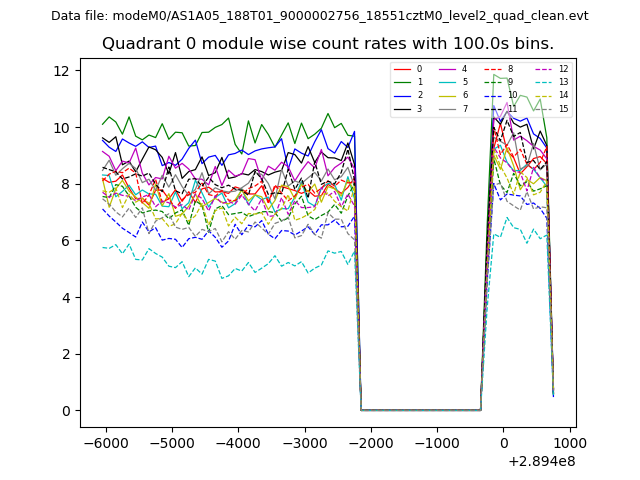 |
 |
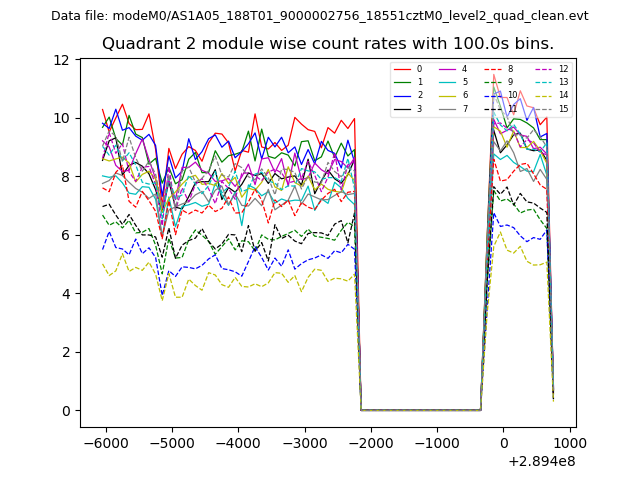
| Module-wise count rates for Quadrant B Data is divided into 100 sec bins |
 |
 |
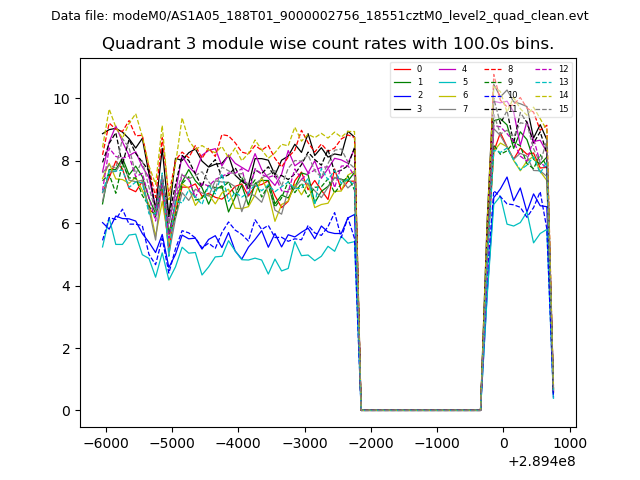
| Module-wise count rates for Quadrant C Data is divided into 100 sec bins |
 |
 |
| Module-wise count rates for Quadrant D Data is divided into 100 sec bins |
 |
 |
| Parameter | Plot |
|---|---|
| CZT HV Monitor | 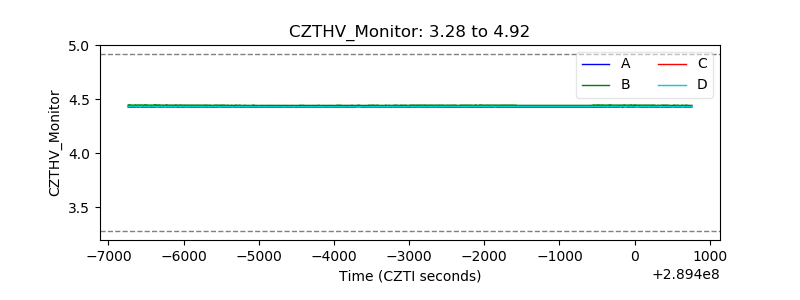 |
| D_VDD | 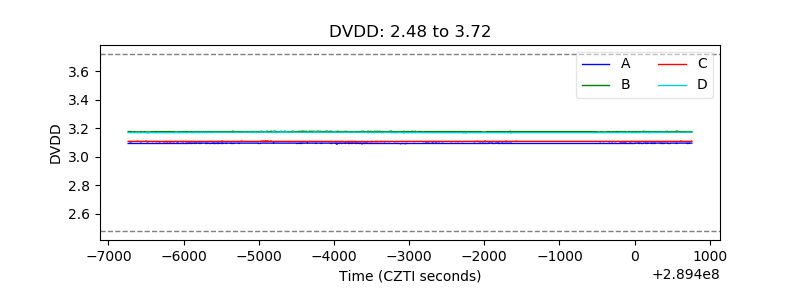 |
| Temperature 1 | 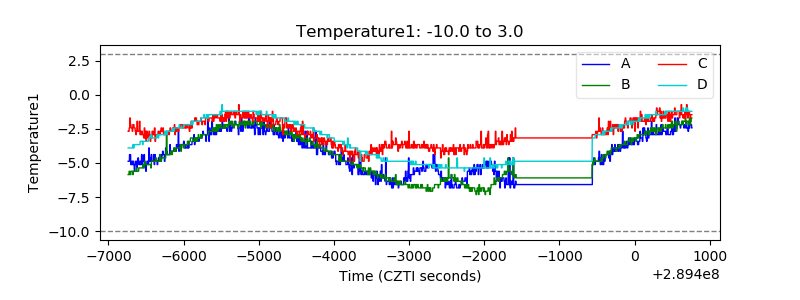 |
| Veto HV Monitor | 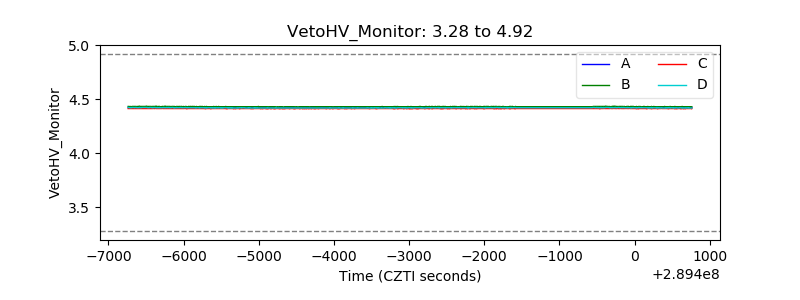 |
| Veto LLD | 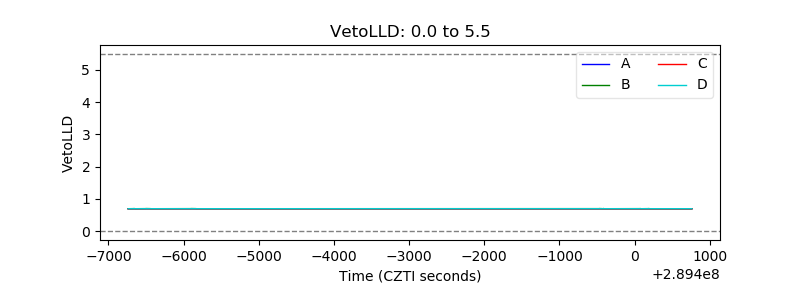 |
| Alpha Counter | 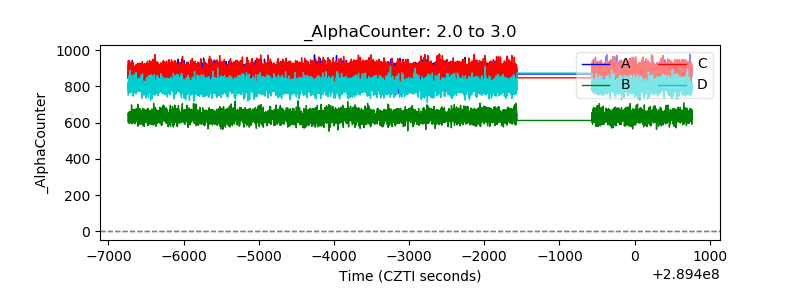 |
| _CPM_Rate | 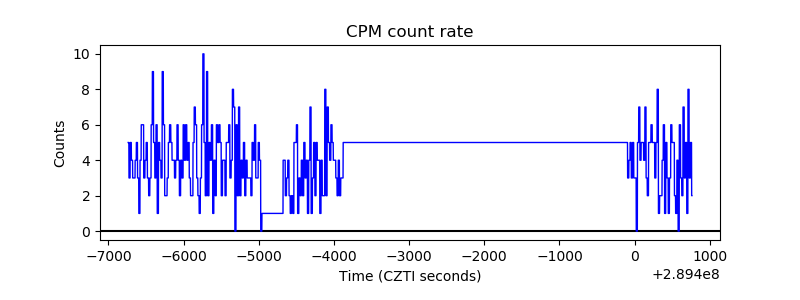 |
| CZT Counter | 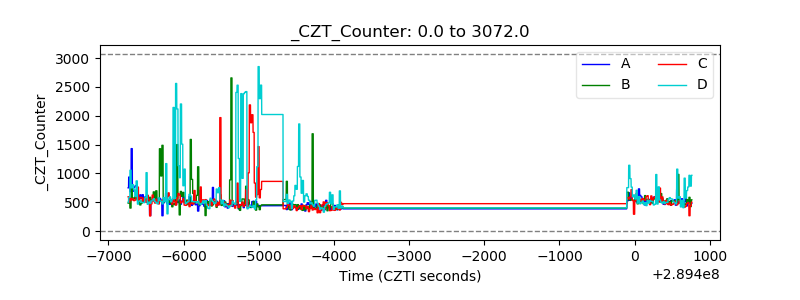 |
| +2.5 Volts monitor |  |
| +5 Volts monitor |  |
| _ROLL_ROT |  |
| _Roll_DEC | 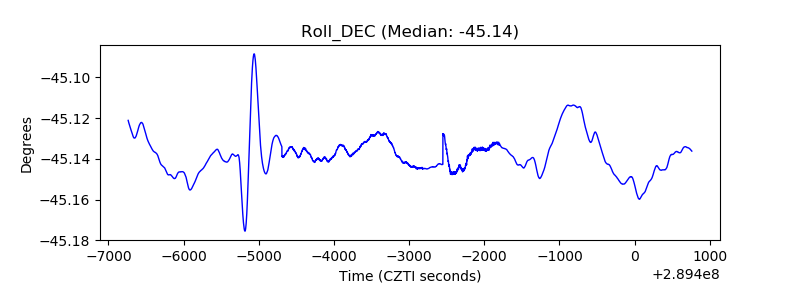 |
| _Roll_RA | 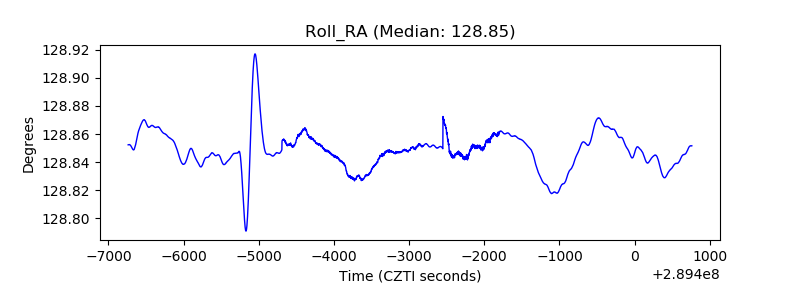 |
| Veto Counter | 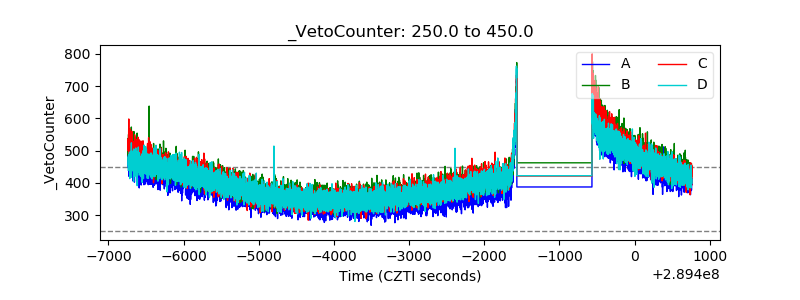 |