| Param | Original file | Final file |
|---|---|---|
| Filename | modeM0/AS1A05_188T01_9000002756_18554cztM0_level2.evt | modeM0/AS1A05_188T01_9000002756_18554cztM0_level2_quad_clean.evt |
| Size (bytes) | 506,856,960 | 101,142,720 |
| Size | 483.4 MB | 96.5 MB |
| Events in quadrant A | 2,965,588 | 690,644 |
| Events in quadrant B | 3,239,203 | 707,037 |
| Events in quadrant C | 2,896,710 | 650,475 |
| Events in quadrant D | 5,842,199 | 596,081 |
| Mode SS | |||
|---|---|---|---|
| Quadrant | BADHDUFLAG | Total packets | Discarded packets |
| A | 0 | 124 | 0 |
| B | 0 | 124 | 0 |
| C | 0 | 124 | 0 |
| D | 0 | 124 | 0 |
| Mode M9 | |||
|---|---|---|---|
| Quadrant | BADHDUFLAG | Total packets | Discarded packets |
| A | 0 | 12 | 0 |
| B | 0 | 12 | 0 |
| C | 0 | 12 | 0 |
| D | 0 | 12 | 0 |
| Mode M0 | |||
|---|---|---|---|
| Quadrant | BADHDUFLAG | Total packets | Discarded packets |
| A | 0 | 12767 | 1 |
| B | 0 | 13519 | 1 |
| C | 0 | 12556 | 1 |
| D | 0 | 21333 | 1 |
| Quadrant | Total seconds | Saturated seconds | Saturation percentage |
|---|---|---|---|
| A | 5985 | 63 | 1.052632% |
| B | 5985 | 89 | 1.487051% |
| C | 5986 | 74 | 1.236218% |
| D | 5986 | 795 | 13.280989% |
Noise dominated data is calculated using 1-second bins in cleaned event files. If a bin has >2000 counts, and if more than 50% of those come from <1% of pixels, then it is considered to be noise-dominated and hence unusable.
| Quadrant | # 1 sec bins | Bins with >0 counts | Bins with >2000 counts | High rate bins dominated by noise | Noise dominated (total time) | Noise dominated (detector-on time) | Marked lightcurve |
|---|---|---|---|---|---|---|---|
| A | 7220 | 5985 | 5 | 5 | 0.07% | 0.08% | 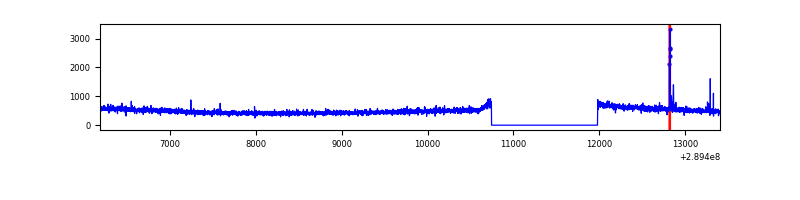 |
| B | 7220 | 5985 | 25 | 25 | 0.35% | 0.42% | 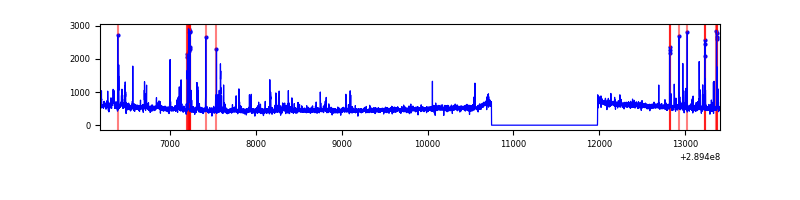 |
| C | 7221 | 5986 | 0 | 0 | 0.00% | 0.00% | 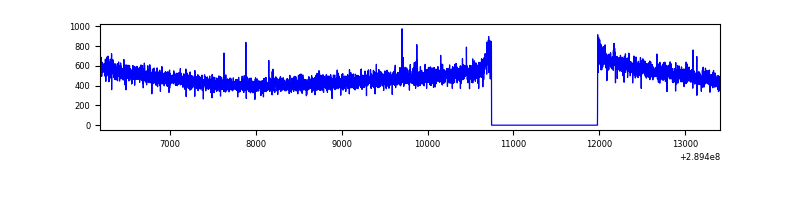 |
| D | 7221 | 5986 | 786 | 786 | 10.88% | 13.13% | 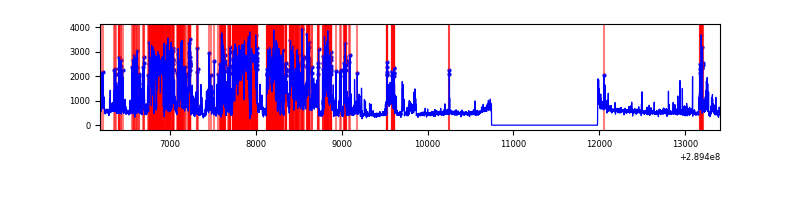 |
Top three noisy pixels from each quadrant. If the there are fewer than three noisy pixels in the level2.evt file, extra rows are filled as -1
| Pixel properties | Quadrant properties | ||||||
|---|---|---|---|---|---|---|---|
| Quadrant | DetID | PixID | Counts | Sigma | Mean | Median | Sigma |
| A | 0 | 13 | 28456 | 180.97 | 759 | 745 | 153.1 |
| A | 13 | 254 | 11627 | 71.06 | 759 | 745 | 153.1 |
| A | 14 | 111 | 8791 | 52.54 | 759 | 745 | 153.1 |
| B | 3 | 64 | 215580 | 1496.01 | 759 | 741 | 143.6 |
| B | 0 | 190 | 22772 | 153.41 | 759 | 741 | 143.6 |
| B | 12 | 111 | 16270 | 108.13 | 759 | 741 | 143.6 |
| C | 14 | 238 | 114377 | 687.16 | 710 | 716 | 165.4 |
| C | 3 | 233 | 8736 | 48.49 | 710 | 716 | 165.4 |
| C | 9 | 54 | 5834 | 30.94 | 710 | 716 | 165.4 |
| D | 7 | 238 | 2265481 | 13399.51 | 692 | 671 | 169.0 |
| D | 10 | 50 | 808905 | 4781.83 | 692 | 671 | 169.0 |
| D | 1 | 52 | 87239 | 512.17 | 692 | 671 | 169.0 |
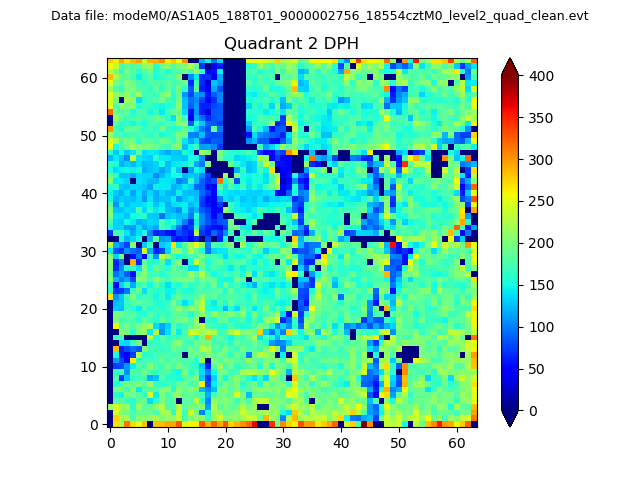
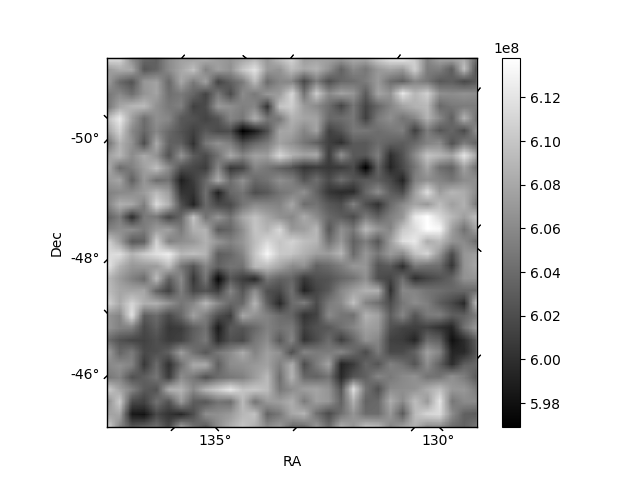
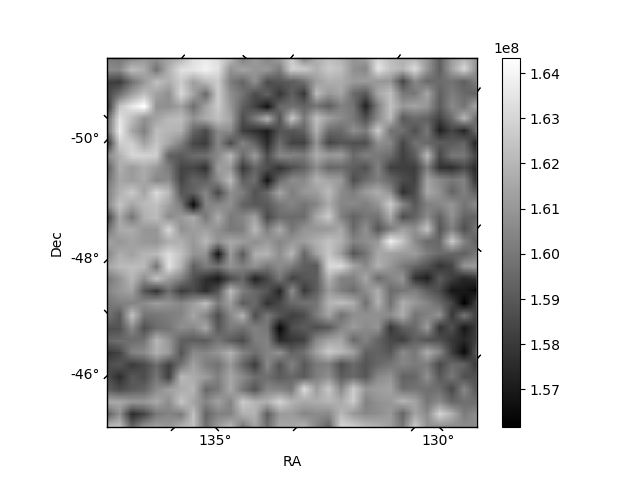
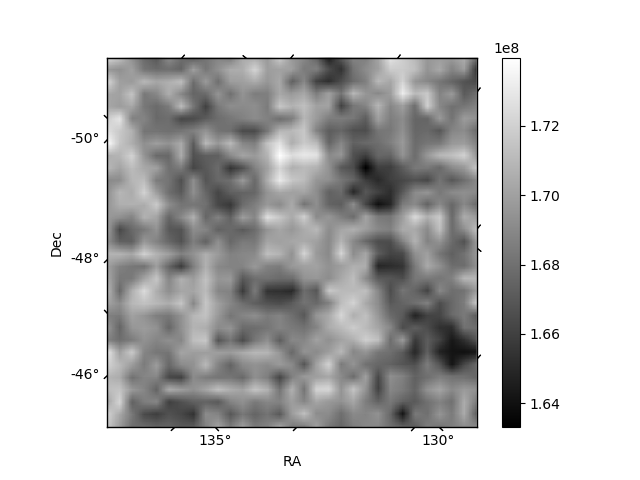
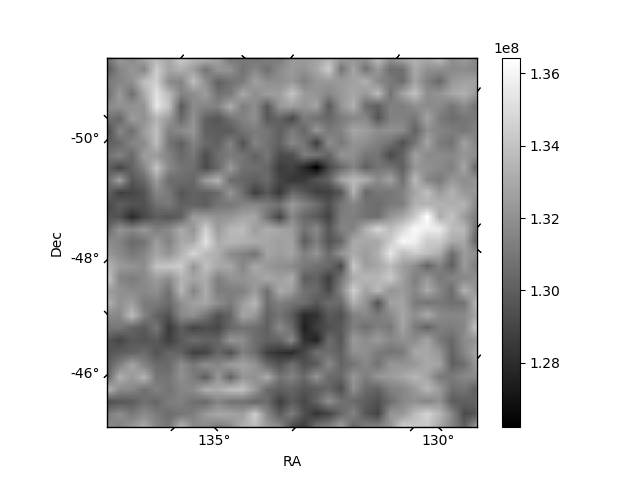
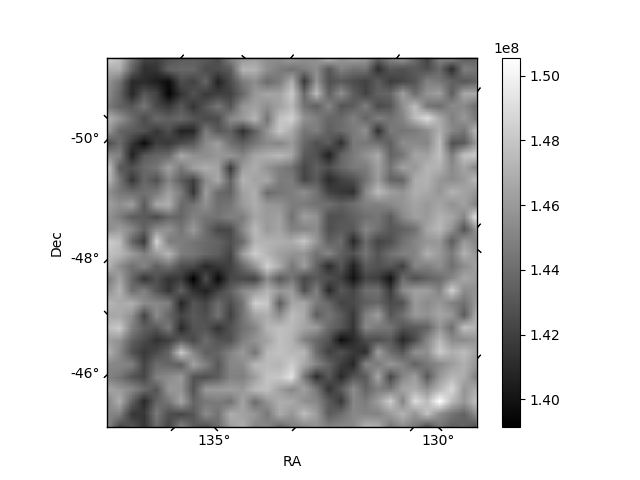
Histogram calculated using DETX and DETY for each event in the final _common_clean file
| Quadrant A | 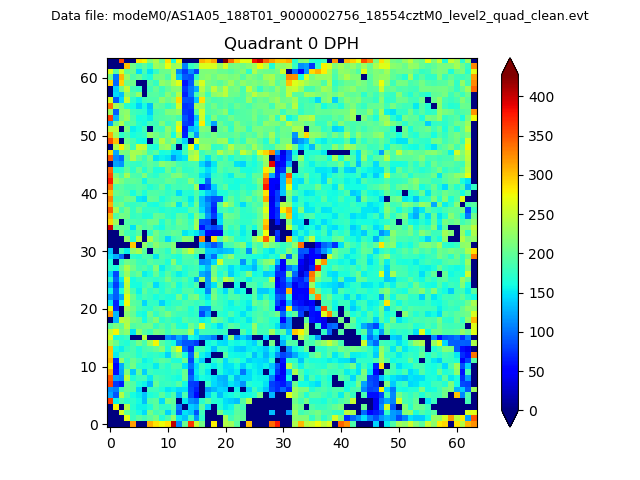 |
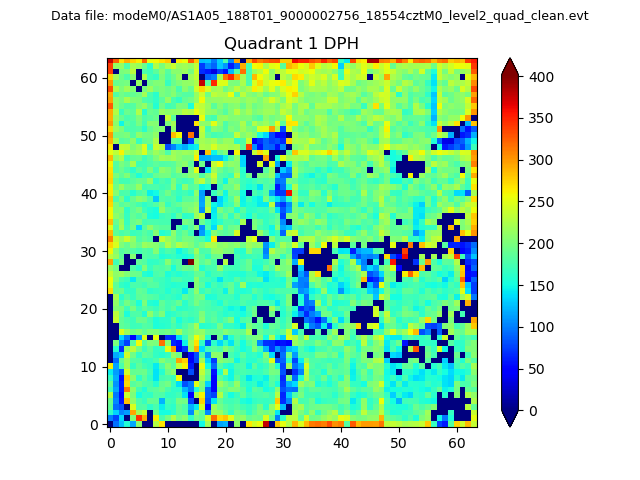 |
Quadrant B |
|---|---|---|---|
| Quadrant D | 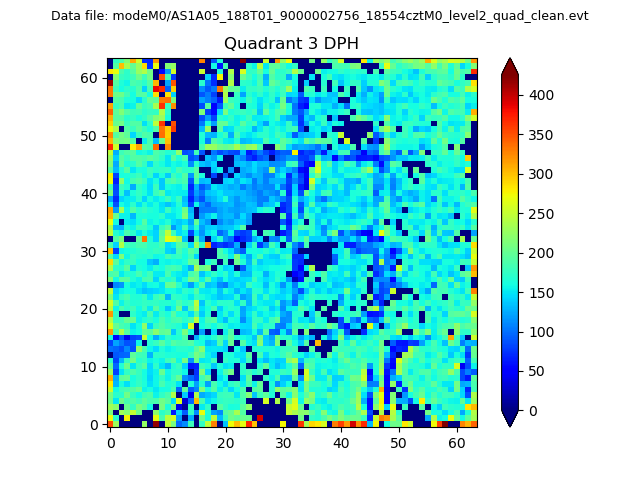 |
 |
Quadrant C |
| Plot type | Count rate plots | Images |
|---|---|---|
| Comparison with Poisson distribution Blue bars denote a histogram of data divided into 1 sec bins. Red curve is a Poisson curve with rate = median count rate of data. |
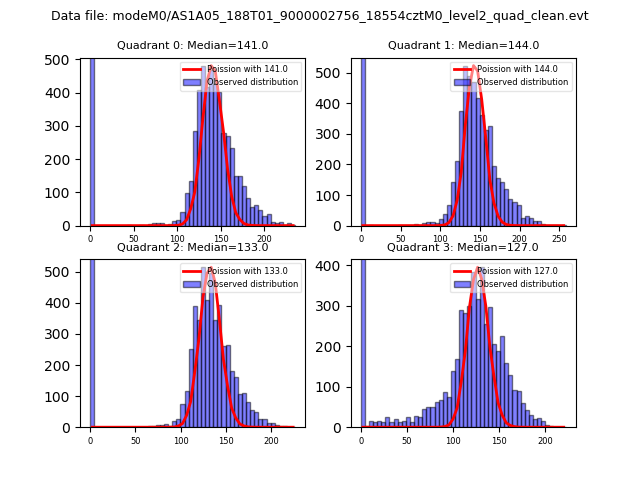 |
 |
| Quadrant-wise count rates Data is divided into 100 sec bins |
 |
|
| Module-wise count rates for Quadrant A Data is divided into 100 sec bins |
 |
 |
| Module-wise count rates for Quadrant B Data is divided into 100 sec bins |
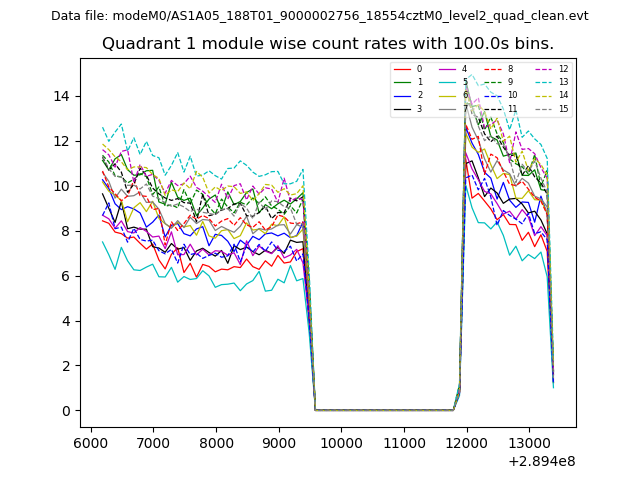 |
 |
| Module-wise count rates for Quadrant C Data is divided into 100 sec bins |
 |
 |
| Module-wise count rates for Quadrant D Data is divided into 100 sec bins |
 |
 |
| Parameter | Plot |
|---|---|
| CZT HV Monitor |  |
| D_VDD | 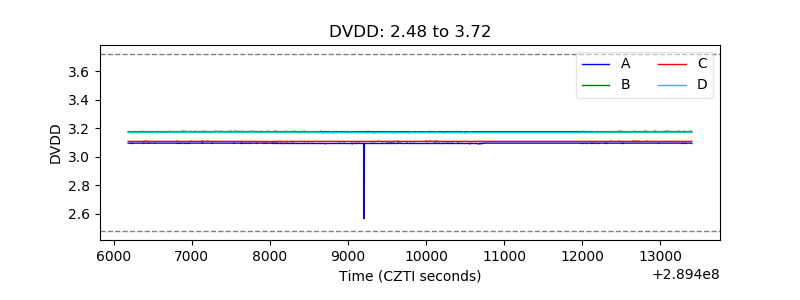 |
| Temperature 1 | 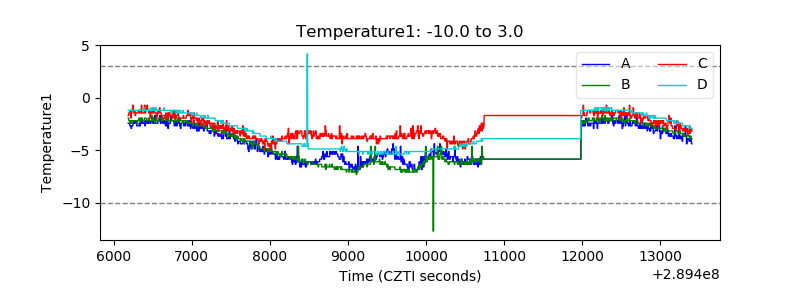 |
| Veto HV Monitor | 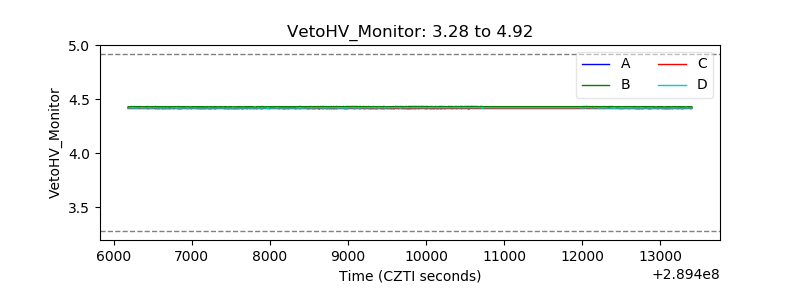 |
| Veto LLD | 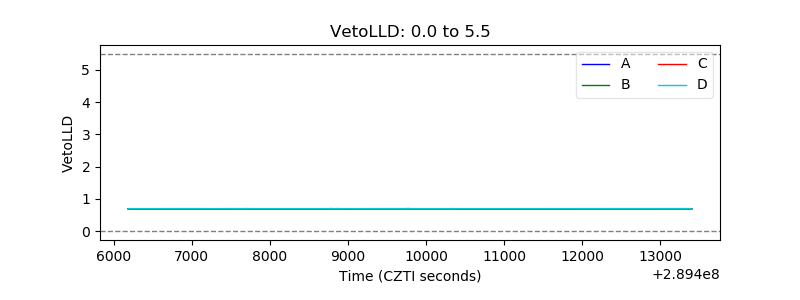 |
| Alpha Counter | 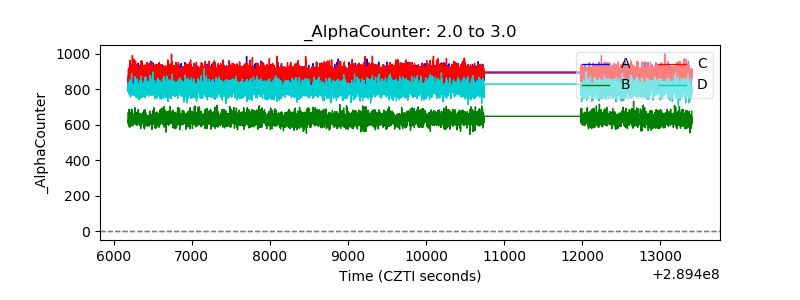 |
| _CPM_Rate |  |
| CZT Counter | 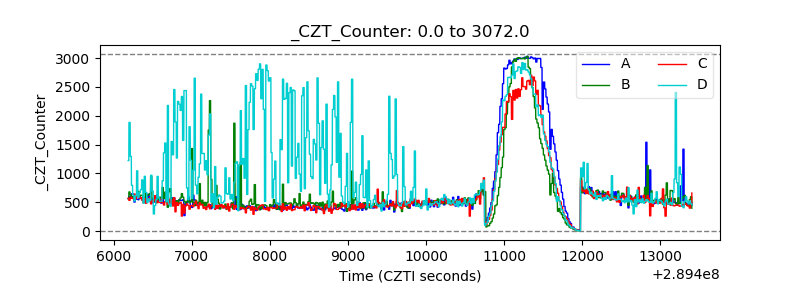 |
| +2.5 Volts monitor |  |
| +5 Volts monitor | 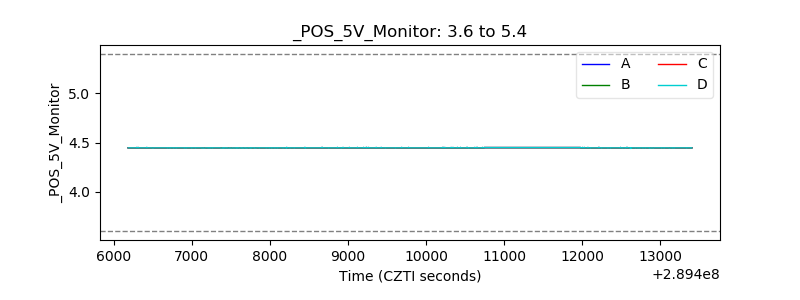 |
| _ROLL_ROT |  |
| _Roll_DEC | 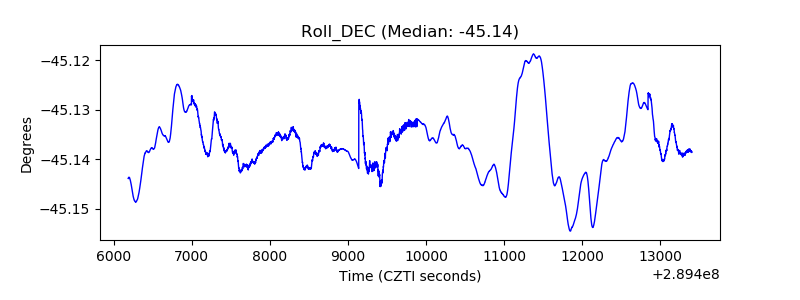 |
| _Roll_RA | 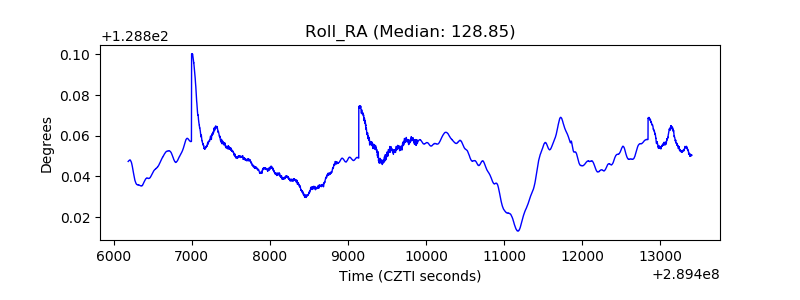 |
| Veto Counter | 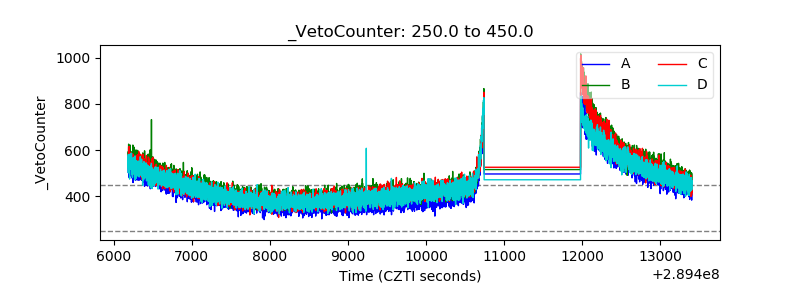 |