| Param | Original file | Final file |
|---|---|---|
| Filename | modeM0/AS1A05_188T01_9000002756_18556cztM0_level2.evt | modeM0/AS1A05_188T01_9000002756_18556cztM0_level2_quad_clean.evt |
| Size (bytes) | 450,417,600 | 99,904,320 |
| Size | 429.6 MB | 95.3 MB |
| Events in quadrant A | 3,110,823 | 663,792 |
| Events in quadrant B | 3,357,444 | 690,113 |
| Events in quadrant C | 3,080,186 | 631,589 |
| Events in quadrant D | 3,673,560 | 609,630 |
| Mode SS | |||
|---|---|---|---|
| Quadrant | BADHDUFLAG | Total packets | Discarded packets |
| A | 0 | 124 | 0 |
| B | 0 | 124 | 0 |
| C | 0 | 124 | 0 |
| D | 0 | 124 | 0 |
| Mode M9 | |||
|---|---|---|---|
| Quadrant | BADHDUFLAG | Total packets | Discarded packets |
| A | 0 | 15 | 0 |
| B | 0 | 16 | 0 |
| C | 0 | 16 | 0 |
| D | 0 | 16 | 0 |
| Mode M0 | |||
|---|---|---|---|
| Quadrant | BADHDUFLAG | Total packets | Discarded packets |
| A | 0 | 13213 | 2 |
| B | 0 | 13812 | 2 |
| C | 0 | 13028 | 2 |
| D | 0 | 15239 | 7 |
| Quadrant | Total seconds | Saturated seconds | Saturation percentage |
|---|---|---|---|
| A | 6174 | 36 | 0.583090% |
| B | 6174 | 62 | 1.004211% |
| C | 6174 | 53 | 0.858439% |
| D | 6173 | 141 | 2.284141% |
Noise dominated data is calculated using 1-second bins in cleaned event files. If a bin has >2000 counts, and if more than 50% of those come from <1% of pixels, then it is considered to be noise-dominated and hence unusable.
| Quadrant | # 1 sec bins | Bins with >0 counts | Bins with >2000 counts | High rate bins dominated by noise | Noise dominated (total time) | Noise dominated (detector-on time) | Marked lightcurve |
|---|---|---|---|---|---|---|---|
| A | 7539 | 6175 | 0 | 0 | 0.00% | 0.00% | 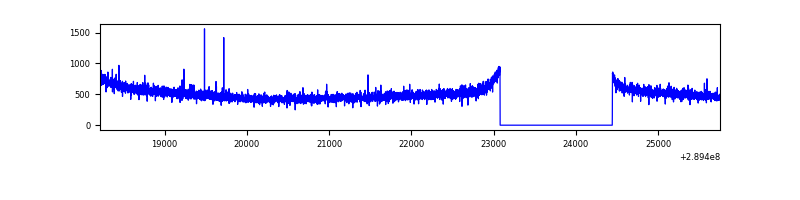 |
| B | 7539 | 6175 | 18 | 18 | 0.24% | 0.29% | 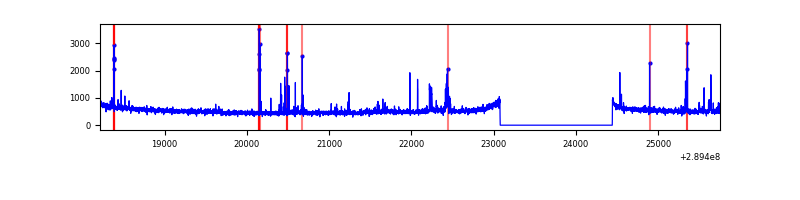 |
| C | 7539 | 6175 | 0 | 0 | 0.00% | 0.00% | 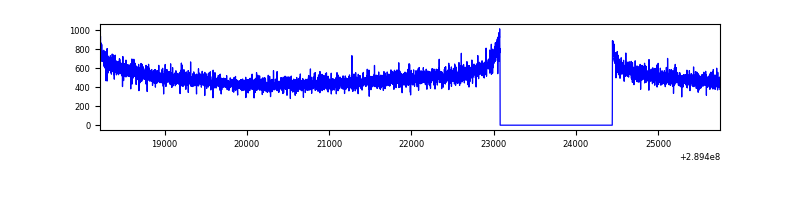 |
| D | 7538 | 6174 | 109 | 109 | 1.45% | 1.77% | 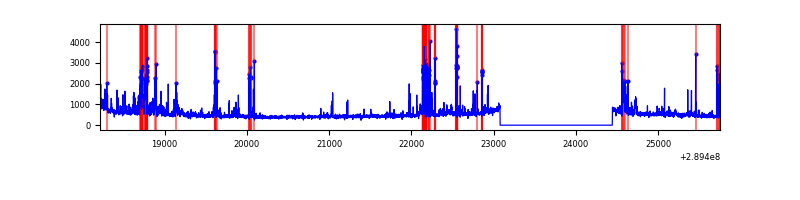 |
Top three noisy pixels from each quadrant. If the there are fewer than three noisy pixels in the level2.evt file, extra rows are filled as -1
| Pixel properties | Quadrant properties | ||||||
|---|---|---|---|---|---|---|---|
| Quadrant | DetID | PixID | Counts | Sigma | Mean | Median | Sigma |
| A | 13 | 254 | 11262 | 65.21 | 804 | 791 | 160.6 |
| A | 0 | 226 | 6910 | 38.1 | 804 | 791 | 160.6 |
| A | 3 | 137 | 5821 | 31.32 | 804 | 791 | 160.6 |
| B | 3 | 64 | 75047 | 486.32 | 811 | 793 | 152.7 |
| B | 15 | 222 | 73151 | 473.91 | 811 | 793 | 152.7 |
| B | 4 | 80 | 22203 | 140.22 | 811 | 793 | 152.7 |
| C | 14 | 238 | 120997 | 678.71 | 759 | 763 | 177.2 |
| C | 13 | 61 | 5450 | 26.45 | 759 | 763 | 177.2 |
| C | 3 | 233 | 2117 | 7.64 | 759 | 763 | 177.2 |
| D | 7 | 238 | 536459 | 2936.45 | 756 | 735 | 182.4 |
| D | 1 | 52 | 214585 | 1172.17 | 756 | 735 | 182.4 |
| D | 7 | 38 | 30512 | 163.22 | 756 | 735 | 182.4 |
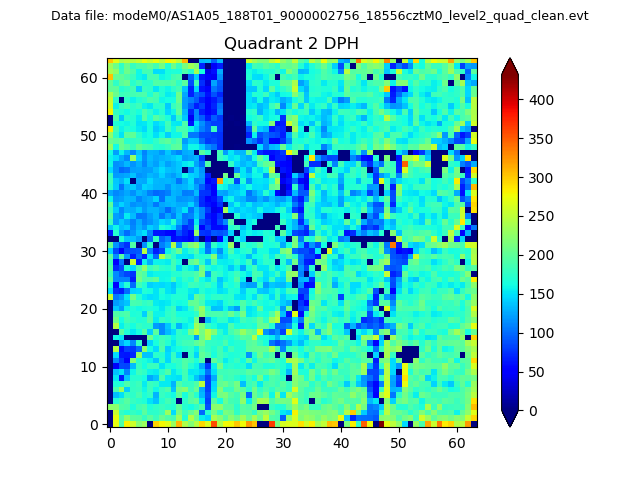
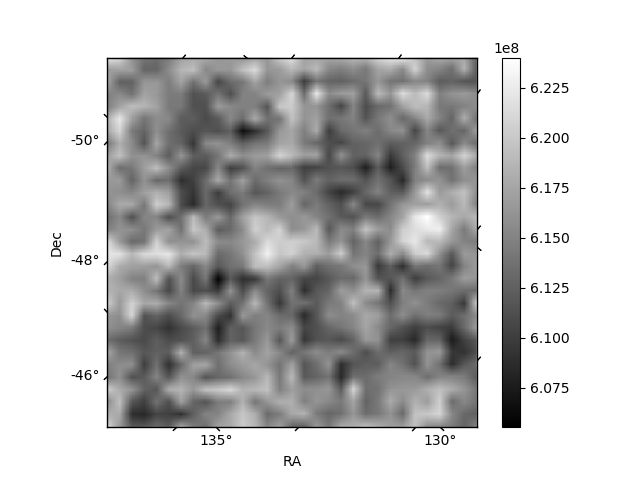
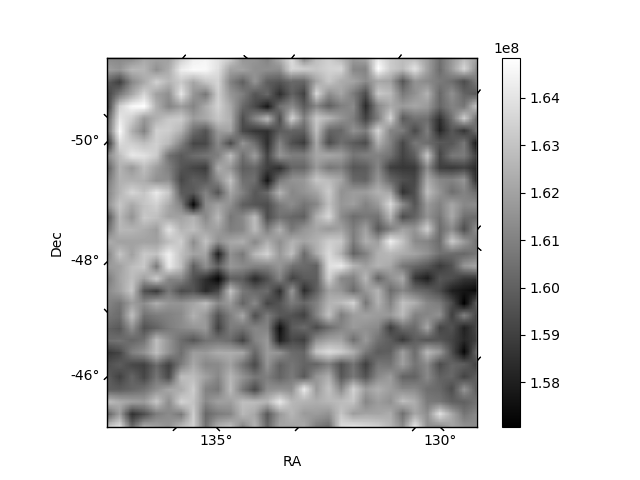
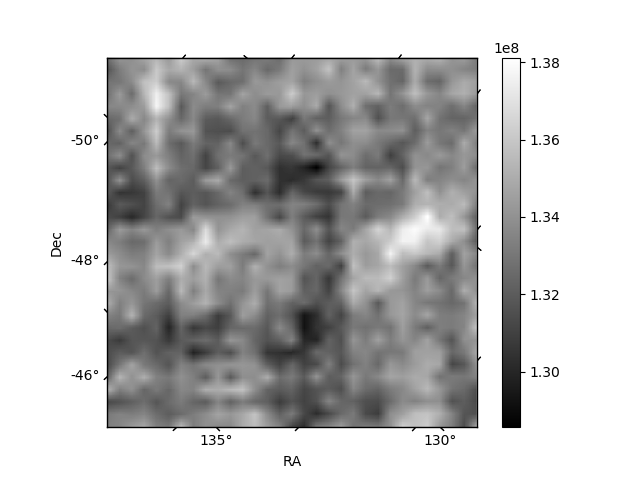
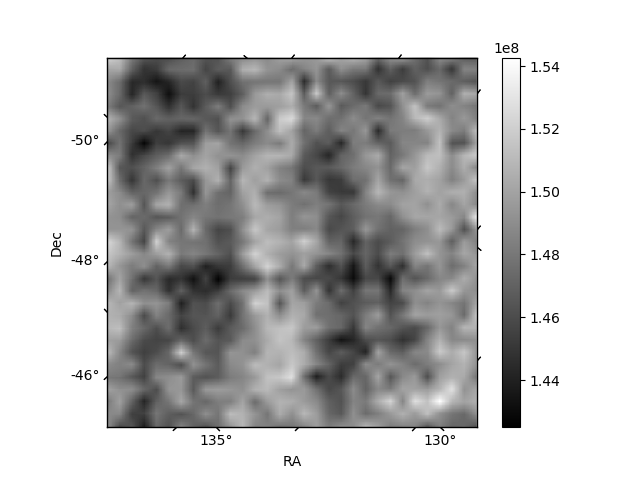
Histogram calculated using DETX and DETY for each event in the final _common_clean file
| Quadrant A | 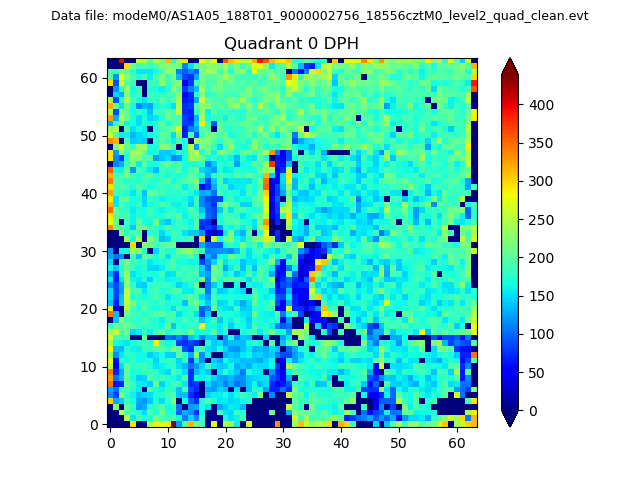 |
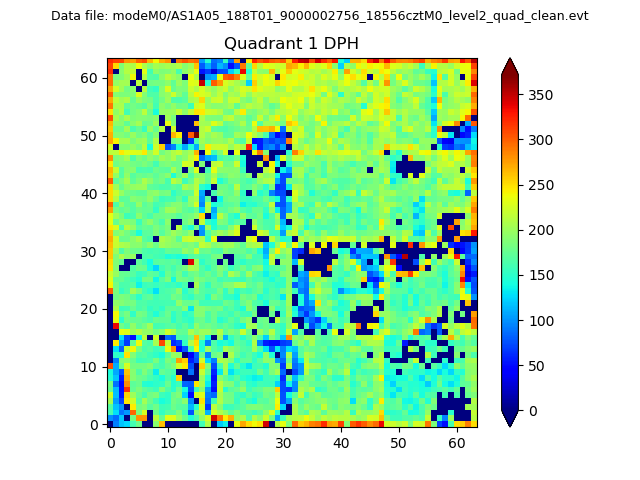 |
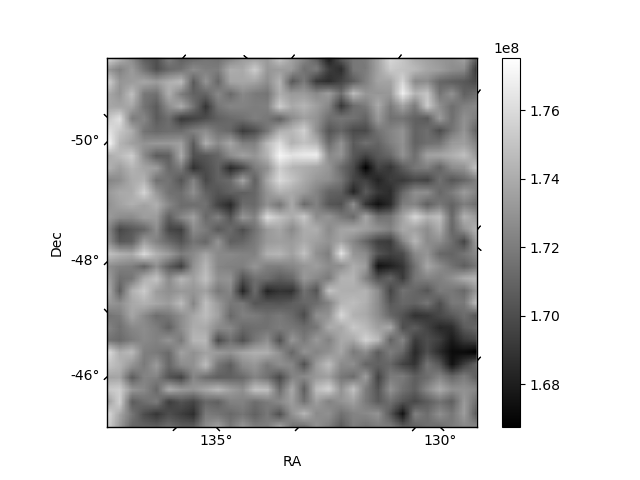
Quadrant B |
|---|---|---|---|
| Quadrant D | 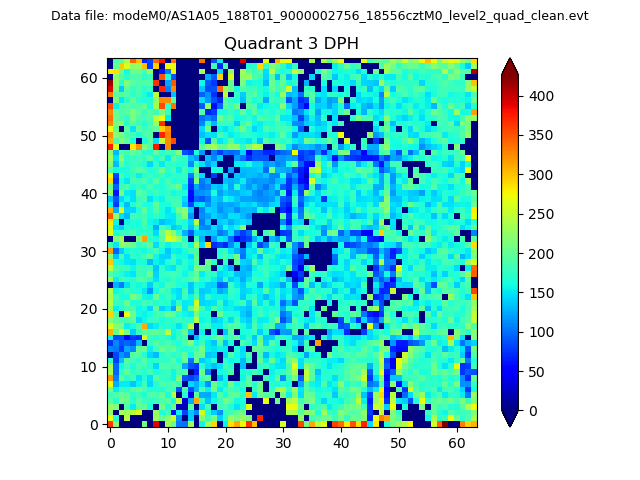 |
 |
Quadrant C |
| Plot type | Count rate plots | Images |
|---|---|---|
| Comparison with Poisson distribution Blue bars denote a histogram of data divided into 1 sec bins. Red curve is a Poisson curve with rate = median count rate of data. |
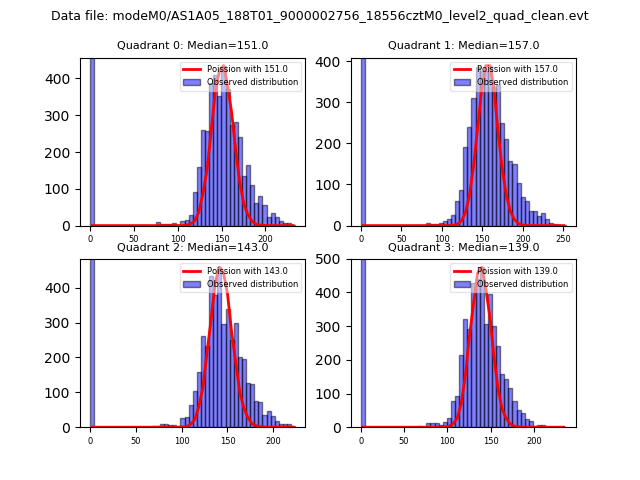 |
 |
| Quadrant-wise count rates Data is divided into 100 sec bins |
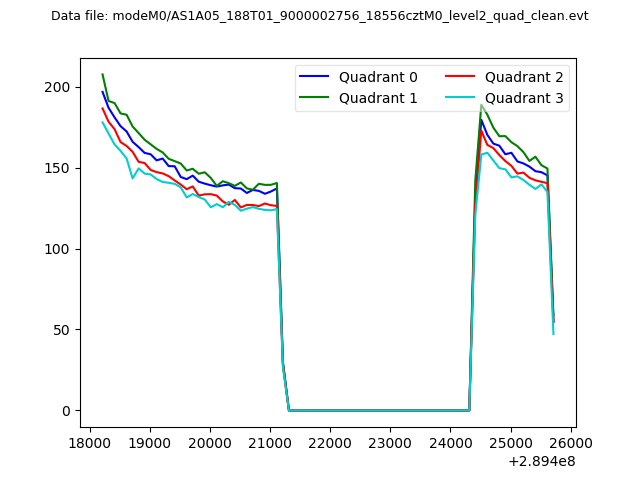 |
|
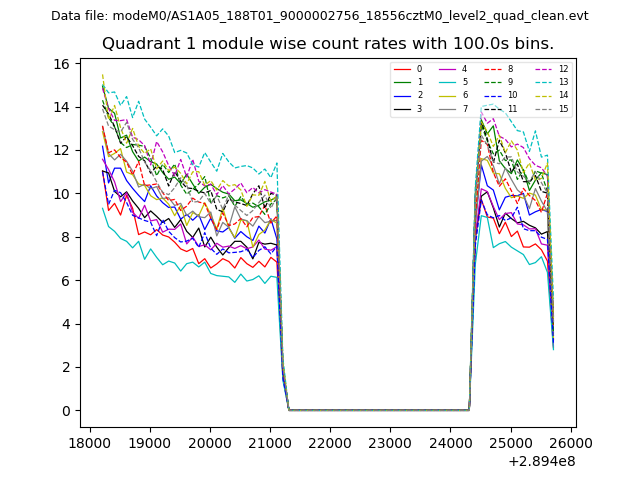
| Module-wise count rates for Quadrant A Data is divided into 100 sec bins |
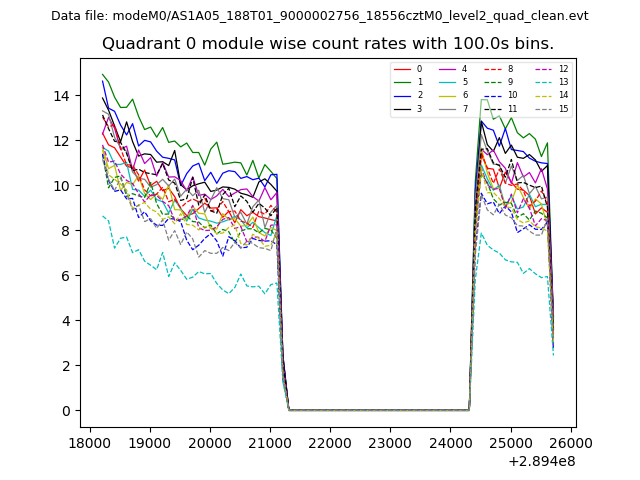 |
 |
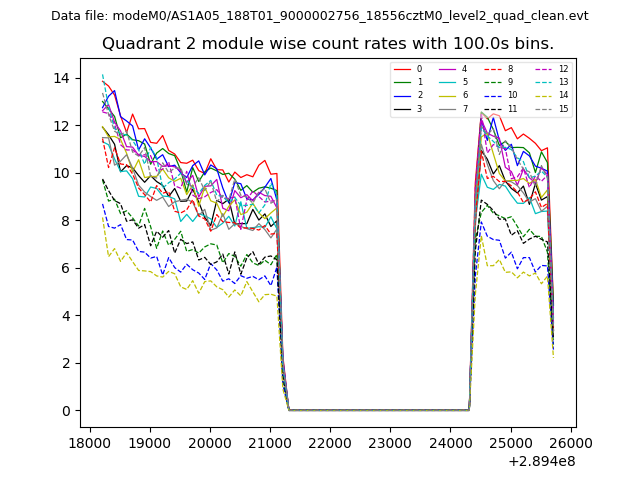
| Module-wise count rates for Quadrant B Data is divided into 100 sec bins |
 |
 |
| Module-wise count rates for Quadrant C Data is divided into 100 sec bins |
 |
 |
| Module-wise count rates for Quadrant D Data is divided into 100 sec bins |
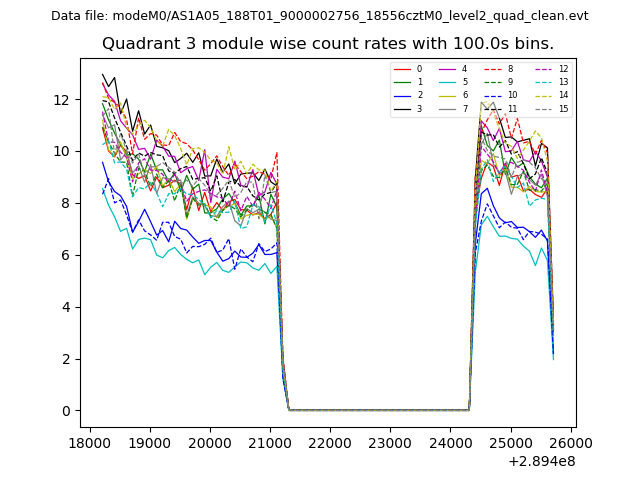 |
 |
| Parameter | Plot |
|---|---|
| CZT HV Monitor | 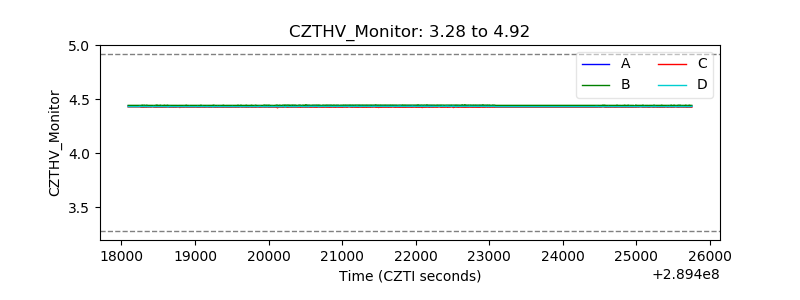 |
| D_VDD | 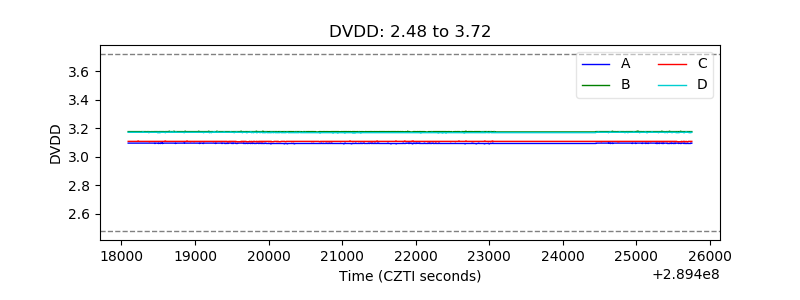 |
| Temperature 1 | 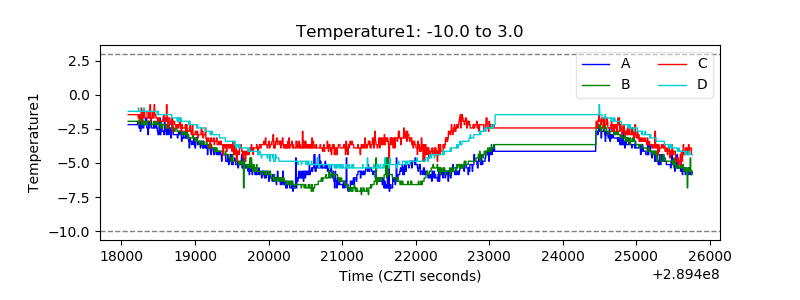 |
| Veto HV Monitor | 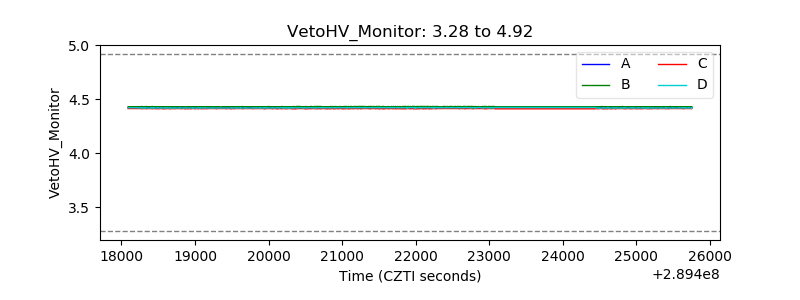 |
| Veto LLD | 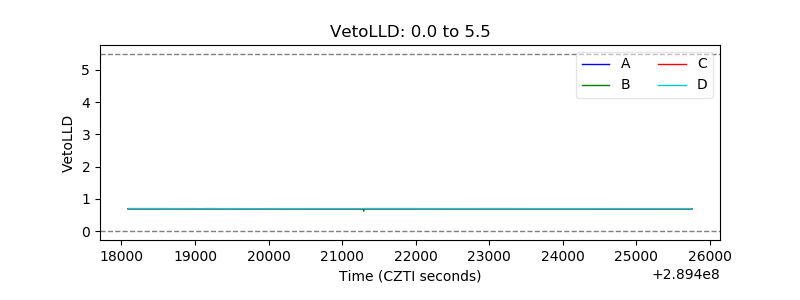 |
| Alpha Counter | 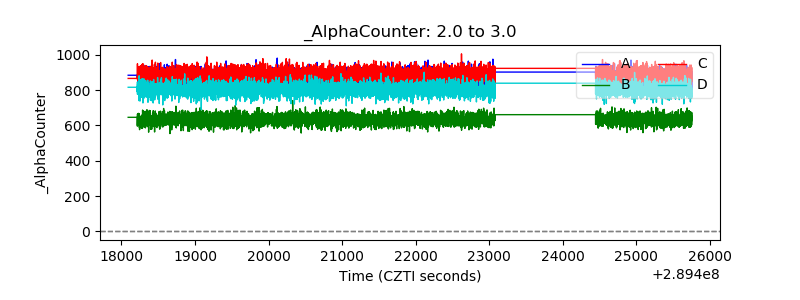 |
| _CPM_Rate | 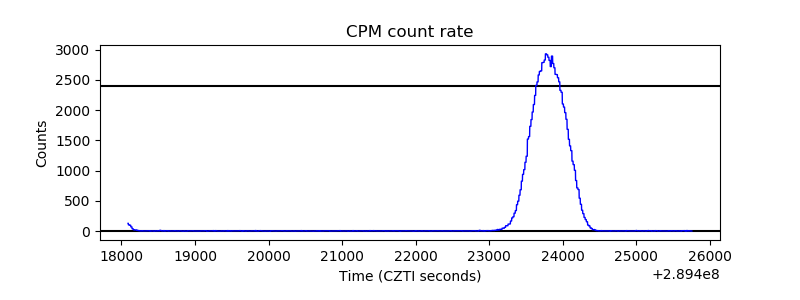 |
| CZT Counter | 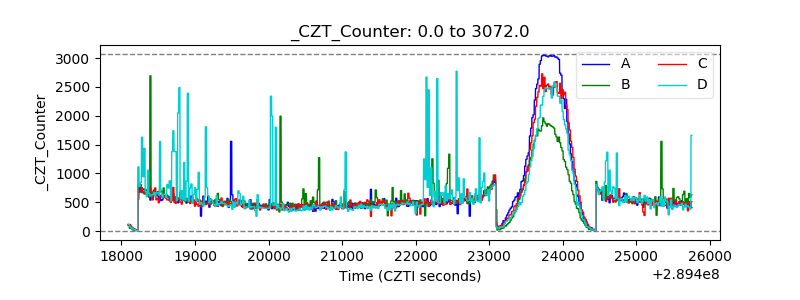 |
| +2.5 Volts monitor |  |
| +5 Volts monitor | 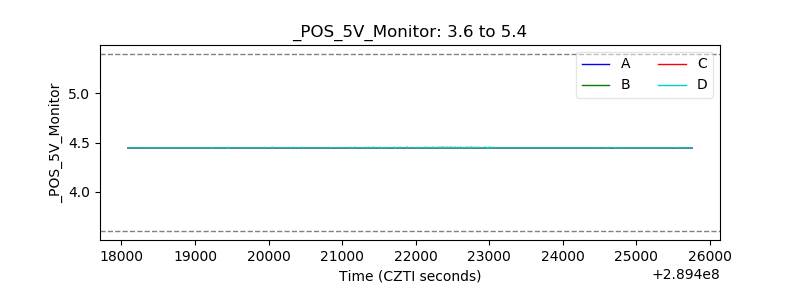 |
| _ROLL_ROT | 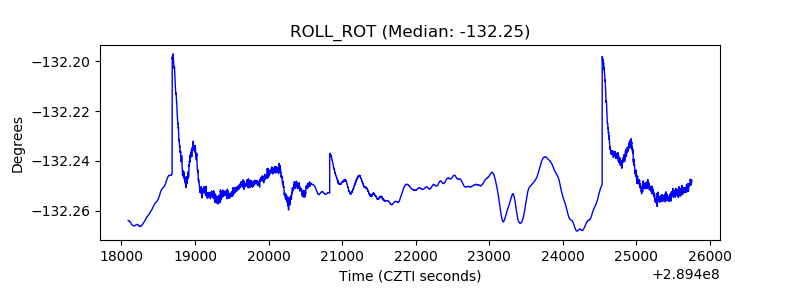 |
| _Roll_DEC | 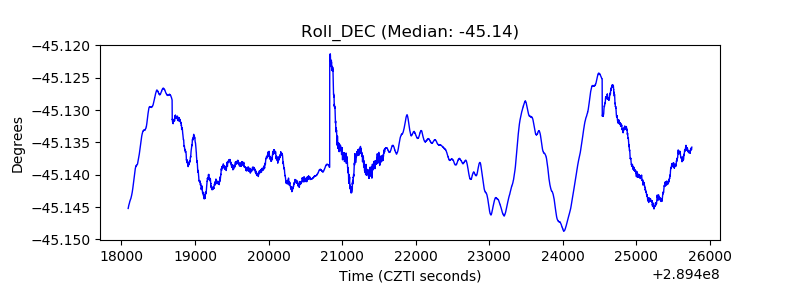 |
| _Roll_RA | 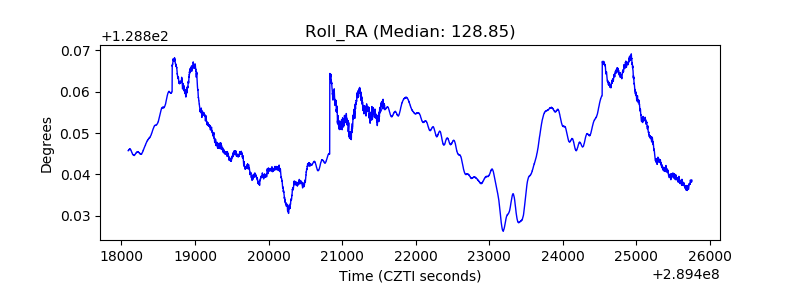 |
| Veto Counter | 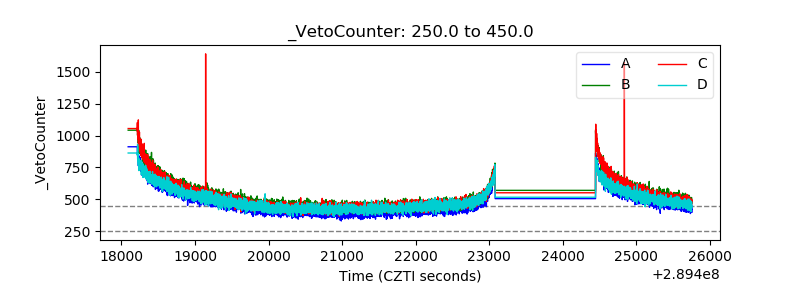 |