| Param | Original file | Final file |
|---|---|---|
| Filename | modeM0/AS1A05_188T01_9000002756_18557cztM0_level2.evt | modeM0/AS1A05_188T01_9000002756_18557cztM0_level2_quad_clean.evt |
| Size (bytes) | 600,886,080 | 93,476,160 |
| Size | 573.0 MB | 89.1 MB |
| Events in quadrant A | 3,445,478 | 624,820 |
| Events in quadrant B | 3,238,111 | 664,282 |
| Events in quadrant C | 3,202,321 | 612,318 |
| Events in quadrant D | 7,887,545 | 492,011 |
| Mode SS | |||
|---|---|---|---|
| Quadrant | BADHDUFLAG | Total packets | Discarded packets |
| A | 0 | 128 | 0 |
| B | 0 | 128 | 0 |
| C | 0 | 128 | 0 |
| D | 0 | 128 | 0 |
| Mode M9 | |||
|---|---|---|---|
| Quadrant | BADHDUFLAG | Total packets | Discarded packets |
| A | 0 | 21 | 0 |
| B | 0 | 22 | 0 |
| C | 0 | 22 | 0 |
| D | 0 | 22 | 0 |
| Mode M0 | |||
|---|---|---|---|
| Quadrant | BADHDUFLAG | Total packets | Discarded packets |
| A | 0 | 14278 | 2 |
| B | 0 | 13479 | 2 |
| C | 0 | 13461 | 2 |
| D | 0 | 27660 | 2 |
| Quadrant | Total seconds | Saturated seconds | Saturation percentage |
|---|---|---|---|
| A | 6254 | 174 | 2.782219% |
| B | 6254 | 62 | 0.991366% |
| C | 6254 | 70 | 1.119284% |
| D | 6254 | 2021 | 32.315318% |
Noise dominated data is calculated using 1-second bins in cleaned event files. If a bin has >2000 counts, and if more than 50% of those come from <1% of pixels, then it is considered to be noise-dominated and hence unusable.
| Quadrant | # 1 sec bins | Bins with >0 counts | Bins with >2000 counts | High rate bins dominated by noise | Noise dominated (total time) | Noise dominated (detector-on time) | Marked lightcurve |
|---|---|---|---|---|---|---|---|
| A | 7579 | 6255 | 124 | 124 | 1.64% | 1.98% | 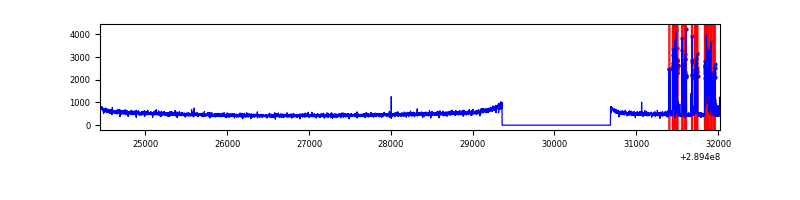 |
| B | 7579 | 6255 | 4 | 4 | 0.05% | 0.06% | 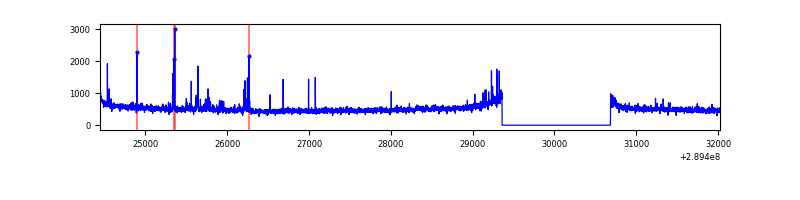 |
| C | 7579 | 6255 | 8 | 8 | 0.11% | 0.13% | 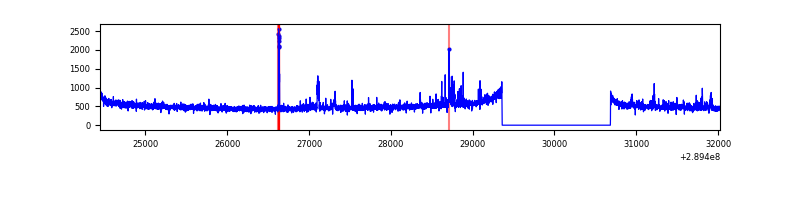 |
| D | 7579 | 6255 | 1958 | 1958 | 25.83% | 31.30% | 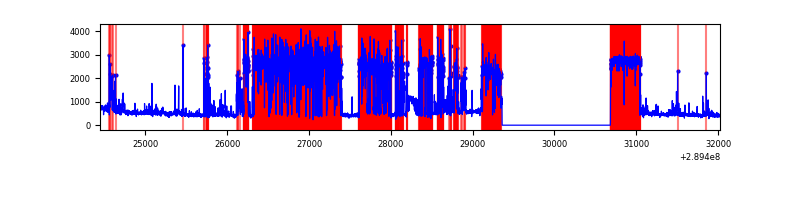 |
Top three noisy pixels from each quadrant. If the there are fewer than three noisy pixels in the level2.evt file, extra rows are filled as -1
| Pixel properties | Quadrant properties | ||||||
|---|---|---|---|---|---|---|---|
| Quadrant | DetID | PixID | Counts | Sigma | Mean | Median | Sigma |
| A | 0 | 13 | 422601 | 2693.19 | 783 | 770 | 156.6 |
| A | 13 | 254 | 11005 | 65.35 | 783 | 770 | 156.6 |
| A | 0 | 226 | 6668 | 37.66 | 783 | 770 | 156.6 |
| B | 3 | 64 | 44091 | 290.28 | 802 | 786 | 149.2 |
| B | 15 | 222 | 18963 | 121.84 | 802 | 786 | 149.2 |
| B | 0 | 183 | 18647 | 119.72 | 802 | 786 | 149.2 |
| C | 9 | 54 | 131411 | 744.45 | 756 | 761 | 175.5 |
| C | 14 | 238 | 119859 | 678.63 | 756 | 761 | 175.5 |
| C | 13 | 61 | 5386 | 26.35 | 756 | 761 | 175.5 |
| D | 1 | 52 | 5009374 | 31877.72 | 648 | 629 | 157.1 |
| D | 7 | 238 | 383134 | 2434.42 | 648 | 629 | 157.1 |
| D | 15 | 145 | 34010 | 212.45 | 648 | 629 | 157.1 |
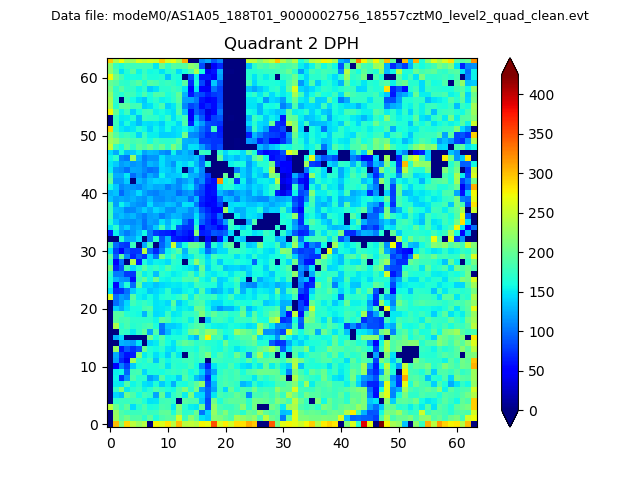
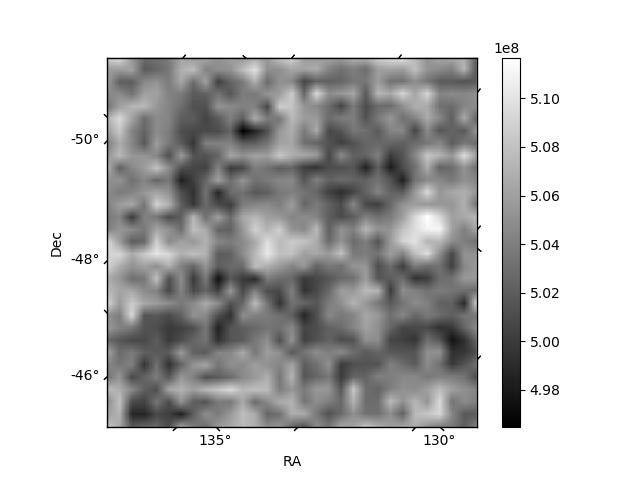
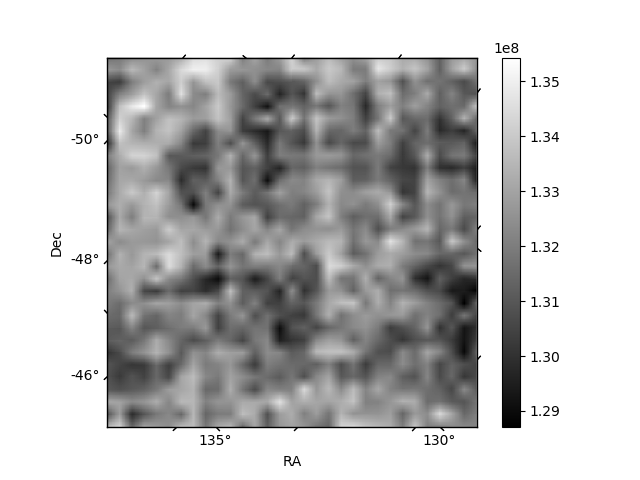
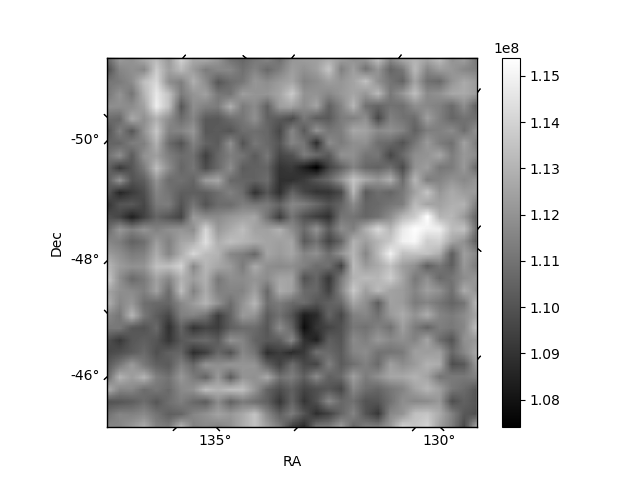
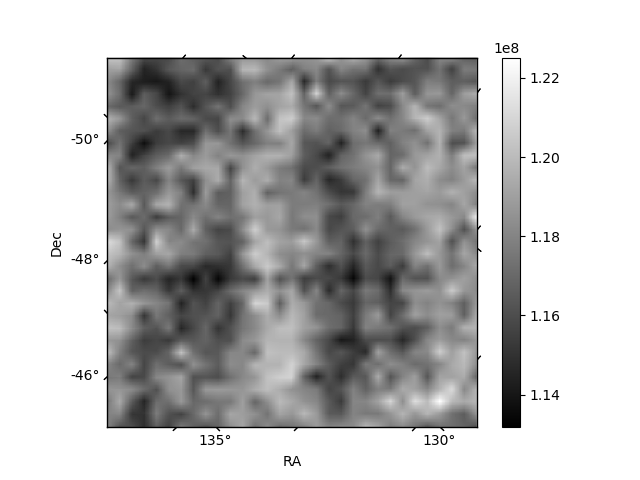
Histogram calculated using DETX and DETY for each event in the final _common_clean file
| Quadrant A | 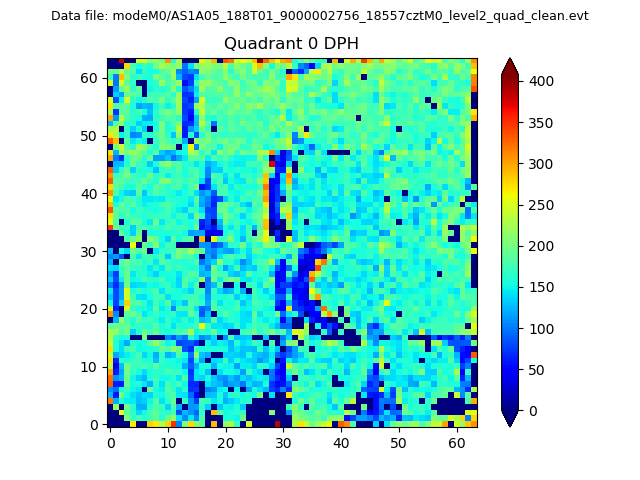 |
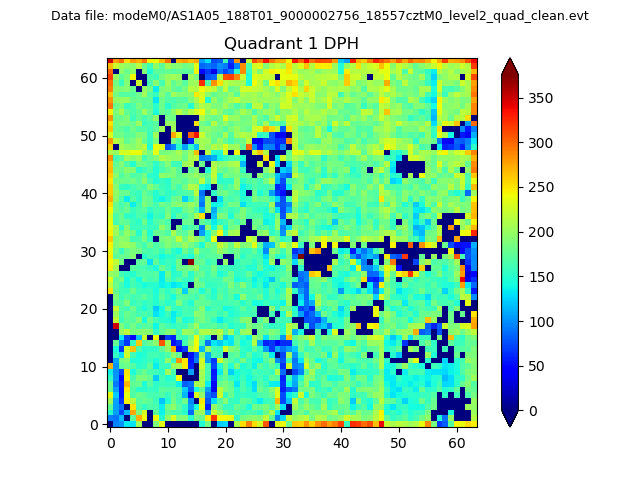 |
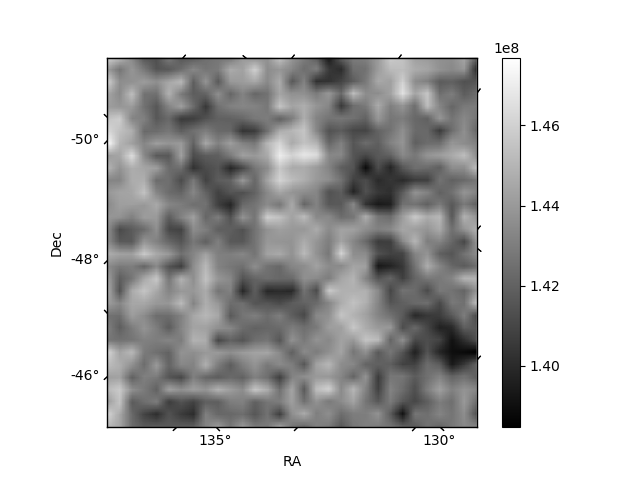
Quadrant B |
|---|---|---|---|
| Quadrant D | 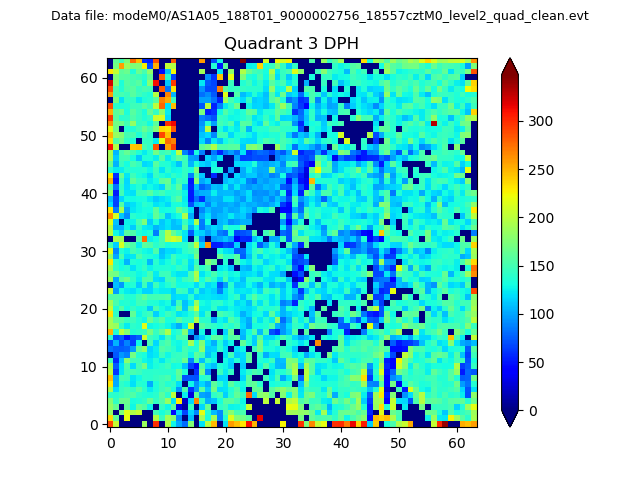 |
 |
Quadrant C |
| Plot type | Count rate plots | Images |
|---|---|---|
| Comparison with Poisson distribution Blue bars denote a histogram of data divided into 1 sec bins. Red curve is a Poisson curve with rate = median count rate of data. |
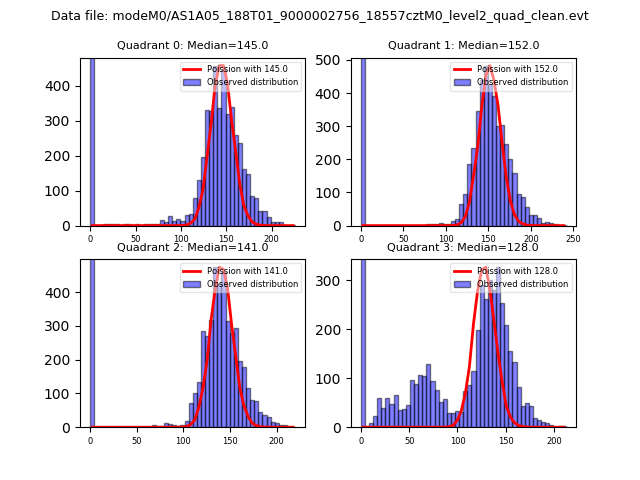 |
 |
| Quadrant-wise count rates Data is divided into 100 sec bins |
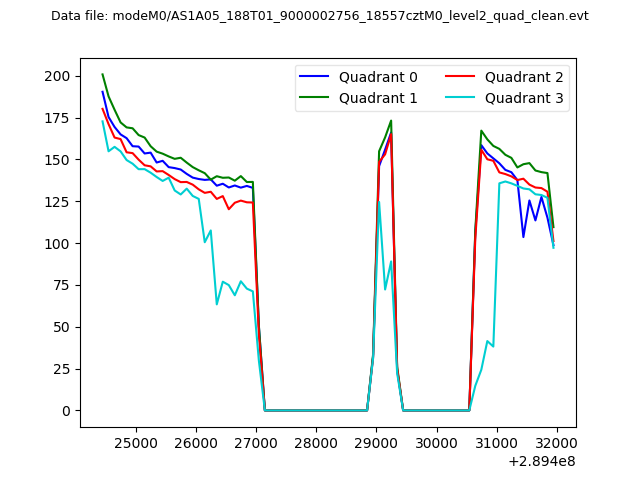 |
|
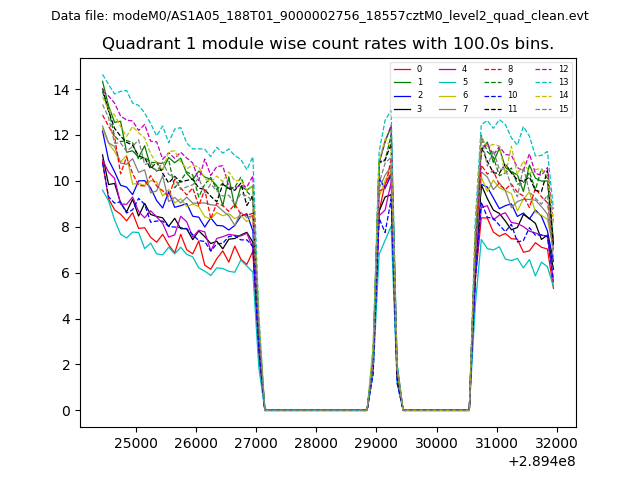
| Module-wise count rates for Quadrant A Data is divided into 100 sec bins |
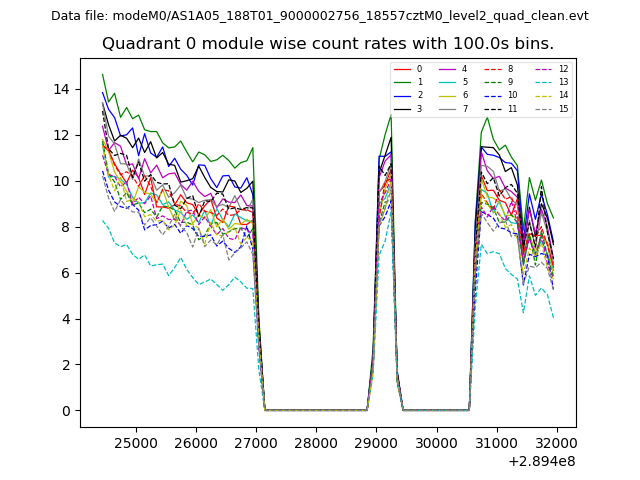 |
 |
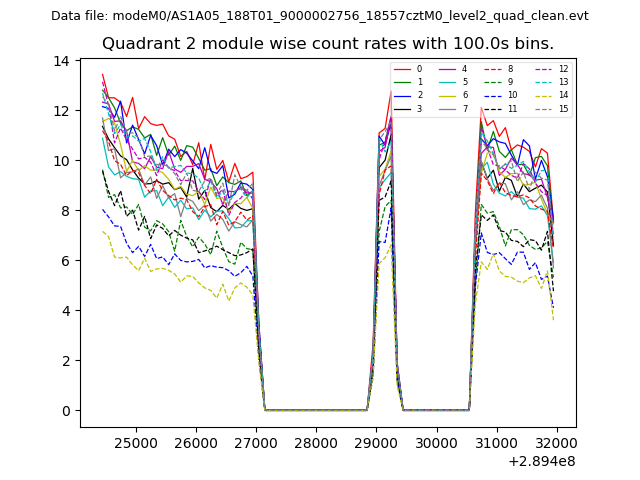
| Module-wise count rates for Quadrant B Data is divided into 100 sec bins |
 |
 |
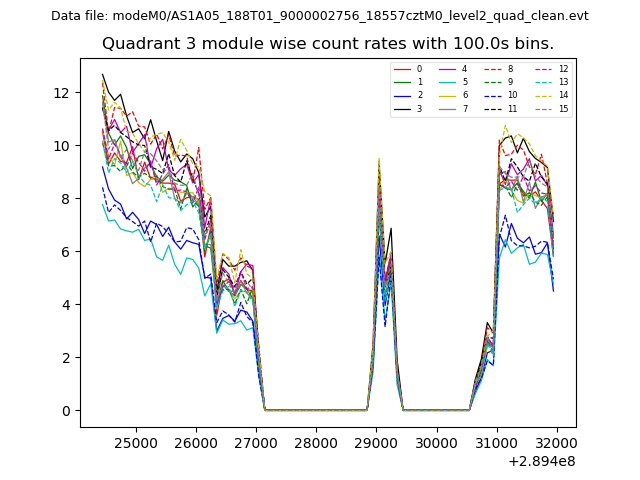
| Module-wise count rates for Quadrant C Data is divided into 100 sec bins |
 |
 |
| Module-wise count rates for Quadrant D Data is divided into 100 sec bins |
 |
 |
| Parameter | Plot |
|---|---|
| CZT HV Monitor | 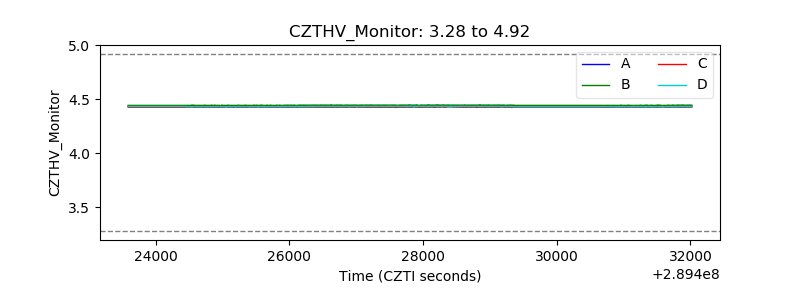 |
| D_VDD | 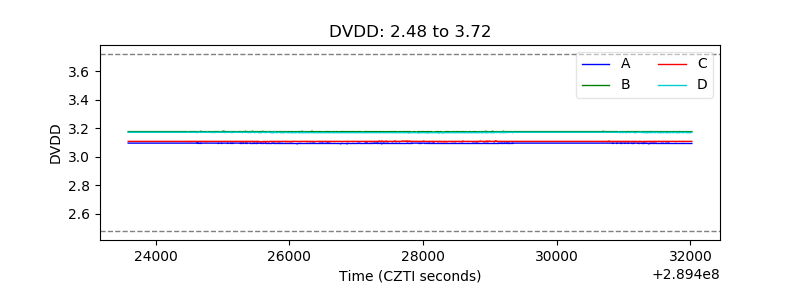 |
| Temperature 1 | 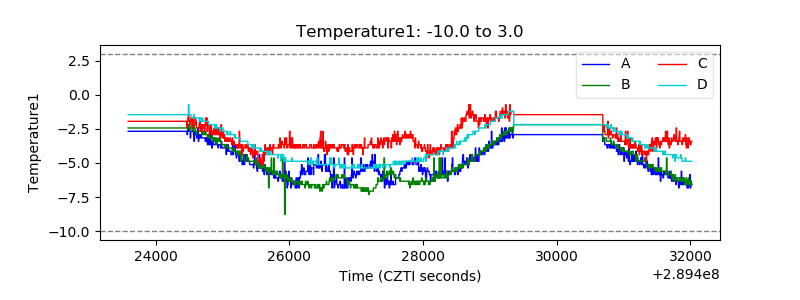 |
| Veto HV Monitor | 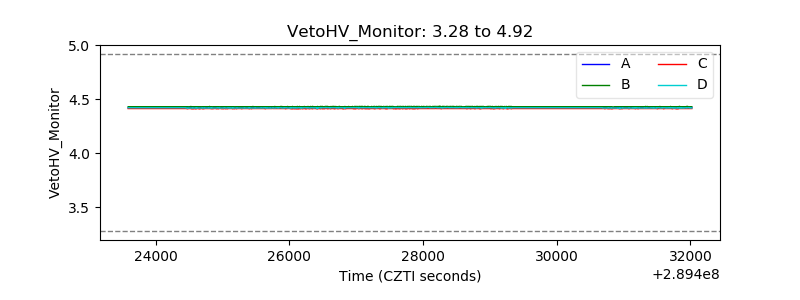 |
| Veto LLD | 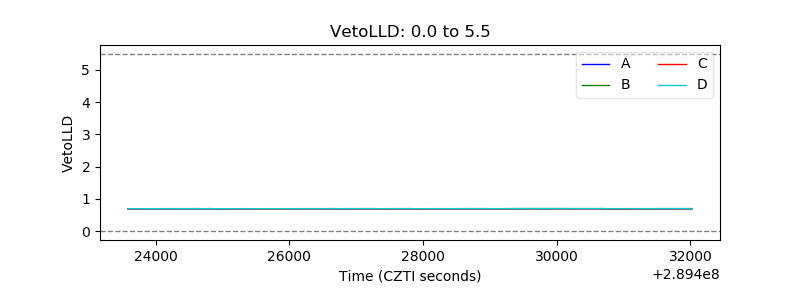 |
| Alpha Counter | 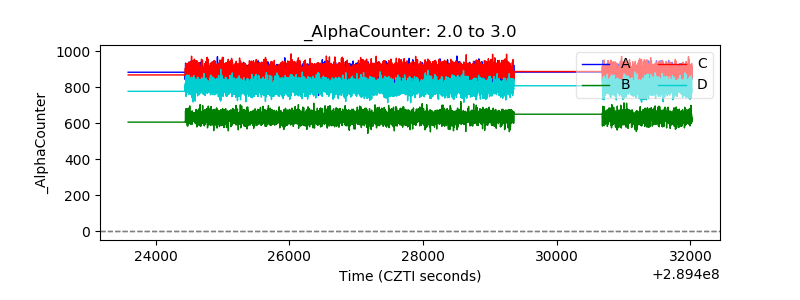 |
| _CPM_Rate | 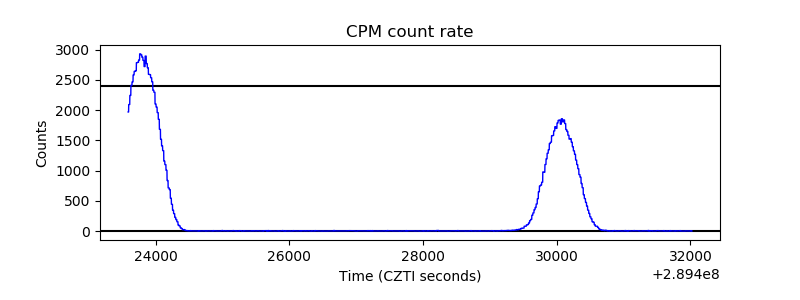 |
| CZT Counter | 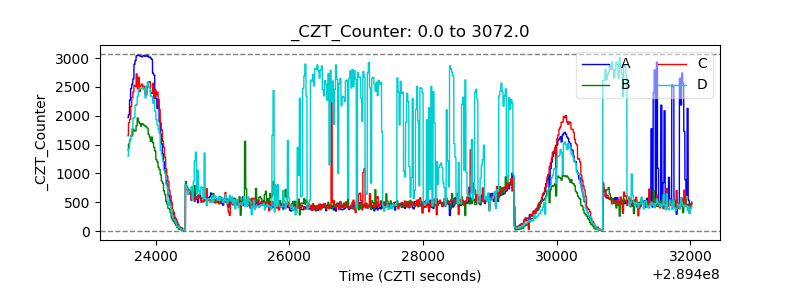 |
| +2.5 Volts monitor | 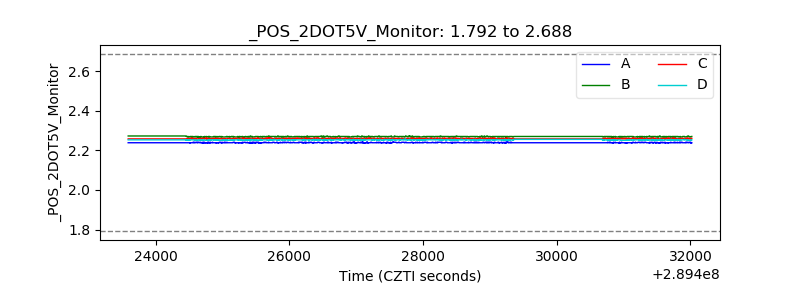 |
| +5 Volts monitor |  |
| _ROLL_ROT | 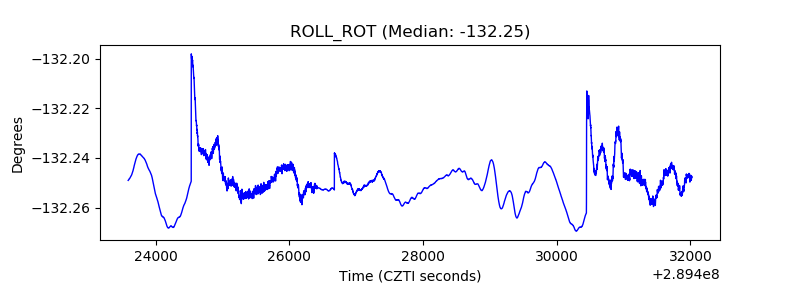 |
| _Roll_DEC | 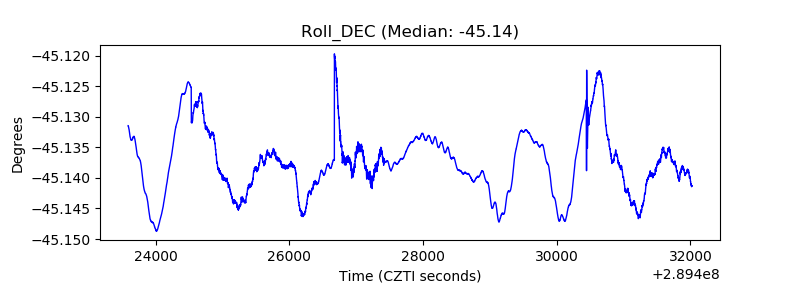 |
| _Roll_RA | 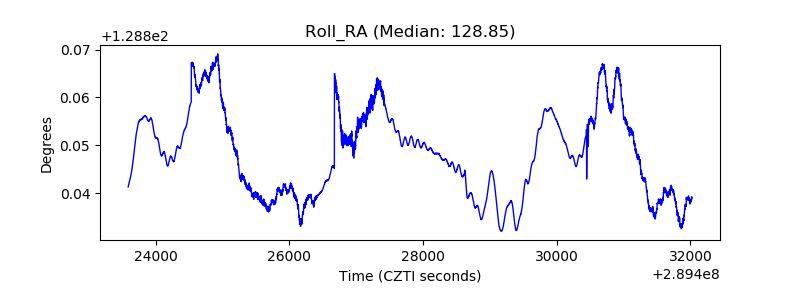 |
| Veto Counter | 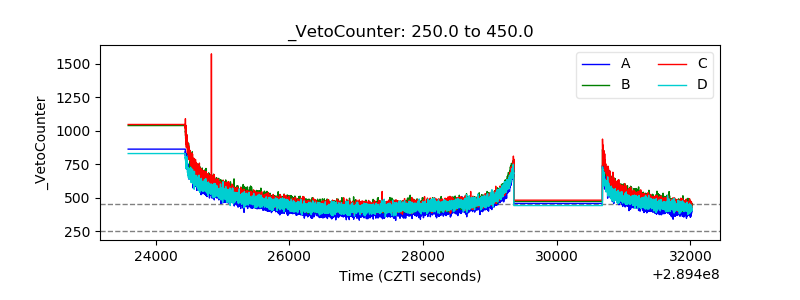 |