| Param | Original file | Final file |
|---|---|---|
| Filename | modeM0/AS1A05_188T01_9000002756_18558cztM0_level2.evt | modeM0/AS1A05_188T01_9000002756_18558cztM0_level2_quad_clean.evt |
| Size (bytes) | 497,836,800 | 98,282,880 |
| Size | 474.8 MB | 93.7 MB |
| Events in quadrant A | 3,750,821 | 636,762 |
| Events in quadrant B | 3,291,553 | 676,083 |
| Events in quadrant C | 3,261,732 | 630,101 |
| Events in quadrant D | 4,319,140 | 567,632 |
| Mode SS | |||
|---|---|---|---|
| Quadrant | BADHDUFLAG | Total packets | Discarded packets |
| A | 0 | 136 | 0 |
| B | 0 | 136 | 0 |
| C | 0 | 136 | 0 |
| D | 0 | 136 | 0 |
| Mode M9 | |||
|---|---|---|---|
| Quadrant | BADHDUFLAG | Total packets | Discarded packets |
| A | 0 | 21 | 0 |
| B | 0 | 22 | 0 |
| C | 0 | 22 | 0 |
| D | 0 | 22 | 0 |
| Mode M0 | |||
|---|---|---|---|
| Quadrant | BADHDUFLAG | Total packets | Discarded packets |
| A | 0 | 15646 | 2 |
| B | 0 | 14027 | 2 |
| C | 0 | 13989 | 2 |
| D | 0 | 17573 | 2 |
| Quadrant | Total seconds | Saturated seconds | Saturation percentage |
|---|---|---|---|
| A | 6679 | 200 | 2.994460% |
| B | 6678 | 35 | 0.524109% |
| C | 6678 | 54 | 0.808625% |
| D | 6678 | 462 | 6.918239% |
Noise dominated data is calculated using 1-second bins in cleaned event files. If a bin has >2000 counts, and if more than 50% of those come from <1% of pixels, then it is considered to be noise-dominated and hence unusable.
| Quadrant | # 1 sec bins | Bins with >0 counts | Bins with >2000 counts | High rate bins dominated by noise | Noise dominated (total time) | Noise dominated (detector-on time) | Marked lightcurve |
|---|---|---|---|---|---|---|---|
| A | 7819 | 6680 | 155 | 155 | 1.98% | 2.32% | 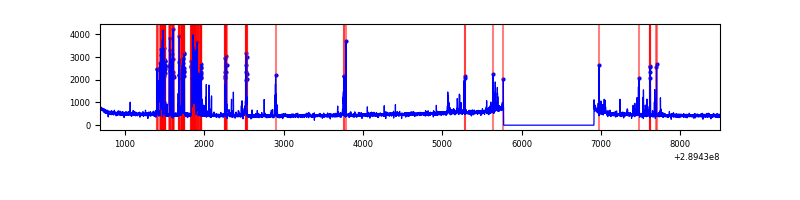 |
| B | 7818 | 6679 | 1 | 1 | 0.01% | 0.01% | 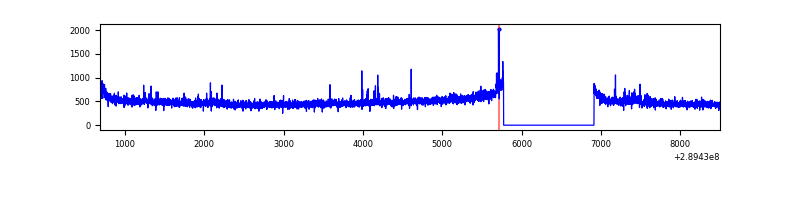 |
| C | 7818 | 6679 | 1 | 1 | 0.01% | 0.01% | 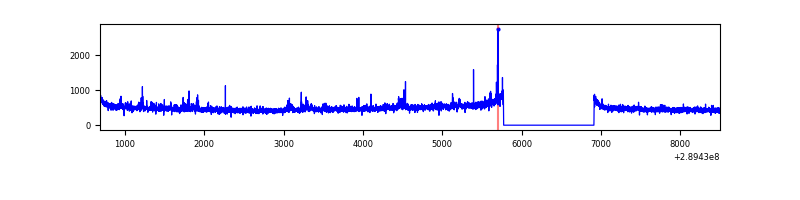 |
| D | 7818 | 6679 | 415 | 415 | 5.31% | 6.21% | 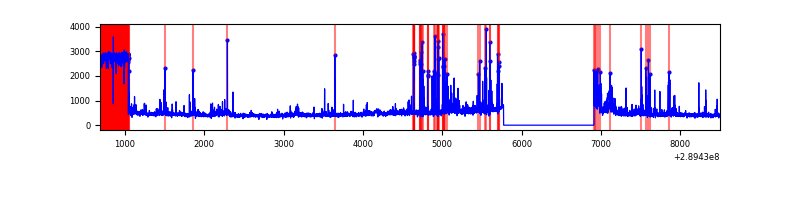 |
Top three noisy pixels from each quadrant. If the there are fewer than three noisy pixels in the level2.evt file, extra rows are filled as -1
| Pixel properties | Quadrant properties | ||||||
|---|---|---|---|---|---|---|---|
| Quadrant | DetID | PixID | Counts | Sigma | Mean | Median | Sigma |
| A | 0 | 13 | 657938 | 4065.37 | 802 | 787 | 161.6 |
| A | 13 | 254 | 11575 | 66.74 | 802 | 787 | 161.6 |
| A | 0 | 226 | 6973 | 38.27 | 802 | 787 | 161.6 |
| B | 3 | 64 | 38199 | 242.86 | 821 | 801 | 154.0 |
| B | 12 | 111 | 18223 | 113.14 | 821 | 801 | 154.0 |
| B | 11 | 111 | 15443 | 95.08 | 821 | 801 | 154.0 |
| C | 14 | 238 | 123342 | 675.72 | 778 | 785 | 181.4 |
| C | 9 | 54 | 98791 | 540.35 | 778 | 785 | 181.4 |
| C | 13 | 61 | 5605 | 26.57 | 778 | 785 | 181.4 |
| D | 1 | 52 | 1289607 | 7268.0 | 740 | 719 | 177.3 |
| D | 7 | 238 | 134850 | 756.36 | 740 | 719 | 177.3 |
| D | 7 | 38 | 46155 | 256.21 | 740 | 719 | 177.3 |
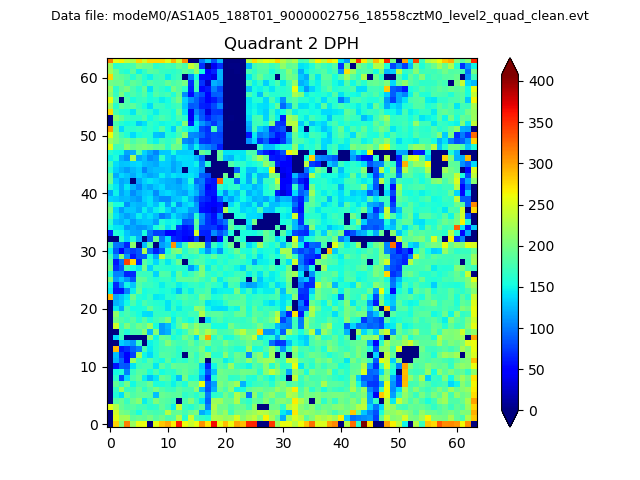
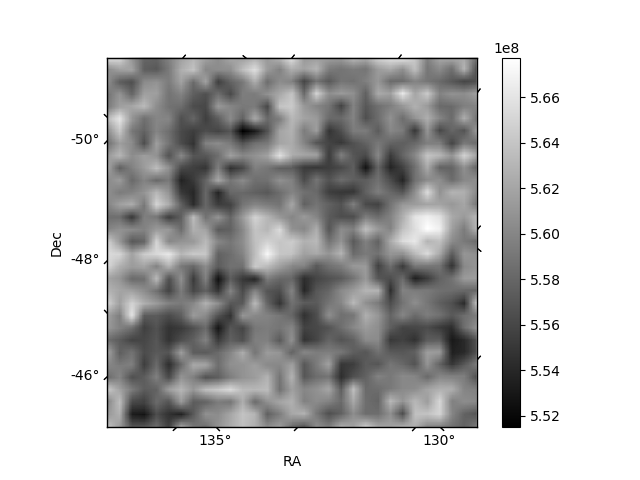
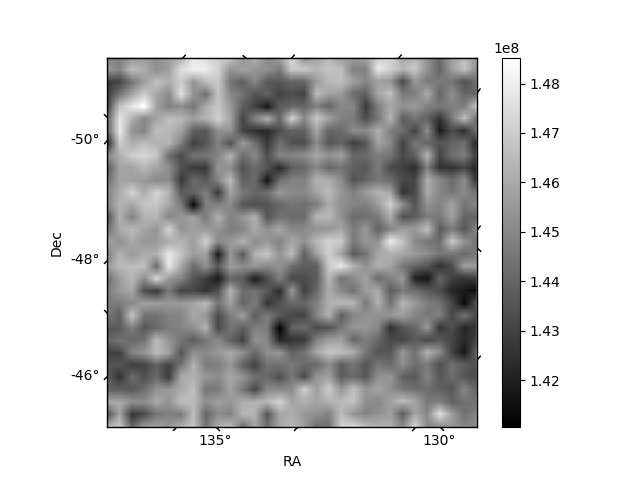
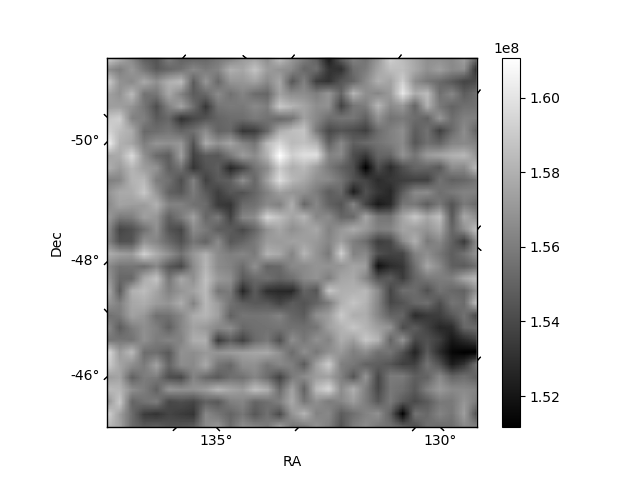
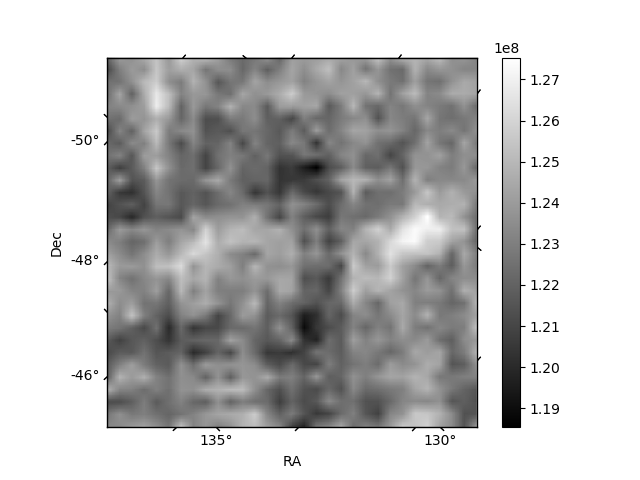
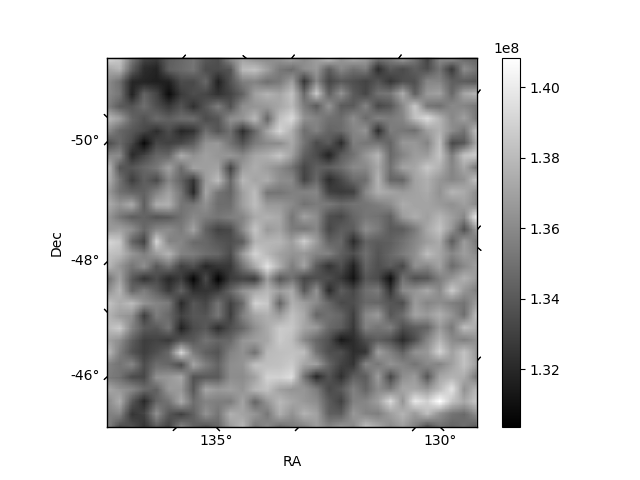
Histogram calculated using DETX and DETY for each event in the final _common_clean file
| Quadrant A | 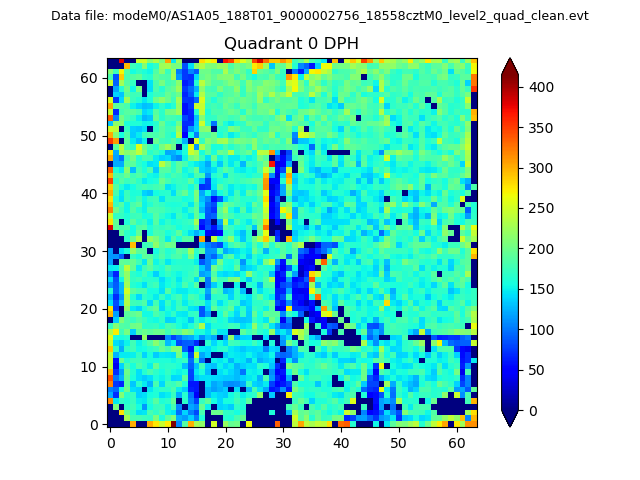 |
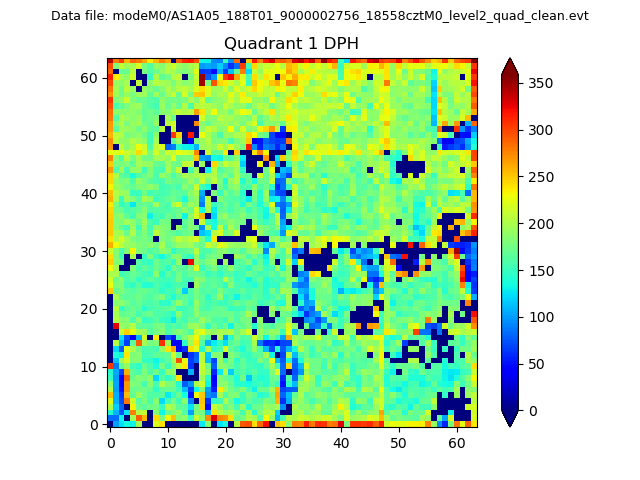 |
Quadrant B |
|---|---|---|---|
| Quadrant D | 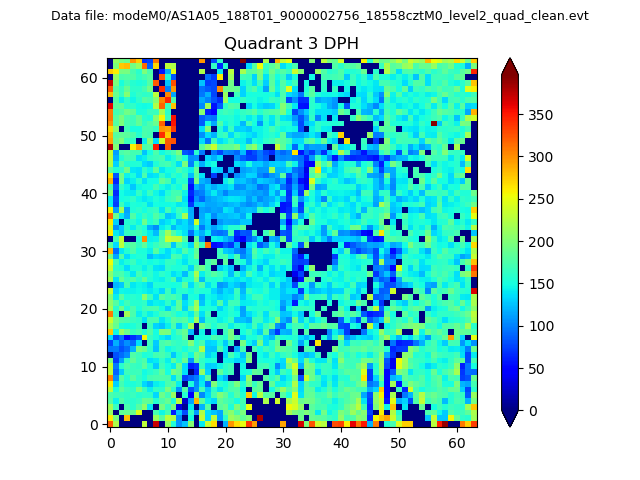 |
 |
Quadrant C |
| Plot type | Count rate plots | Images |
|---|---|---|
| Comparison with Poisson distribution Blue bars denote a histogram of data divided into 1 sec bins. Red curve is a Poisson curve with rate = median count rate of data. |
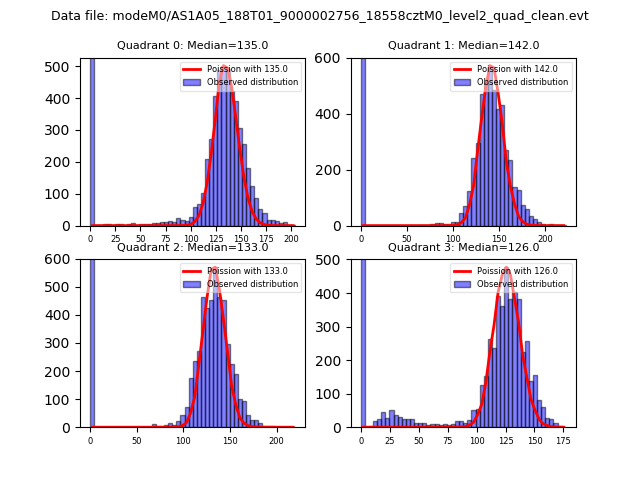 |
 |
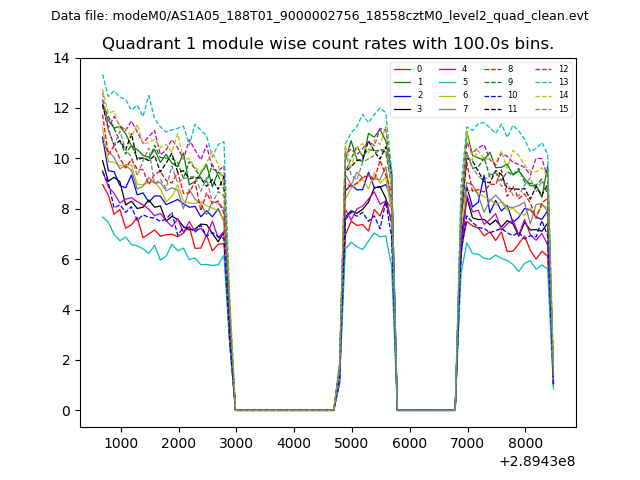
| Quadrant-wise count rates Data is divided into 100 sec bins |
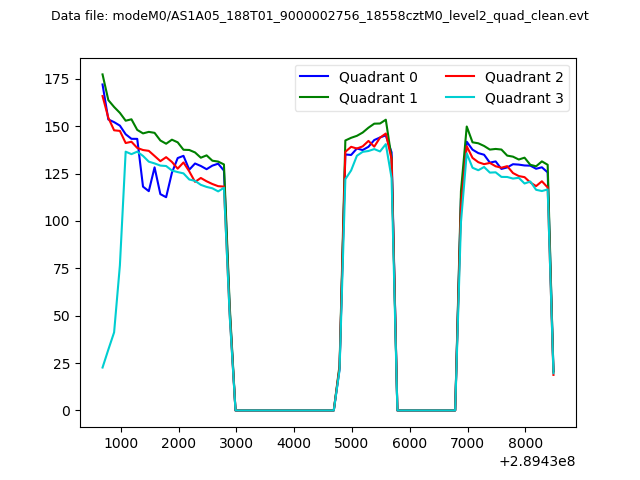 |
|
| Module-wise count rates for Quadrant A Data is divided into 100 sec bins |
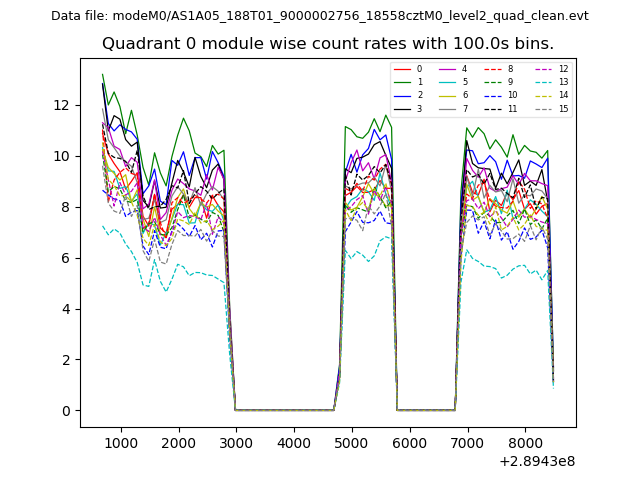 |
 |
| Module-wise count rates for Quadrant B Data is divided into 100 sec bins |
 |
 |
| Module-wise count rates for Quadrant C Data is divided into 100 sec bins |
 |
 |
| Module-wise count rates for Quadrant D Data is divided into 100 sec bins |
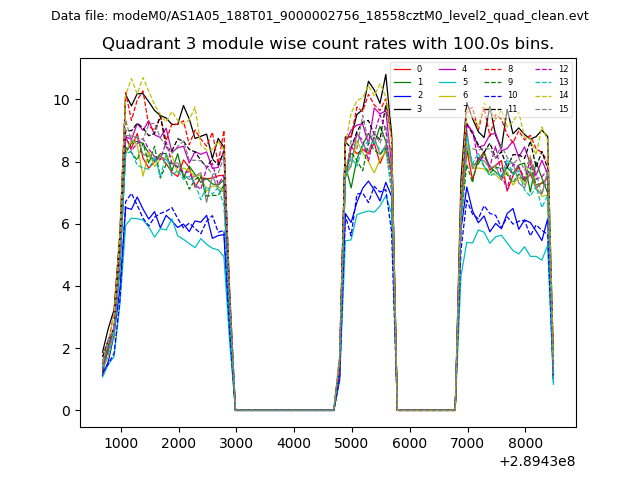 |
 |
| Parameter | Plot |
|---|---|
| CZT HV Monitor | 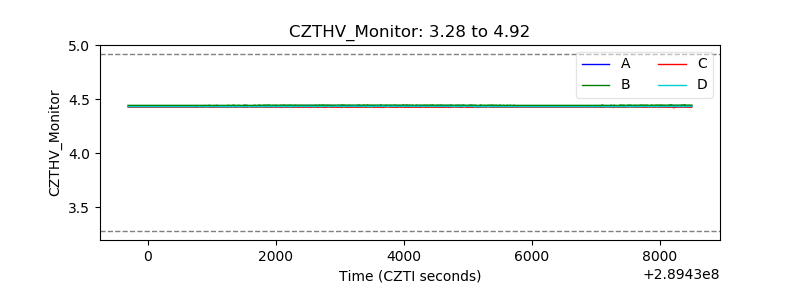 |
| D_VDD | 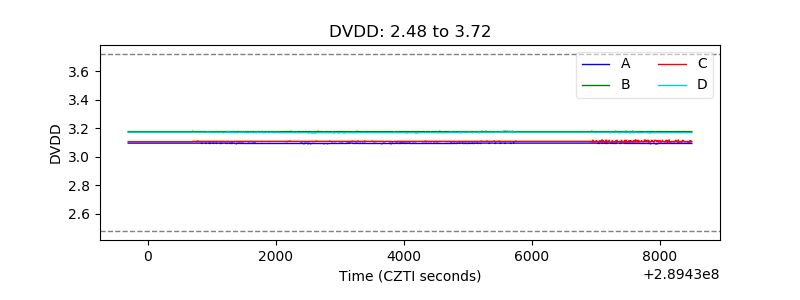 |
| Temperature 1 | 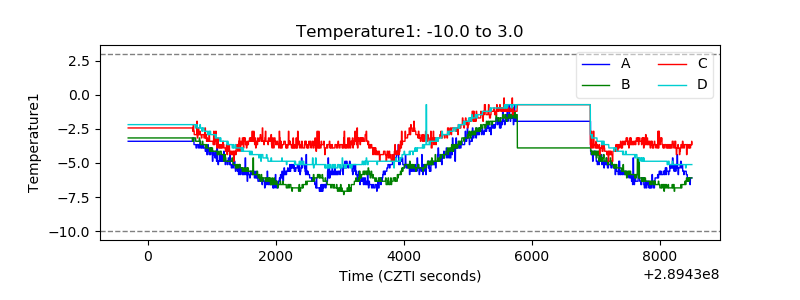 |
| Veto HV Monitor | 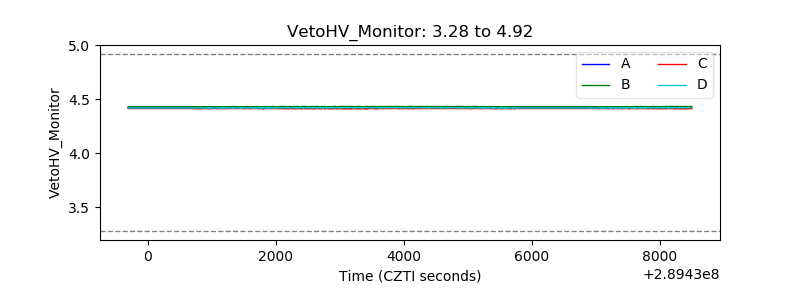 |
| Veto LLD | 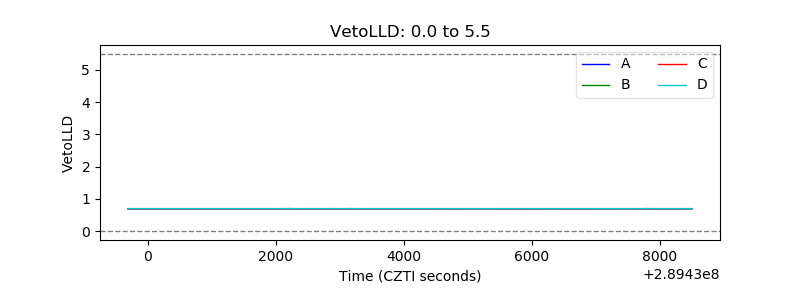 |
| Alpha Counter |  |
| _CPM_Rate | 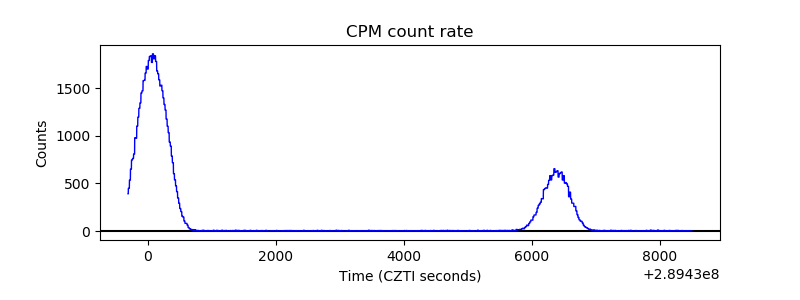 |
| CZT Counter | 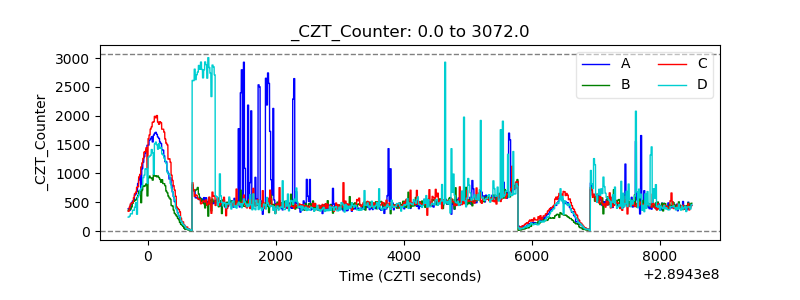 |
| +2.5 Volts monitor | 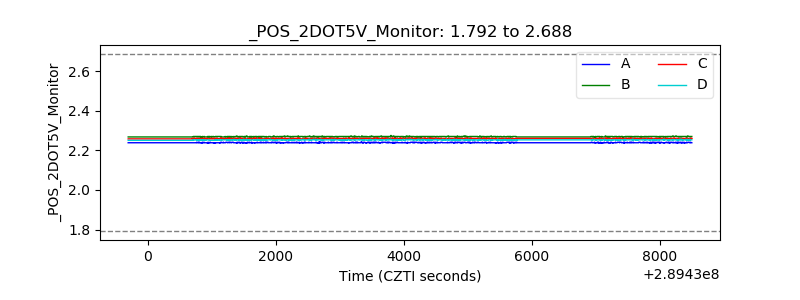 |
| +5 Volts monitor |  |
| _ROLL_ROT |  |
| _Roll_DEC | 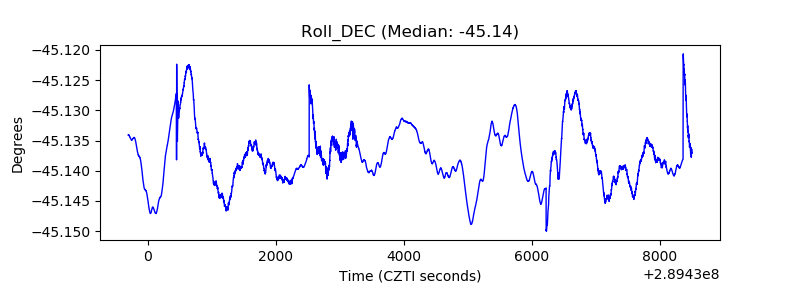 |
| _Roll_RA |  |
| Veto Counter |  |