| Param | Original file | Final file |
|---|---|---|
| Filename | modeM0/AS1A05_188T01_9000002756_18559cztM0_level2.evt | modeM0/AS1A05_188T01_9000002756_18559cztM0_level2_quad_clean.evt |
| Size (bytes) | 512,225,280 | 100,042,560 |
| Size | 488.5 MB | 95.4 MB |
| Events in quadrant A | 3,934,433 | 627,396 |
| Events in quadrant B | 3,457,662 | 676,747 |
| Events in quadrant C | 3,293,715 | 635,219 |
| Events in quadrant D | 4,346,553 | 597,670 |
| Mode SS | |||
|---|---|---|---|
| Quadrant | BADHDUFLAG | Total packets | Discarded packets |
| A | 0 | 144 | 0 |
| B | 0 | 144 | 0 |
| C | 0 | 144 | 0 |
| D | 0 | 144 | 0 |
| Mode M9 | |||
|---|---|---|---|
| Quadrant | BADHDUFLAG | Total packets | Discarded packets |
| A | 0 | 16 | 0 |
| B | 0 | 17 | 0 |
| C | 0 | 17 | 0 |
| D | 0 | 17 | 0 |
| Mode M0 | |||
|---|---|---|---|
| Quadrant | BADHDUFLAG | Total packets | Discarded packets |
| A | 0 | 16490 | 2 |
| B | 0 | 14935 | 2 |
| C | 0 | 14393 | 2 |
| D | 0 | 18009 | 2 |
| Quadrant | Total seconds | Saturated seconds | Saturation percentage |
|---|---|---|---|
| A | 7071 | 300 | 4.242681% |
| B | 7071 | 44 | 0.622260% |
| C | 7071 | 51 | 0.721256% |
| D | 7071 | 289 | 4.087116% |
Noise dominated data is calculated using 1-second bins in cleaned event files. If a bin has >2000 counts, and if more than 50% of those come from <1% of pixels, then it is considered to be noise-dominated and hence unusable.
| Quadrant | # 1 sec bins | Bins with >0 counts | Bins with >2000 counts | High rate bins dominated by noise | Noise dominated (total time) | Noise dominated (detector-on time) | Marked lightcurve |
|---|---|---|---|---|---|---|---|
| A | 7816 | 7072 | 271 | 271 | 3.47% | 3.83% | 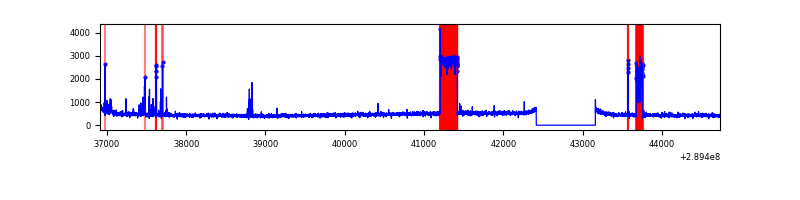 |
| B | 7816 | 7072 | 8 | 8 | 0.10% | 0.11% | 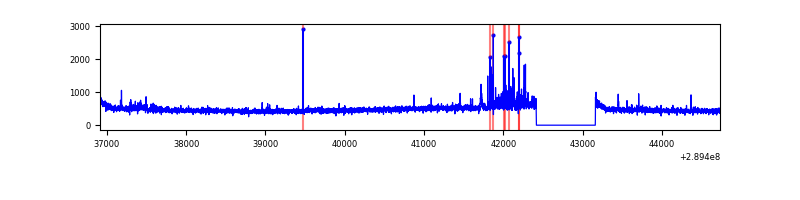 |
| C | 7816 | 7072 | 1 | 1 | 0.01% | 0.01% | 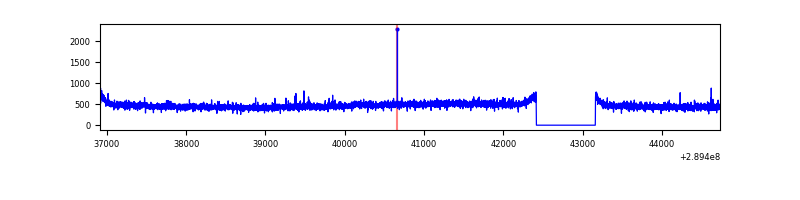 |
| D | 7816 | 7072 | 227 | 227 | 2.90% | 3.21% | 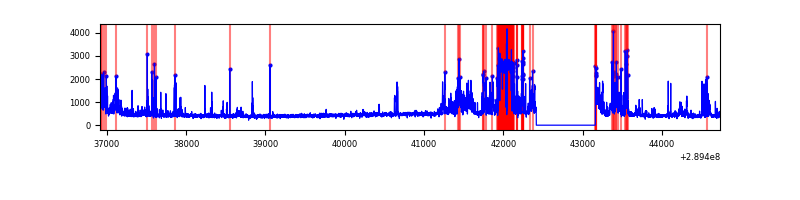 |
Top three noisy pixels from each quadrant. If the there are fewer than three noisy pixels in the level2.evt file, extra rows are filled as -1
| Pixel properties | Quadrant properties | ||||||
|---|---|---|---|---|---|---|---|
| Quadrant | DetID | PixID | Counts | Sigma | Mean | Median | Sigma |
| A | 0 | 13 | 666295 | 4106.28 | 809 | 791 | 162.1 |
| A | 14 | 111 | 149752 | 919.12 | 809 | 791 | 162.1 |
| A | 13 | 254 | 11704 | 67.34 | 809 | 791 | 162.1 |
| B | 7 | 220 | 76228 | 471.64 | 845 | 824 | 159.9 |
| B | 12 | 18 | 22441 | 135.21 | 845 | 824 | 159.9 |
| B | 12 | 111 | 19137 | 114.54 | 845 | 824 | 159.9 |
| C | 14 | 238 | 126449 | 672.91 | 802 | 808 | 186.7 |
| C | 9 | 54 | 10620 | 52.55 | 802 | 808 | 186.7 |
| C | 8 | 128 | 9175 | 44.81 | 802 | 808 | 186.7 |
| D | 7 | 238 | 1082691 | 5613.23 | 789 | 765 | 192.7 |
| D | 1 | 52 | 139539 | 719.99 | 789 | 765 | 192.7 |
| D | 7 | 38 | 77993 | 400.67 | 789 | 765 | 192.7 |
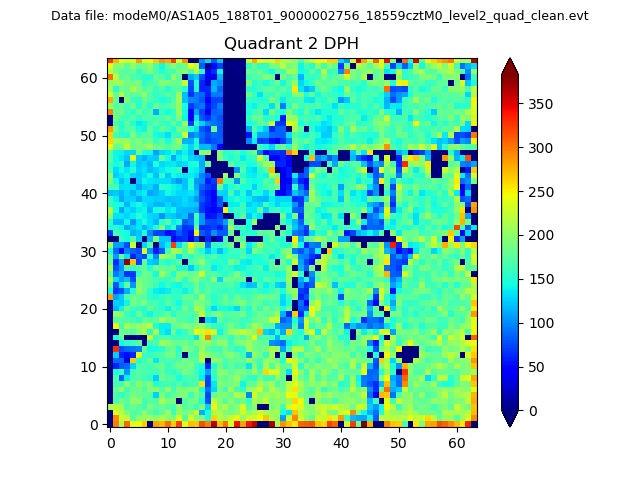
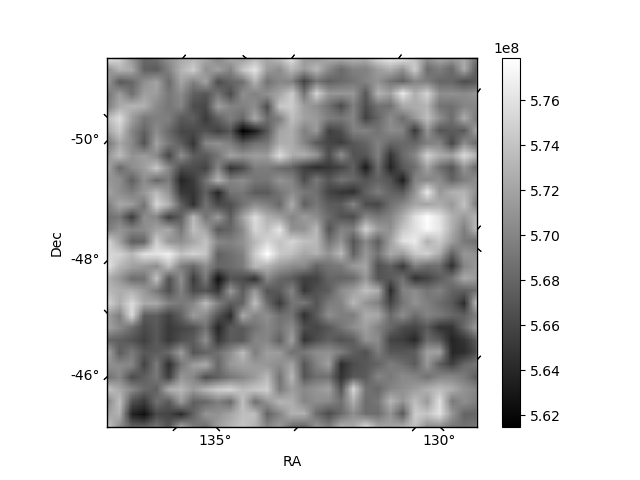
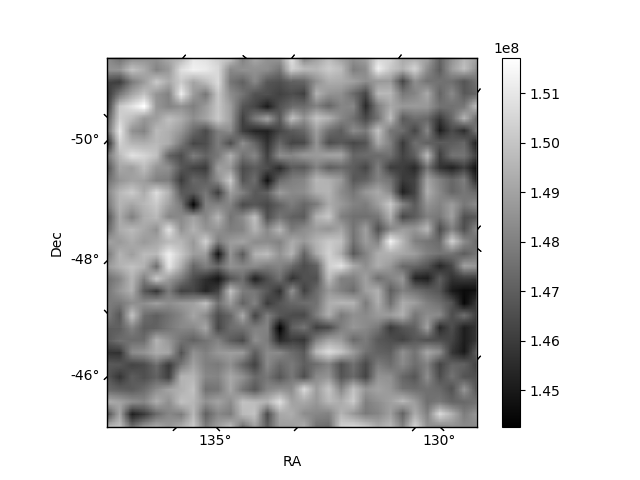
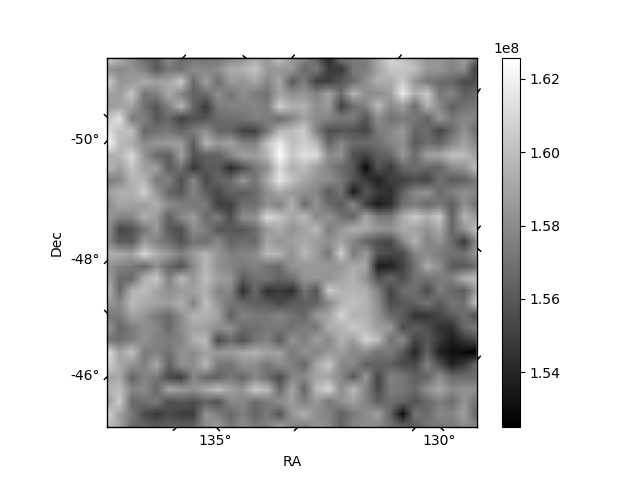
Histogram calculated using DETX and DETY for each event in the final _common_clean file
| Quadrant A | 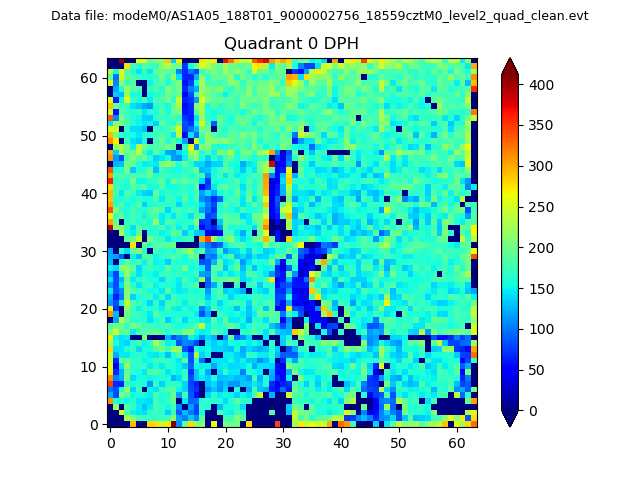 |
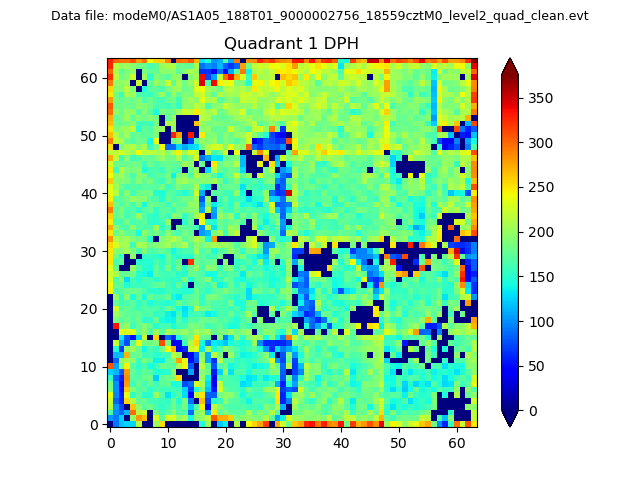 |
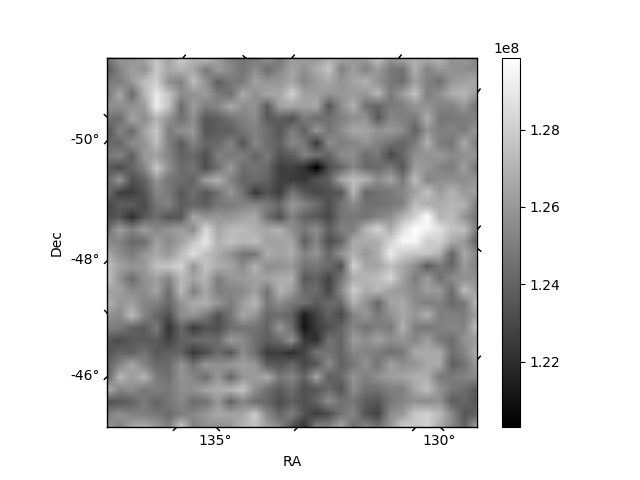
Quadrant B |
|---|---|---|---|
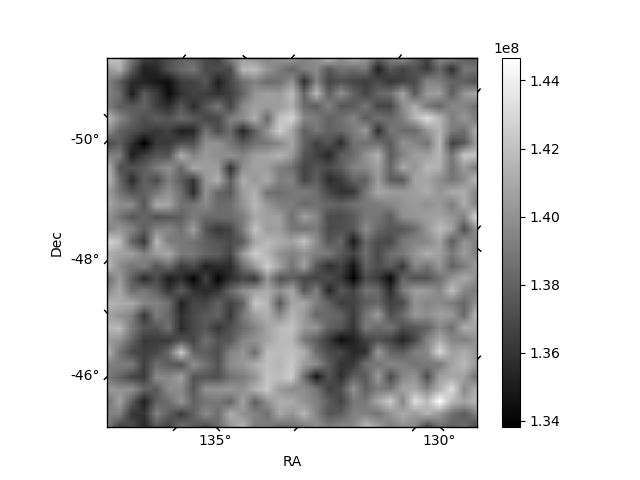
| Quadrant D | 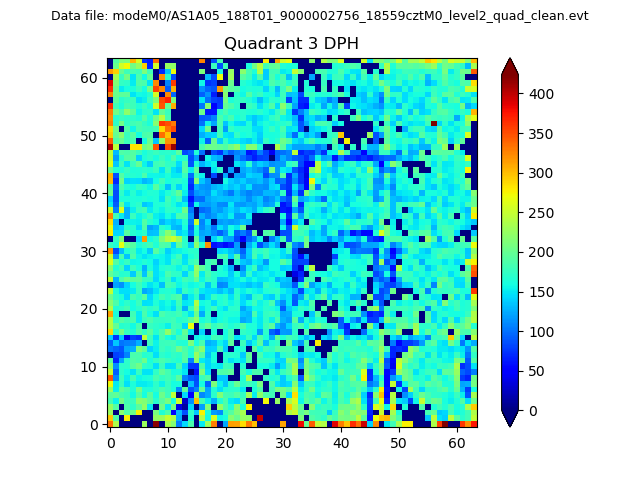 |
 |
Quadrant C |
| Plot type | Count rate plots | Images |
|---|---|---|
| Comparison with Poisson distribution Blue bars denote a histogram of data divided into 1 sec bins. Red curve is a Poisson curve with rate = median count rate of data. |
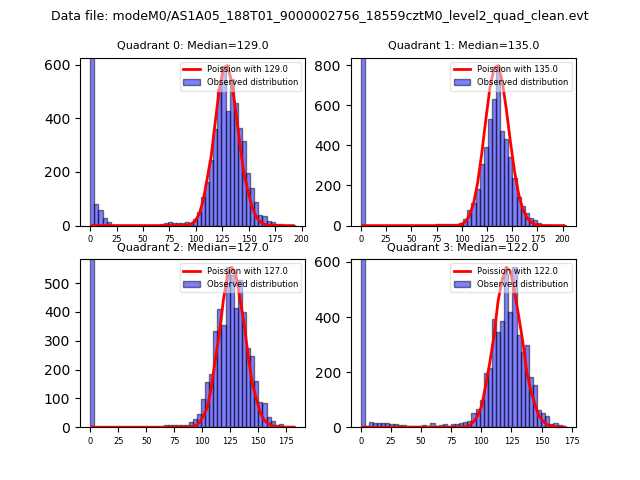 |
 |
| Quadrant-wise count rates Data is divided into 100 sec bins |
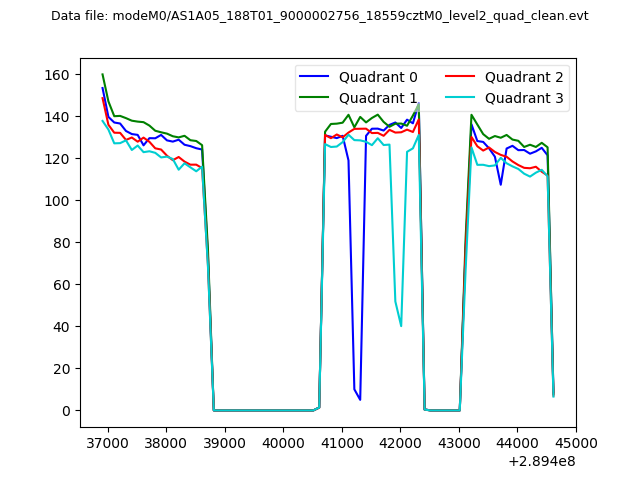 |
|
| Module-wise count rates for Quadrant A Data is divided into 100 sec bins |
 |
 |
| Module-wise count rates for Quadrant B Data is divided into 100 sec bins |
 |
 |
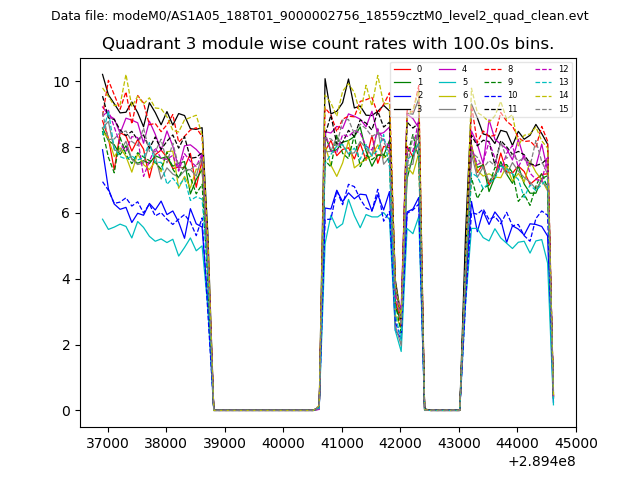
| Module-wise count rates for Quadrant C Data is divided into 100 sec bins |
 |
 |
| Module-wise count rates for Quadrant D Data is divided into 100 sec bins |
 |
 |
| Parameter | Plot |
|---|---|
| CZT HV Monitor | 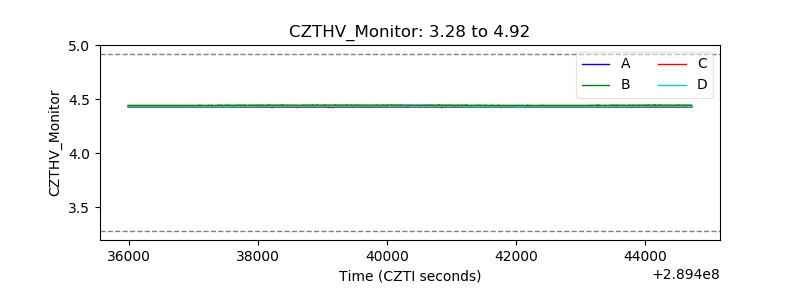 |
| D_VDD | 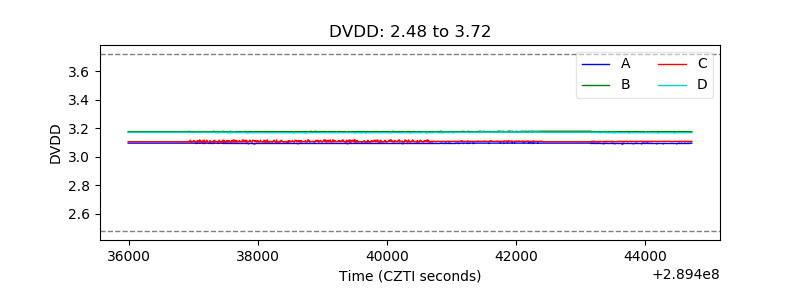 |
| Temperature 1 | 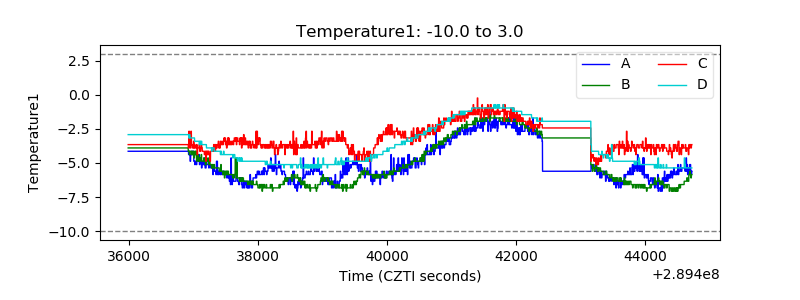 |
| Veto HV Monitor | 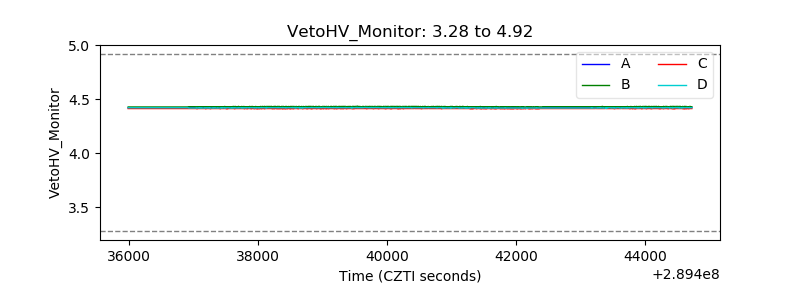 |
| Veto LLD | 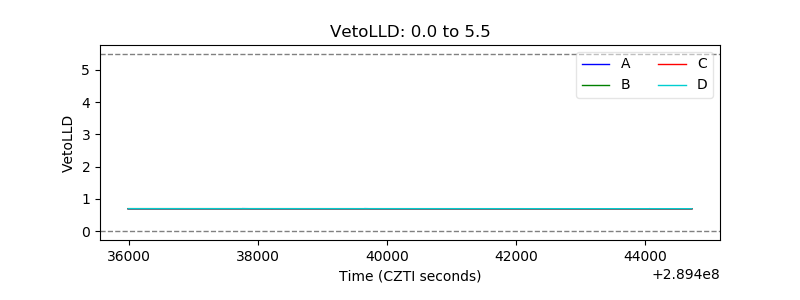 |
| Alpha Counter |  |
| _CPM_Rate | 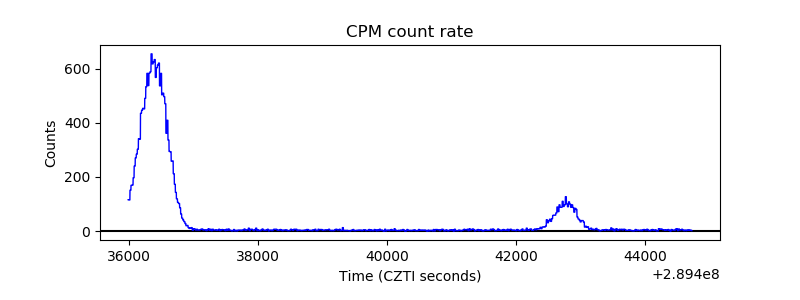 |
| CZT Counter | 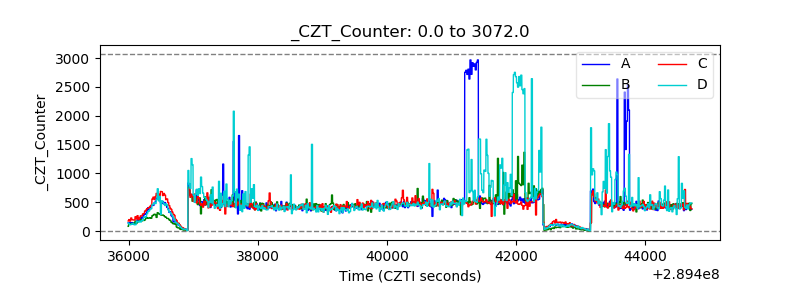 |
| +2.5 Volts monitor |  |
| +5 Volts monitor |  |
| _ROLL_ROT | 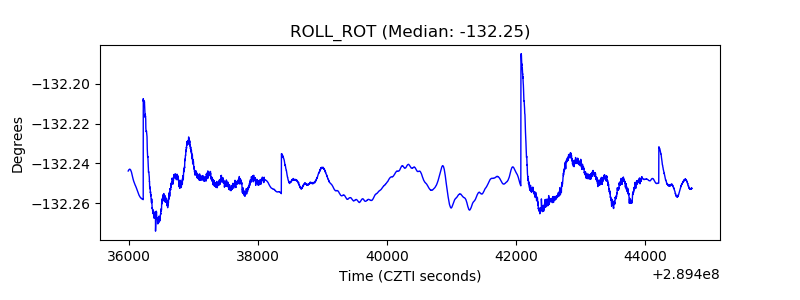 |
| _Roll_DEC | 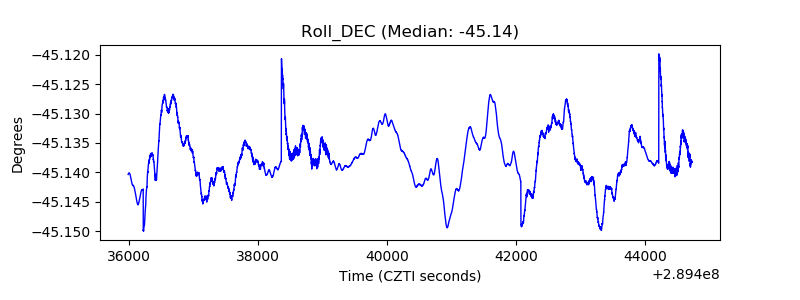 |
| _Roll_RA | 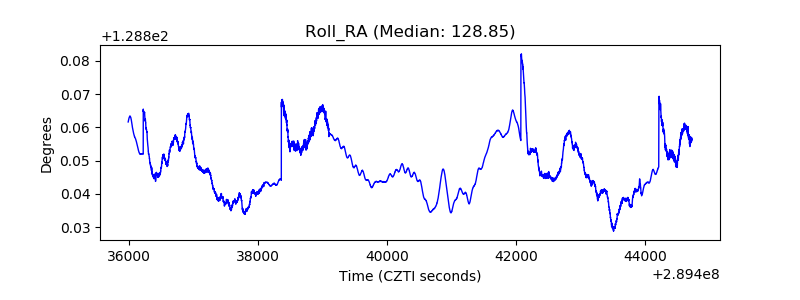 |
| Veto Counter | 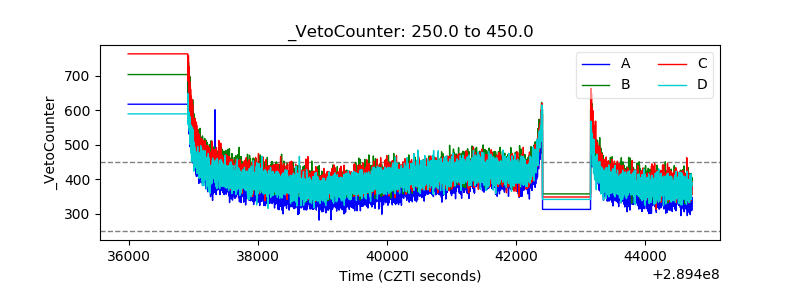 |