| Param | Original file | Final file |
|---|---|---|
| Filename | modeM0/AS1A05_188T01_9000002756_18560cztM0_level2.evt | modeM0/AS1A05_188T01_9000002756_18560cztM0_level2_quad_clean.evt |
| Size (bytes) | 535,766,400 | 101,278,080 |
| Size | 510.9 MB | 96.6 MB |
| Events in quadrant A | 3,692,911 | 647,272 |
| Events in quadrant B | 3,581,579 | 671,717 |
| Events in quadrant C | 3,632,210 | 628,289 |
| Events in quadrant D | 4,818,443 | 606,407 |
| Mode SS | |||
|---|---|---|---|
| Quadrant | BADHDUFLAG | Total packets | Discarded packets |
| A | 0 | 152 | 0 |
| B | 0 | 152 | 0 |
| C | 0 | 152 | 0 |
| D | 0 | 152 | 0 |
| Mode M9 | |||
|---|---|---|---|
| Quadrant | BADHDUFLAG | Total packets | Discarded packets |
| A | 0 | 10 | 0 |
| B | 0 | 10 | 0 |
| C | 0 | 10 | 0 |
| D | 0 | 10 | 0 |
| Mode M0 | |||
|---|---|---|---|
| Quadrant | BADHDUFLAG | Total packets | Discarded packets |
| A | 0 | 15969 | 2 |
| B | 0 | 15525 | 2 |
| C | 0 | 15640 | 2 |
| D | 0 | 19510 | 2 |
| Quadrant | Total seconds | Saturated seconds | Saturation percentage |
|---|---|---|---|
| A | 7373 | 139 | 1.885257% |
| B | 7372 | 111 | 1.505697% |
| C | 7373 | 143 | 1.939509% |
| D | 7373 | 242 | 3.282246% |
Noise dominated data is calculated using 1-second bins in cleaned event files. If a bin has >2000 counts, and if more than 50% of those come from <1% of pixels, then it is considered to be noise-dominated and hence unusable.
| Quadrant | # 1 sec bins | Bins with >0 counts | Bins with >2000 counts | High rate bins dominated by noise | Noise dominated (total time) | Noise dominated (detector-on time) | Marked lightcurve |
|---|---|---|---|---|---|---|---|
| A | 8393 | 7375 | 62 | 62 | 0.74% | 0.84% | 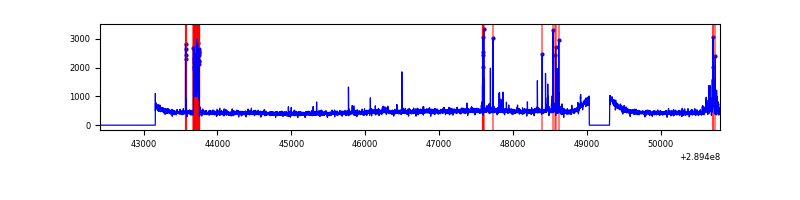 |
| B | 8392 | 7373 | 9 | 9 | 0.11% | 0.12% | 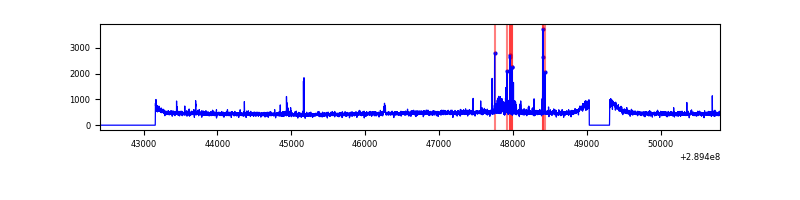 |
| C | 8393 | 7375 | 4 | 4 | 0.05% | 0.05% | 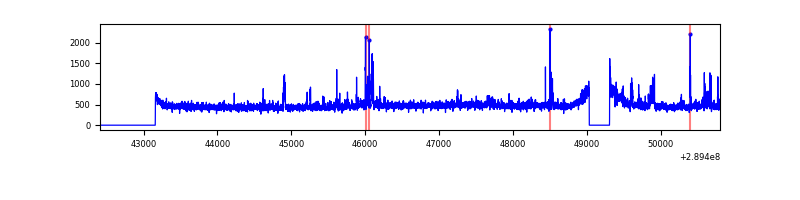 |
| D | 8393 | 7375 | 139 | 139 | 1.66% | 1.88% | 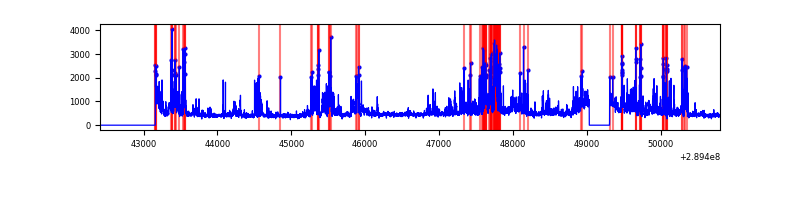 |
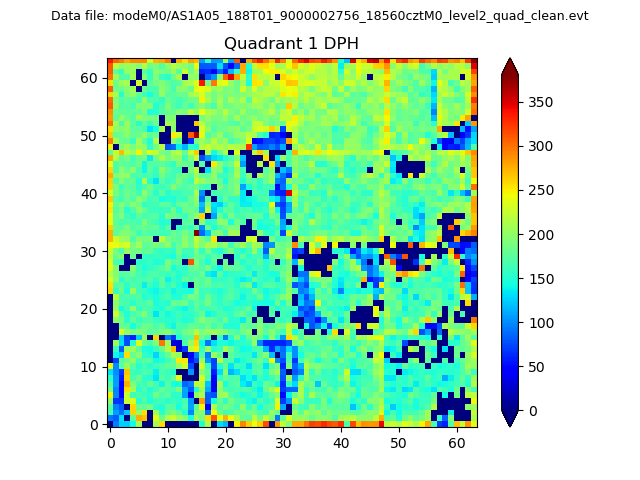
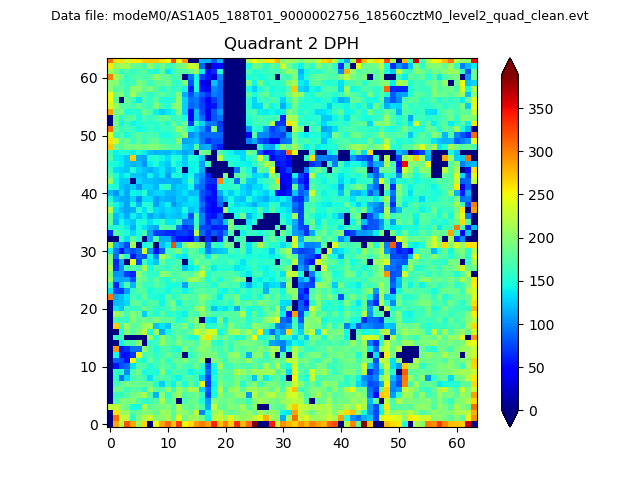
Top three noisy pixels from each quadrant. If the there are fewer than three noisy pixels in the level2.evt file, extra rows are filled as -1
| Pixel properties | Quadrant properties | ||||||
|---|---|---|---|---|---|---|---|
| Quadrant | DetID | PixID | Counts | Sigma | Mean | Median | Sigma |
| A | 0 | 13 | 169279 | 952.07 | 875 | 854 | 176.9 |
| A | 14 | 111 | 151623 | 852.26 | 875 | 854 | 176.9 |
| A | 13 | 254 | 12085 | 63.49 | 875 | 854 | 176.9 |
| B | 7 | 220 | 76922 | 442.05 | 884 | 860 | 172.1 |
| B | 3 | 64 | 28516 | 160.73 | 884 | 860 | 172.1 |
| B | 12 | 111 | 20444 | 113.82 | 884 | 860 | 172.1 |
| C | 9 | 54 | 181006 | 911.68 | 839 | 845 | 197.6 |
| C | 14 | 238 | 131937 | 663.37 | 839 | 845 | 197.6 |
| C | 3 | 233 | 25021 | 122.34 | 839 | 845 | 197.6 |
| D | 7 | 238 | 1391834 | 6743.74 | 841 | 813 | 206.3 |
| D | 1 | 52 | 170502 | 822.66 | 841 | 813 | 206.3 |
| D | 7 | 38 | 50233 | 239.59 | 841 | 813 | 206.3 |
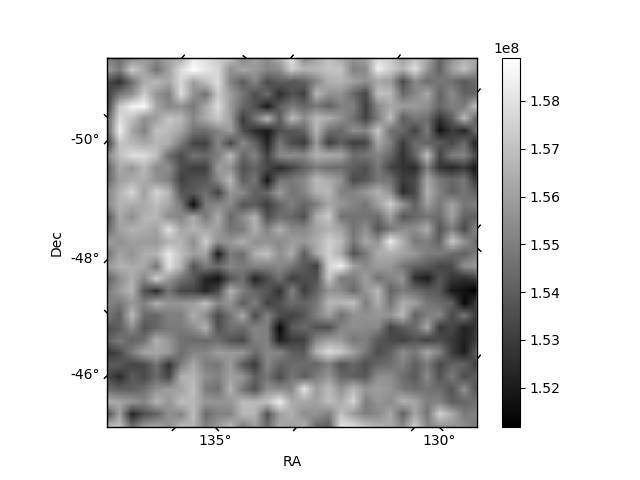
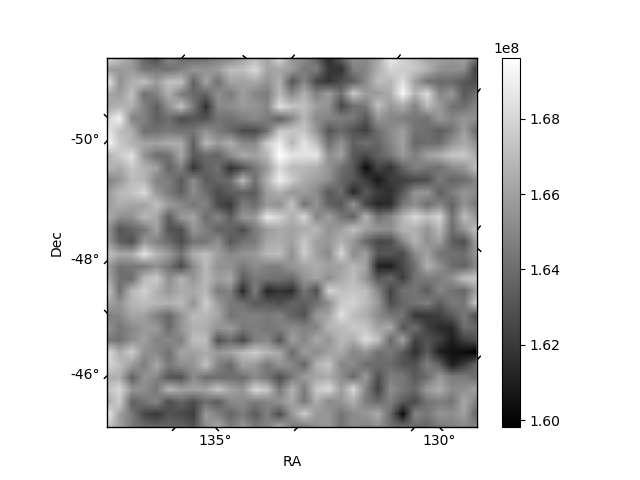
Histogram calculated using DETX and DETY for each event in the final _common_clean file
| Quadrant A | 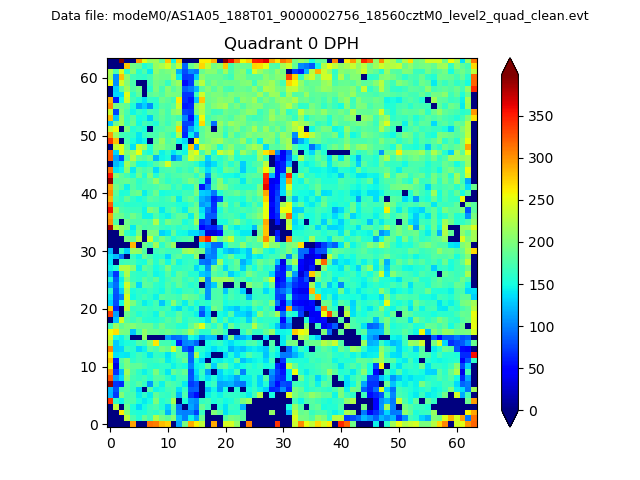 |
 |
Quadrant B |
|---|---|---|---|
| Quadrant D | 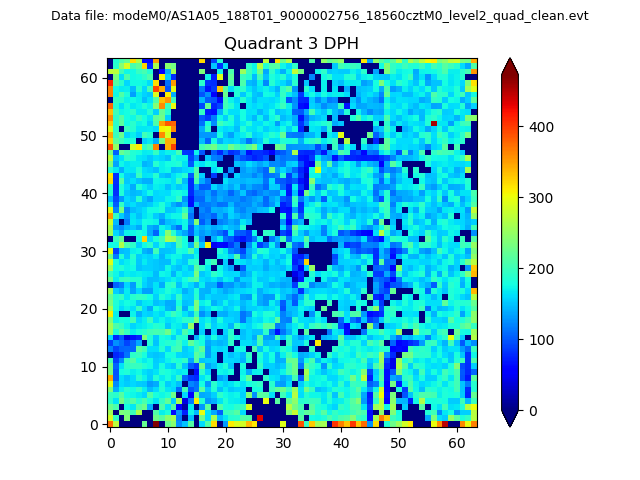 |
 |
Quadrant C |
| Plot type | Count rate plots | Images |
|---|---|---|
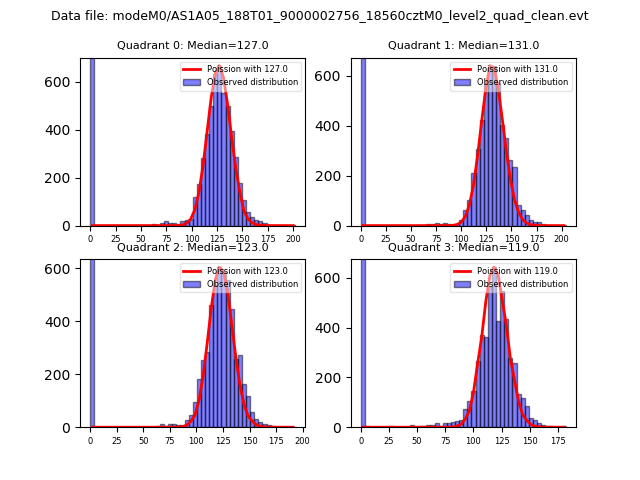
| Comparison with Poisson distribution Blue bars denote a histogram of data divided into 1 sec bins. Red curve is a Poisson curve with rate = median count rate of data. |
 |
 |
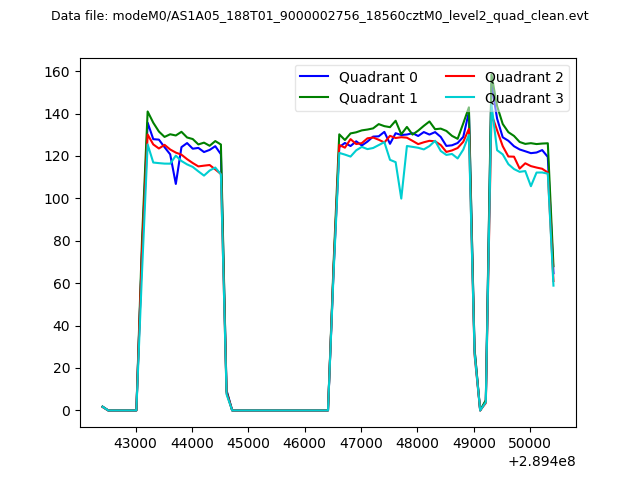
| Quadrant-wise count rates Data is divided into 100 sec bins |
 |
|
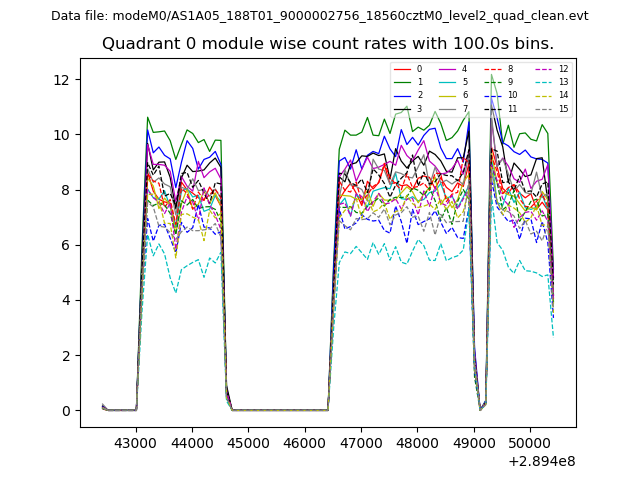
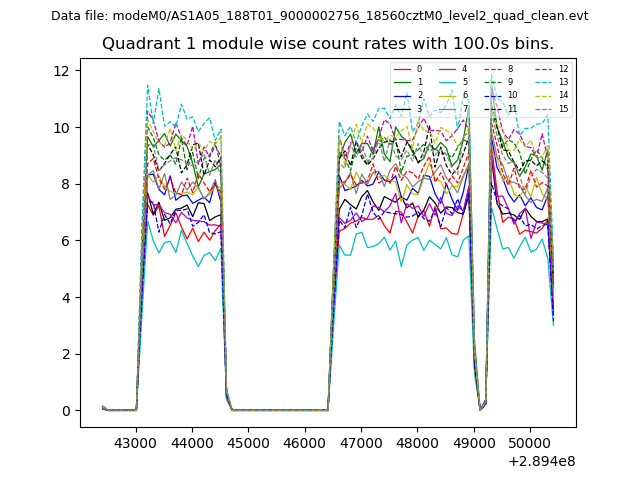
| Module-wise count rates for Quadrant A Data is divided into 100 sec bins |
 |
 |
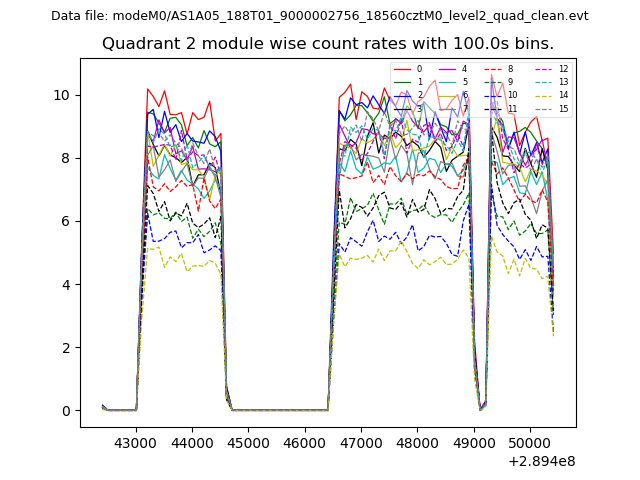
| Module-wise count rates for Quadrant B Data is divided into 100 sec bins |
 |
 |
| Module-wise count rates for Quadrant C Data is divided into 100 sec bins |
 |
 |
| Module-wise count rates for Quadrant D Data is divided into 100 sec bins |
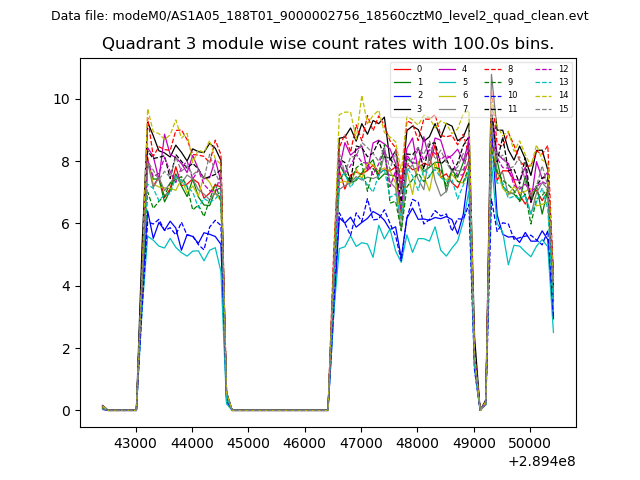 |
 |
| Parameter | Plot |
|---|---|
| CZT HV Monitor | 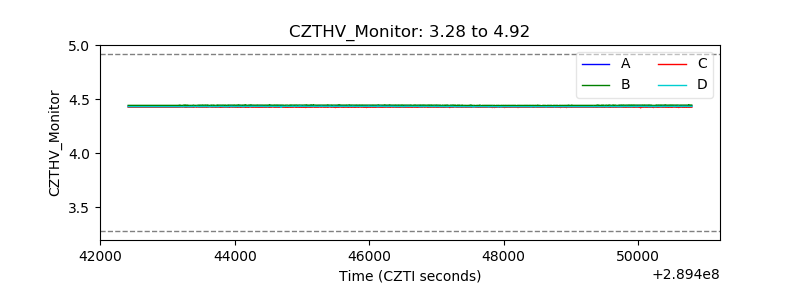 |
| D_VDD | 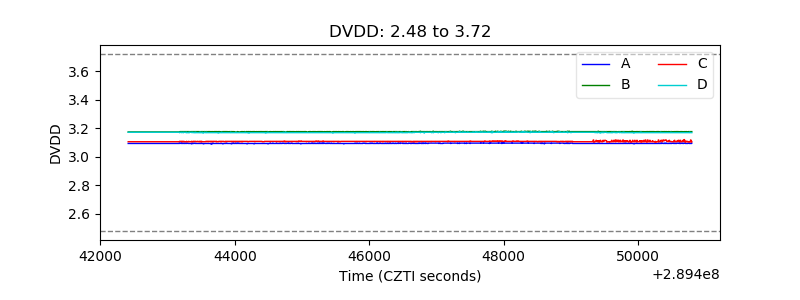 |
| Temperature 1 | 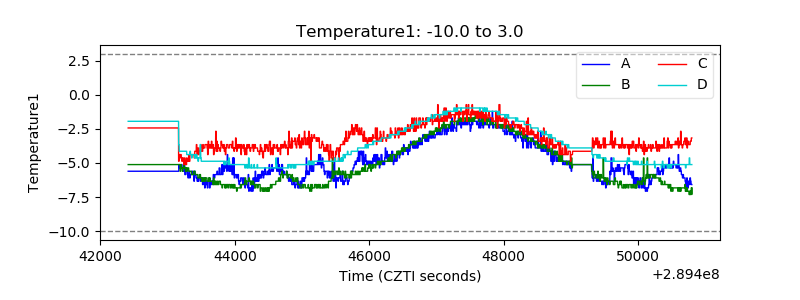 |
| Veto HV Monitor | 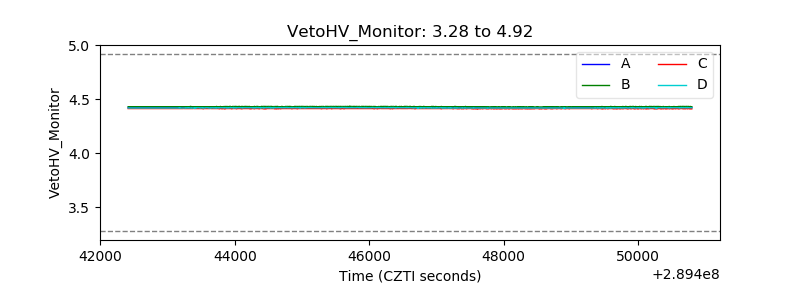 |
| Veto LLD |  |
| Alpha Counter | 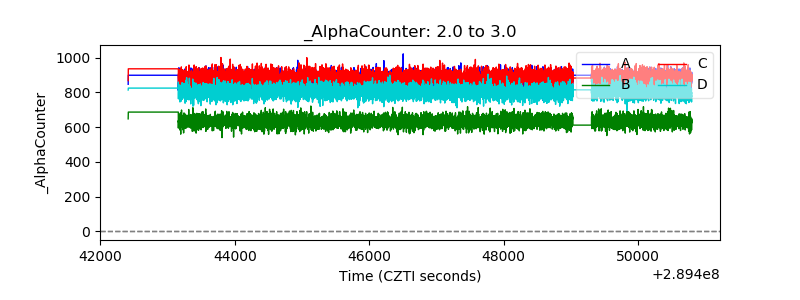 |
| _CPM_Rate | 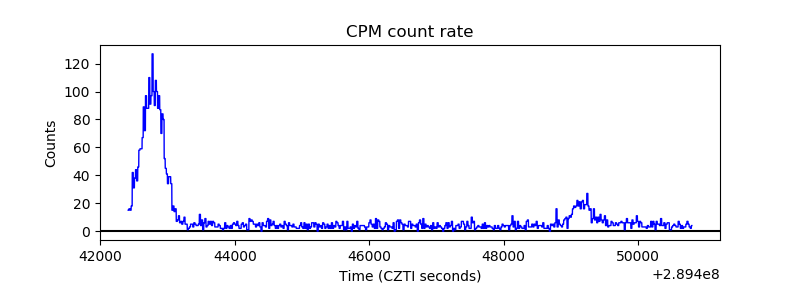 |
| CZT Counter | 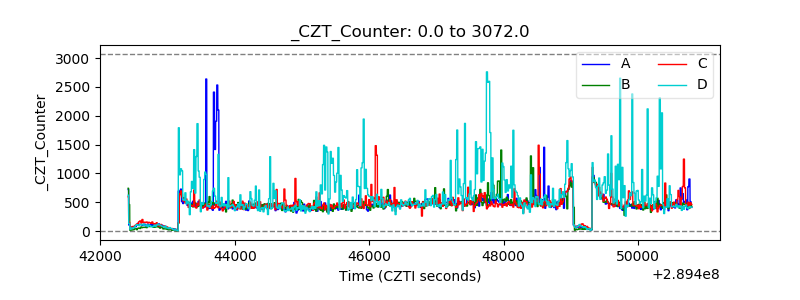 |
| +2.5 Volts monitor | 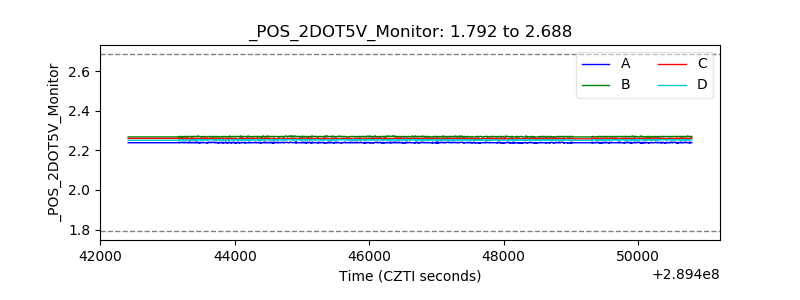 |
| +5 Volts monitor | 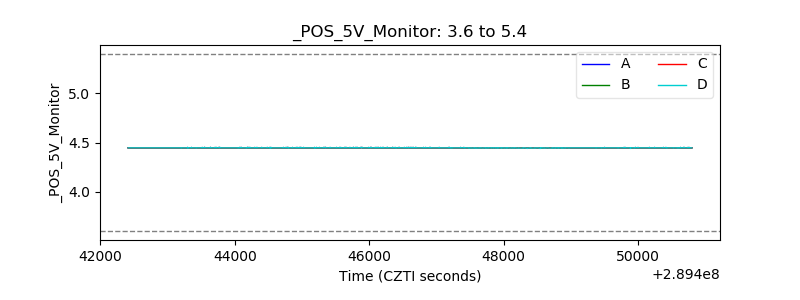 |
| _ROLL_ROT | 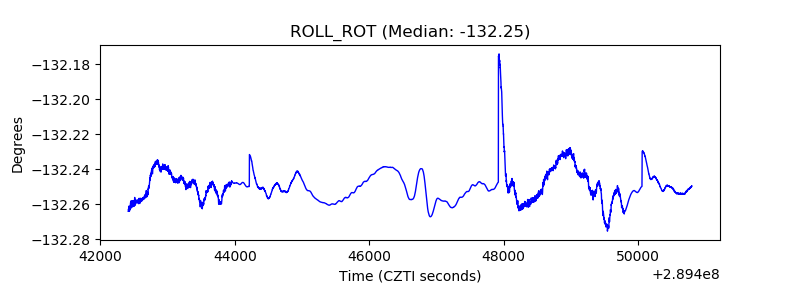 |
| _Roll_DEC | 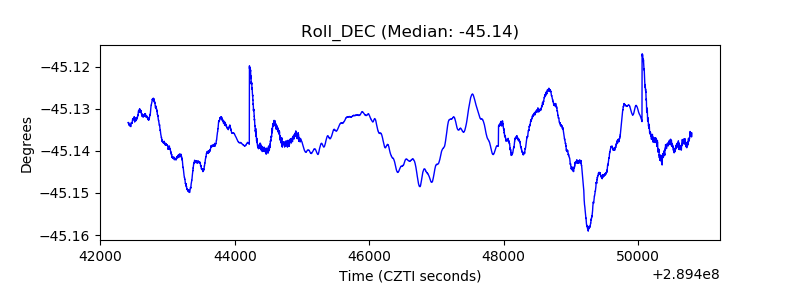 |
| _Roll_RA | 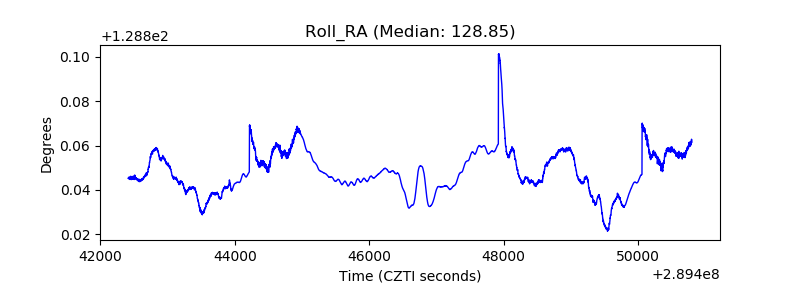 |
| Veto Counter | 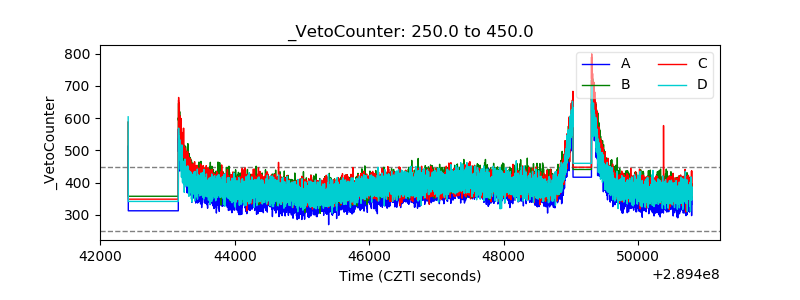 |