| Param | Original file | Final file |
|---|---|---|
| Filename | modeM0/AS1A05_188T01_9000002756_18562cztM0_level2.evt | modeM0/AS1A05_188T01_9000002756_18562cztM0_level2_quad_clean.evt |
| Size (bytes) | 548,547,840 | 84,504,960 |
| Size | 523.1 MB | 80.6 MB |
| Events in quadrant A | 3,908,048 | 517,135 |
| Events in quadrant B | 3,670,121 | 532,094 |
| Events in quadrant C | 3,508,191 | 504,002 |
| Events in quadrant D | 5,015,341 | 481,652 |
| Mode SS | |||
|---|---|---|---|
| Quadrant | BADHDUFLAG | Total packets | Discarded packets |
| A | 0 | 152 | 0 |
| B | 0 | 152 | 0 |
| C | 0 | 152 | 0 |
| D | 0 | 152 | 0 |
| Mode M9 | |||
|---|---|---|---|
| Quadrant | BADHDUFLAG | Total packets | Discarded packets |
| A | 0 | 4 | 0 |
| B | 0 | 4 | 0 |
| C | 0 | 4 | 0 |
| D | 0 | 4 | 0 |
| Mode M0 | |||
|---|---|---|---|
| Quadrant | BADHDUFLAG | Total packets | Discarded packets |
| A | 0 | 16717 | 2 |
| B | 0 | 15880 | 2 |
| C | 0 | 15440 | 3 |
| D | 0 | 20131 | 2 |
| Quadrant | Total seconds | Saturated seconds | Saturation percentage |
|---|---|---|---|
| A | 7526 | 166 | 2.205687% |
| B | 7526 | 92 | 1.222429% |
| C | 7526 | 80 | 1.062982% |
| D | 7526 | 315 | 4.185490% |
Noise dominated data is calculated using 1-second bins in cleaned event files. If a bin has >2000 counts, and if more than 50% of those come from <1% of pixels, then it is considered to be noise-dominated and hence unusable.
| Quadrant | # 1 sec bins | Bins with >0 counts | Bins with >2000 counts | High rate bins dominated by noise | Noise dominated (total time) | Noise dominated (detector-on time) | Marked lightcurve |
|---|---|---|---|---|---|---|---|
| A | 7936 | 7527 | 112 | 112 | 1.41% | 1.49% | 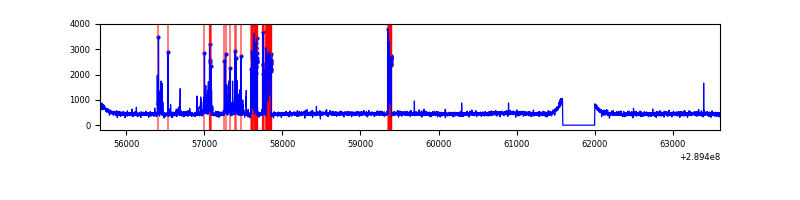 |
| B | 7936 | 7527 | 36 | 36 | 0.45% | 0.48% | 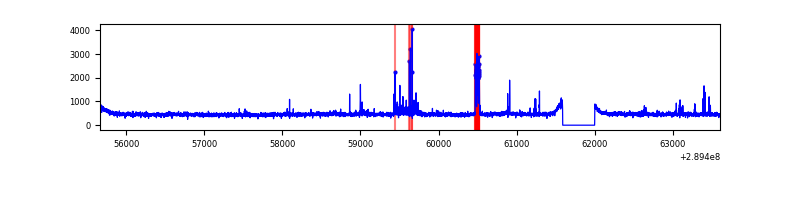 |
| C | 7936 | 7527 | 12 | 12 | 0.15% | 0.16% | 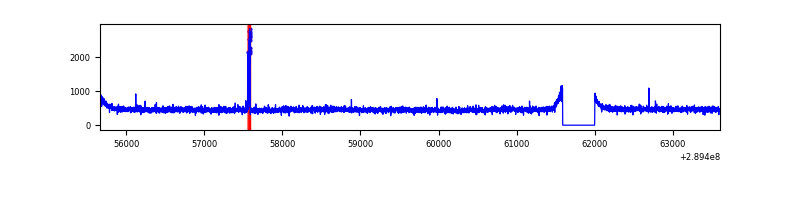 |
| D | 7936 | 7527 | 204 | 204 | 2.57% | 2.71% | 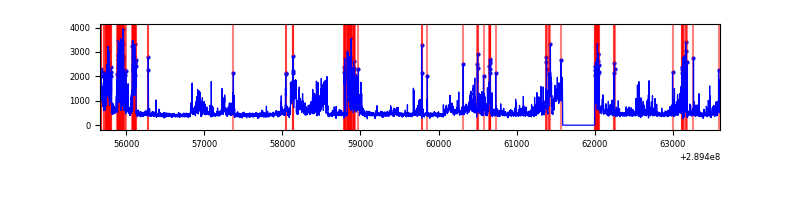 |
Top three noisy pixels from each quadrant. If the there are fewer than three noisy pixels in the level2.evt file, extra rows are filled as -1
| Pixel properties | Quadrant properties | ||||||
|---|---|---|---|---|---|---|---|
| Quadrant | DetID | PixID | Counts | Sigma | Mean | Median | Sigma |
| A | 0 | 13 | 521830 | 2942.51 | 875 | 856 | 177.1 |
| A | 13 | 254 | 12256 | 64.39 | 875 | 856 | 177.1 |
| A | 0 | 226 | 7474 | 37.38 | 875 | 856 | 177.1 |
| B | 12 | 18 | 78682 | 455.15 | 889 | 866 | 171.0 |
| B | 7 | 220 | 55994 | 322.45 | 889 | 866 | 171.0 |
| B | 4 | 80 | 23148 | 130.33 | 889 | 866 | 171.0 |
| C | 14 | 238 | 132401 | 657.88 | 849 | 855 | 200.0 |
| C | 9 | 54 | 45201 | 221.78 | 849 | 855 | 200.0 |
| C | 8 | 128 | 11968 | 55.58 | 849 | 855 | 200.0 |
| D | 7 | 238 | 1309185 | 6340.06 | 844 | 817 | 206.4 |
| D | 1 | 52 | 442068 | 2138.2 | 844 | 817 | 206.4 |
| D | 7 | 38 | 50965 | 243.0 | 844 | 817 | 206.4 |
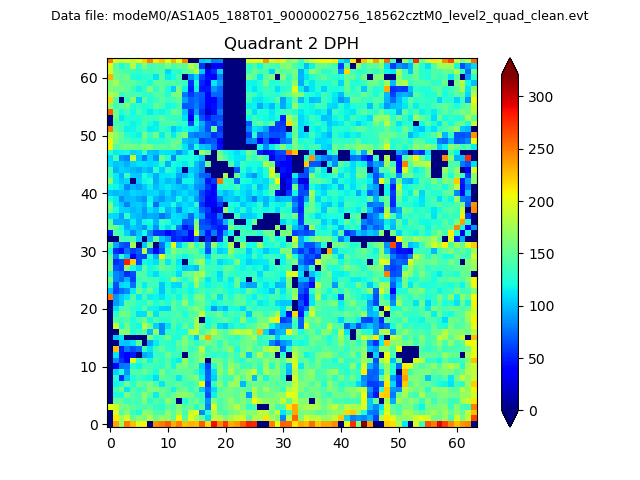
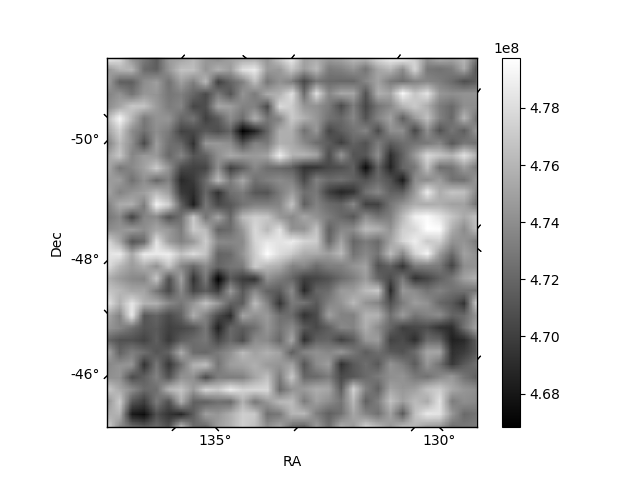
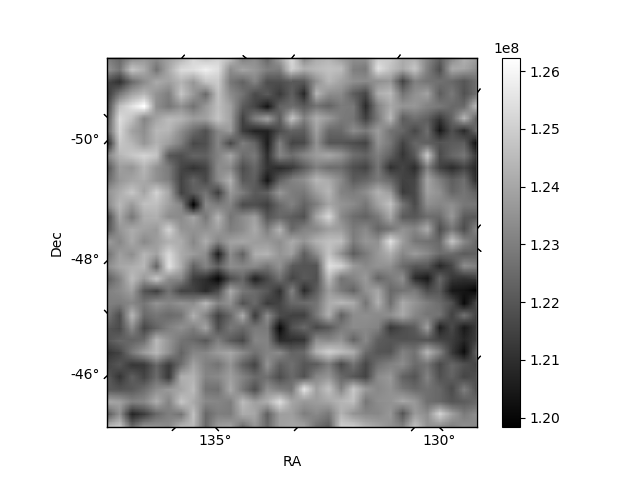
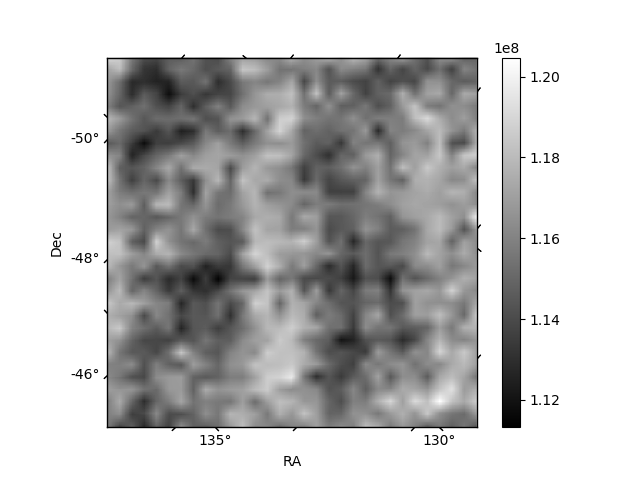
Histogram calculated using DETX and DETY for each event in the final _common_clean file
| Quadrant A | 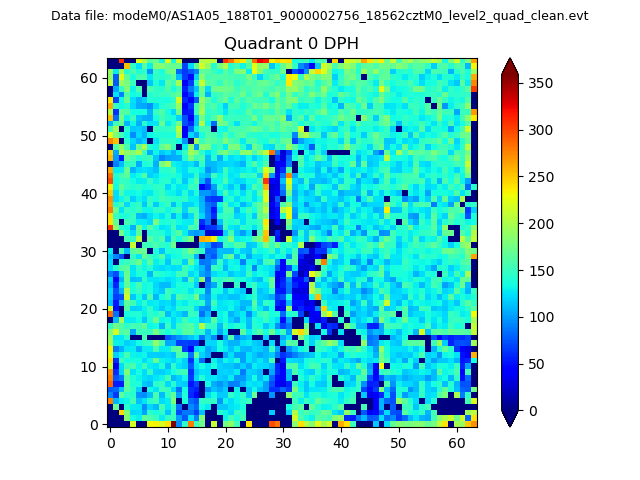 |
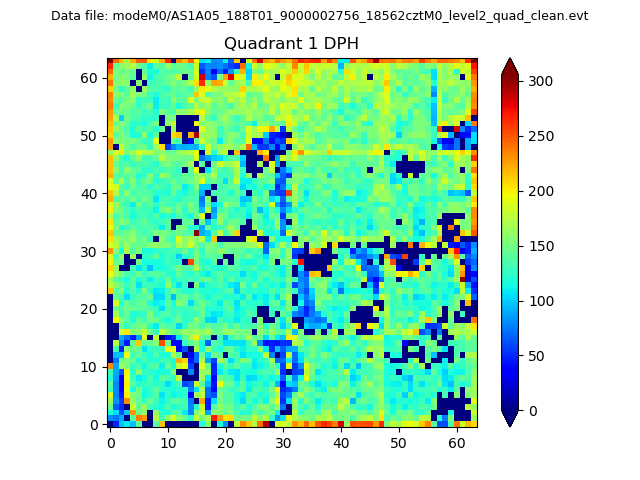 |
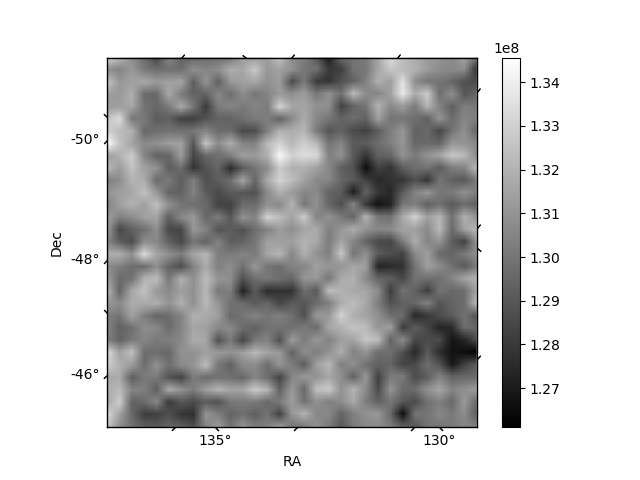
Quadrant B |
|---|---|---|---|
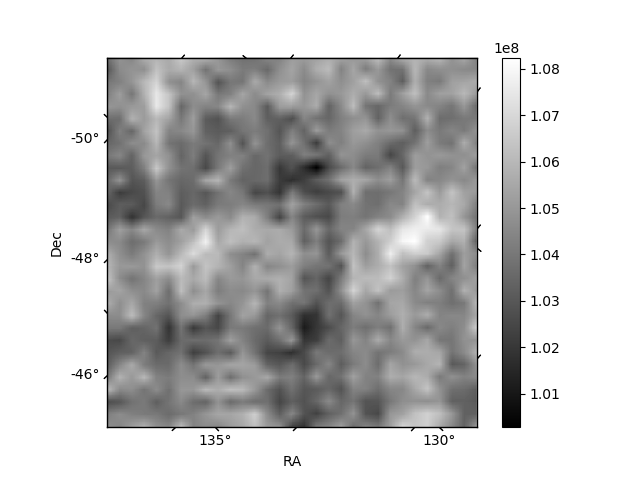
| Quadrant D | 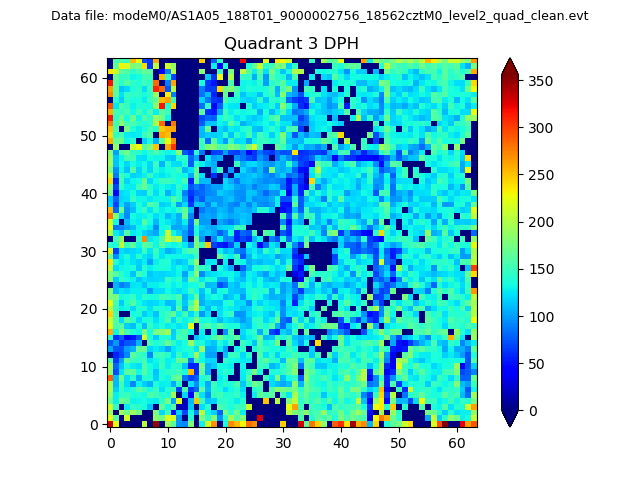 |
 |
Quadrant C |
| Plot type | Count rate plots | Images |
|---|---|---|
| Comparison with Poisson distribution Blue bars denote a histogram of data divided into 1 sec bins. Red curve is a Poisson curve with rate = median count rate of data. |
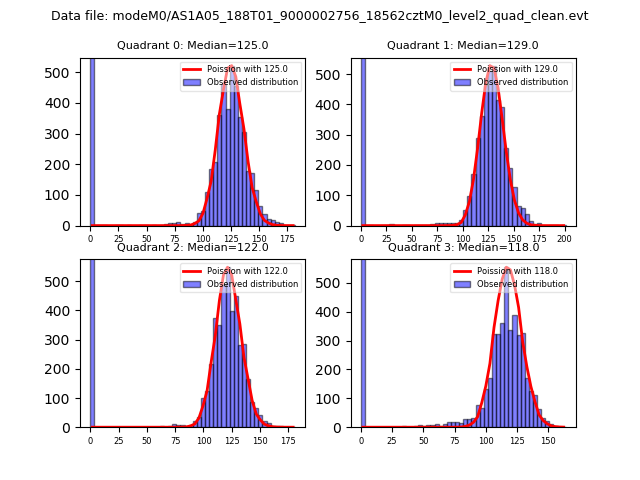 |
 |
| Quadrant-wise count rates Data is divided into 100 sec bins |
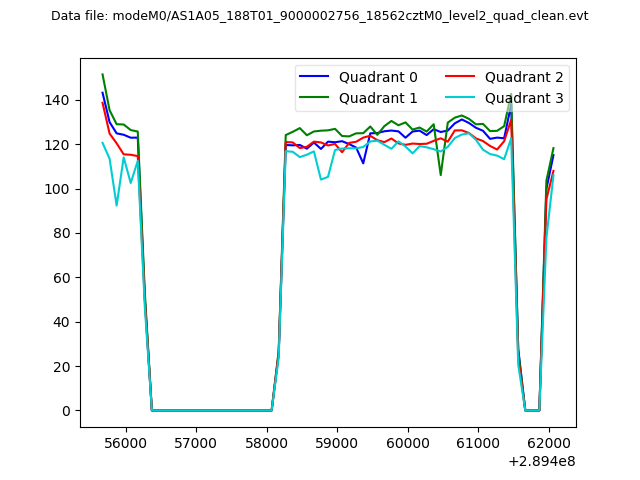 |
|
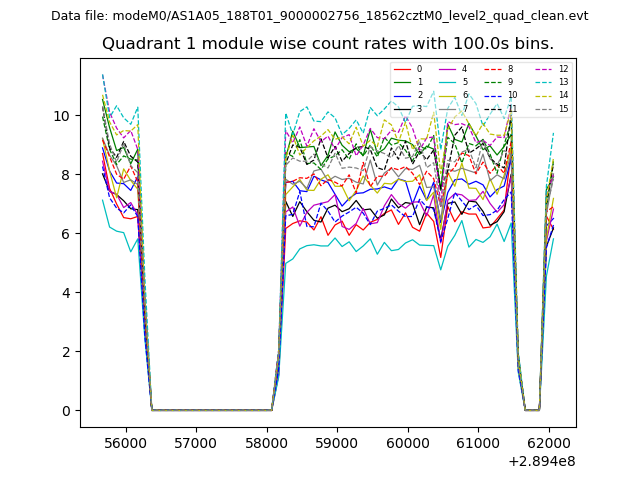
| Module-wise count rates for Quadrant A Data is divided into 100 sec bins |
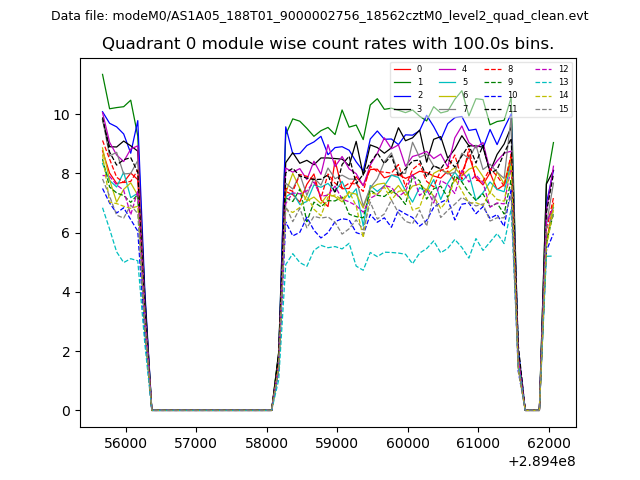 |
 |
| Module-wise count rates for Quadrant B Data is divided into 100 sec bins |
 |
 |
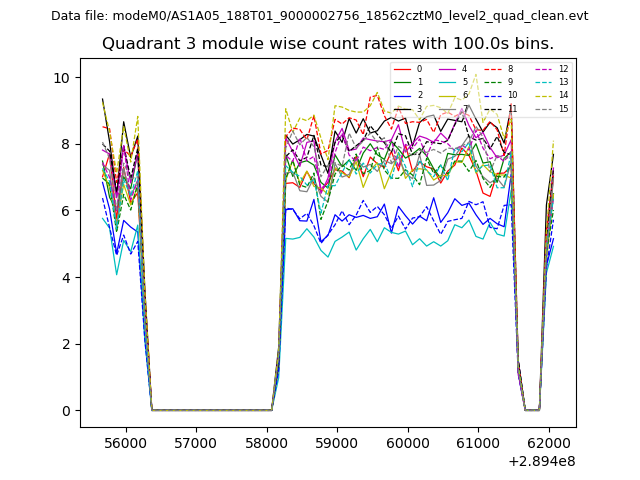
| Module-wise count rates for Quadrant C Data is divided into 100 sec bins |
 |
 |
| Module-wise count rates for Quadrant D Data is divided into 100 sec bins |
 |
 |
| Parameter | Plot |
|---|---|
| CZT HV Monitor | 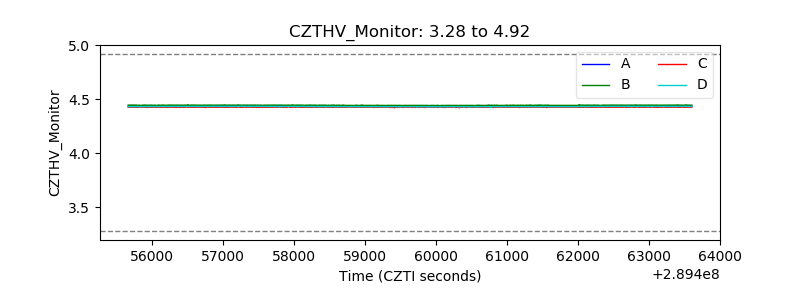 |
| D_VDD | 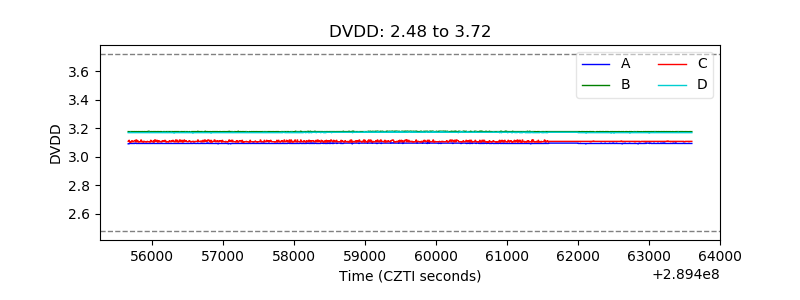 |
| Temperature 1 | 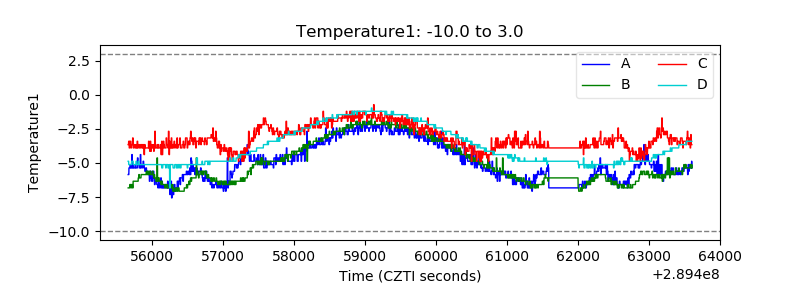 |
| Veto HV Monitor | 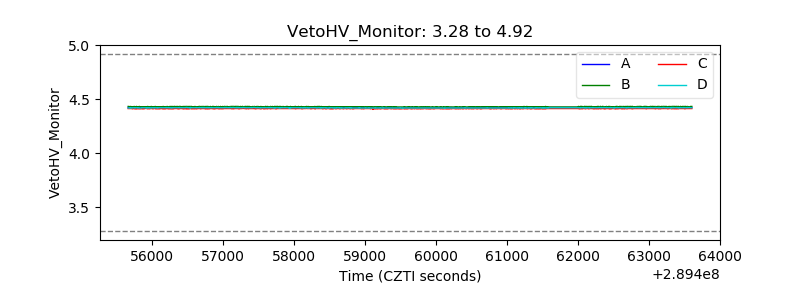 |
| Veto LLD | 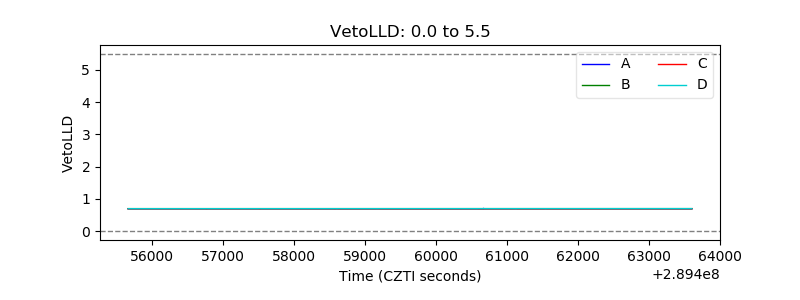 |
| Alpha Counter |  |
| _CPM_Rate | 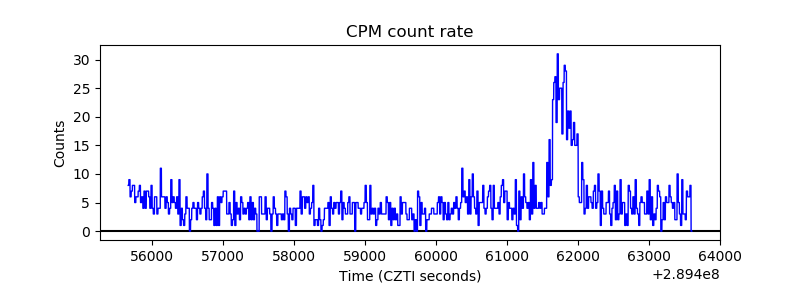 |
| CZT Counter | 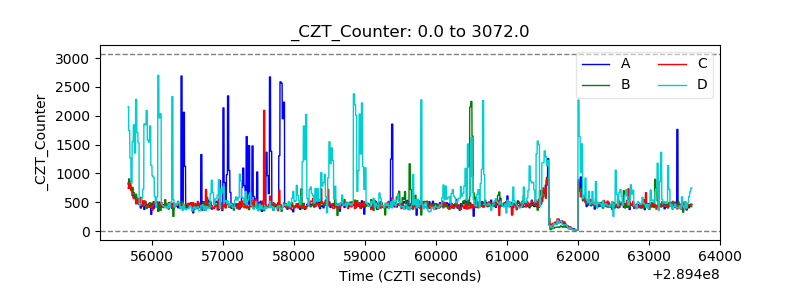 |
| +2.5 Volts monitor | 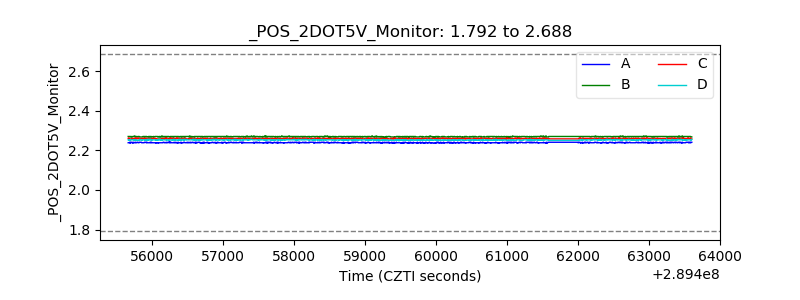 |
| +5 Volts monitor |  |
| _ROLL_ROT |  |
| _Roll_DEC | 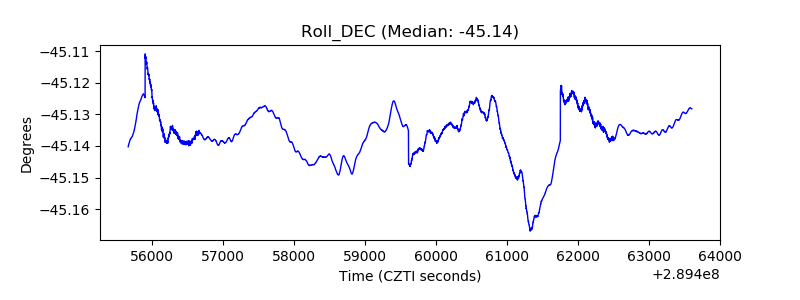 |
| _Roll_RA |  |
| Veto Counter |  |