| Param | Original file | Final file |
|---|---|---|
| Filename | modeM0/AS1A05_188T01_9000002756_18564cztM0_level2.evt | modeM0/AS1A05_188T01_9000002756_18564cztM0_level2_quad_clean.evt |
| Size (bytes) | 284,829,120 | 46,572,480 |
| Size | 271.6 MB | 44.4 MB |
| Events in quadrant A | 1,880,969 | 279,888 |
| Events in quadrant B | 2,021,639 | 288,082 |
| Events in quadrant C | 1,894,204 | 275,641 |
| Events in quadrant D | 2,538,076 | 265,953 |
| Mode SS | |||
|---|---|---|---|
| Quadrant | BADHDUFLAG | Total packets | Discarded packets |
| A | 0 | 86 | 0 |
| B | 0 | 86 | 0 |
| C | 0 | 86 | 0 |
| D | 0 | 86 | 0 |
| Mode M0 | |||
|---|---|---|---|
| Quadrant | BADHDUFLAG | Total packets | Discarded packets |
| A | 0 | 8541 | 0 |
| B | 0 | 8847 | 0 |
| C | 0 | 8542 | 0 |
| D | 0 | 10464 | 0 |
| Quadrant | Total seconds | Saturated seconds | Saturation percentage |
|---|---|---|---|
| A | 4260 | 1 | 0.023474% |
| B | 4261 | 20 | 0.469373% |
| C | 4261 | 12 | 0.281624% |
| D | 4261 | 106 | 2.487679% |
Noise dominated data is calculated using 1-second bins in cleaned event files. If a bin has >2000 counts, and if more than 50% of those come from <1% of pixels, then it is considered to be noise-dominated and hence unusable.
| Quadrant | # 1 sec bins | Bins with >0 counts | Bins with >2000 counts | High rate bins dominated by noise | Noise dominated (total time) | Noise dominated (detector-on time) | Marked lightcurve |
|---|---|---|---|---|---|---|---|
| A | 4260 | 4260 | 0 | 0 | 0.00% | 0.00% |  |
| B | 4261 | 4261 | 11 | 11 | 0.26% | 0.26% |  |
| C | 4261 | 4261 | 0 | 0 | 0.00% | 0.00% |  |
| D | 4261 | 4261 | 61 | 61 | 1.43% | 1.43% |  |
Top three noisy pixels from each quadrant. If the there are fewer than three noisy pixels in the level2.evt file, extra rows are filled as -1
| Pixel properties | Quadrant properties | ||||||
|---|---|---|---|---|---|---|---|
| Quadrant | DetID | PixID | Counts | Sigma | Mean | Median | Sigma |
| A | 4 | 2 | 8362 | 79.7 | 485 | 474 | 99.0 |
| A | 13 | 254 | 6615 | 62.05 | 485 | 474 | 99.0 |
| A | 0 | 226 | 4222 | 37.87 | 485 | 474 | 99.0 |
| B | 4 | 80 | 108563 | 1148.43 | 487 | 475 | 94.1 |
| B | 12 | 111 | 11259 | 114.58 | 487 | 475 | 94.1 |
| B | 11 | 111 | 9679 | 97.79 | 487 | 475 | 94.1 |
| C | 14 | 238 | 73881 | 667.5 | 465 | 468 | 110.0 |
| C | 9 | 54 | 6225 | 52.34 | 465 | 468 | 110.0 |
| C | 13 | 61 | 3345 | 26.16 | 465 | 468 | 110.0 |
| D | 1 | 52 | 588317 | 5105.95 | 466 | 451 | 115.1 |
| D | 7 | 238 | 170602 | 1477.86 | 466 | 451 | 115.1 |
| D | 2 | 234 | 18945 | 160.63 | 466 | 451 | 115.1 |
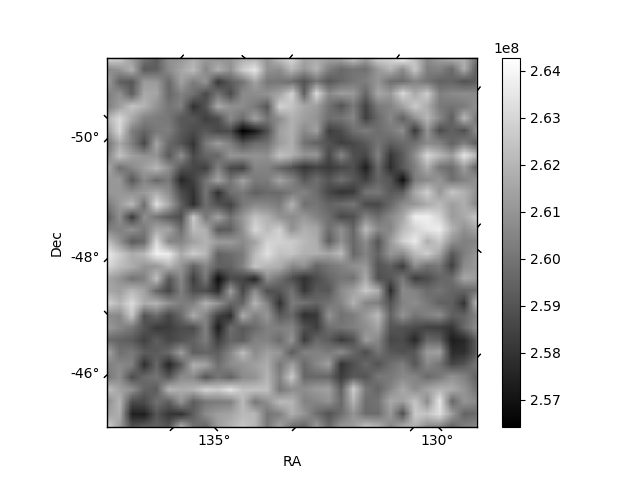
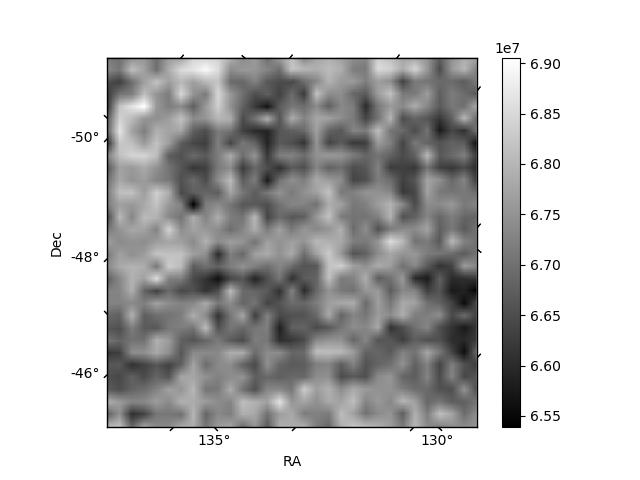
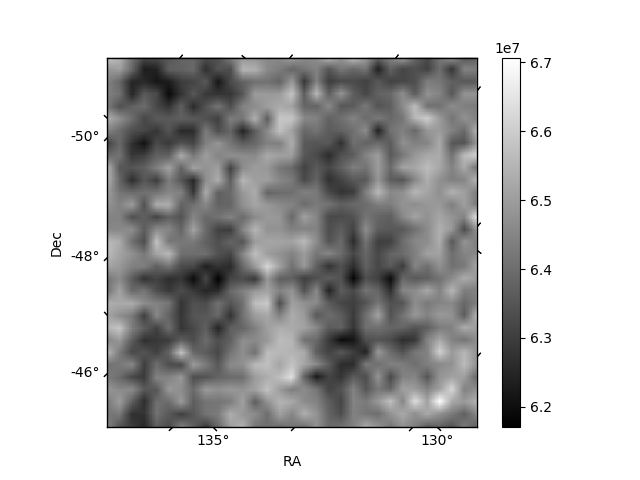
Histogram calculated using DETX and DETY for each event in the final _common_clean file
| Quadrant A | 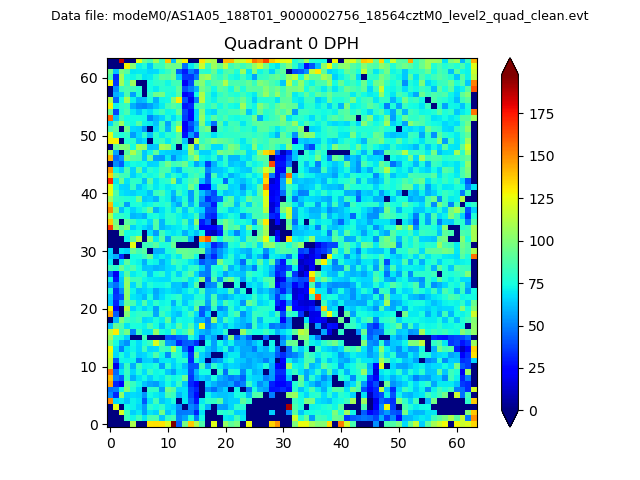 |
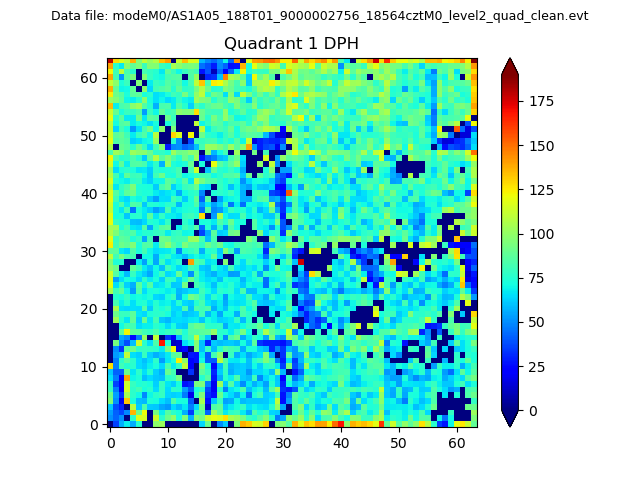 |
Quadrant B |
|---|---|---|---|
| Quadrant D | 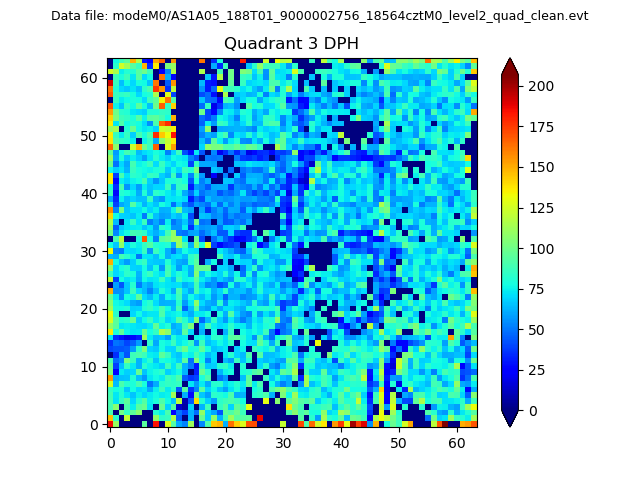 |
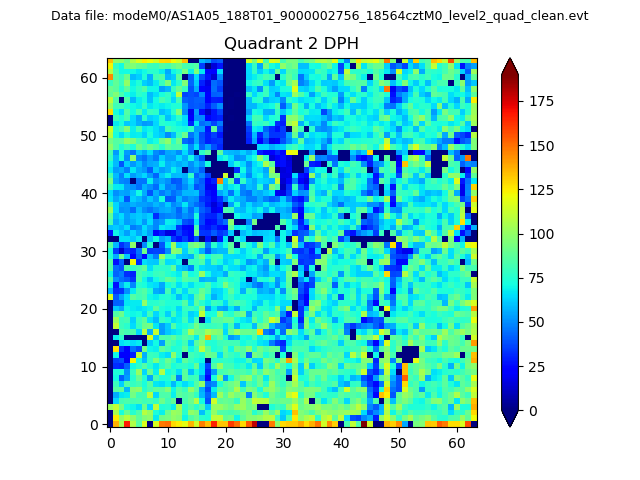 |
Quadrant C |
| Plot type | Count rate plots | Images |
|---|---|---|
| Comparison with Poisson distribution Blue bars denote a histogram of data divided into 1 sec bins. Red curve is a Poisson curve with rate = median count rate of data. |
 |
 |
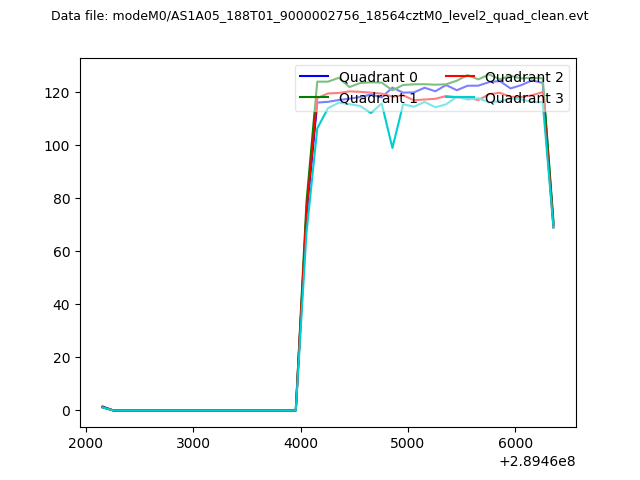
| Quadrant-wise count rates Data is divided into 100 sec bins |
 |
|
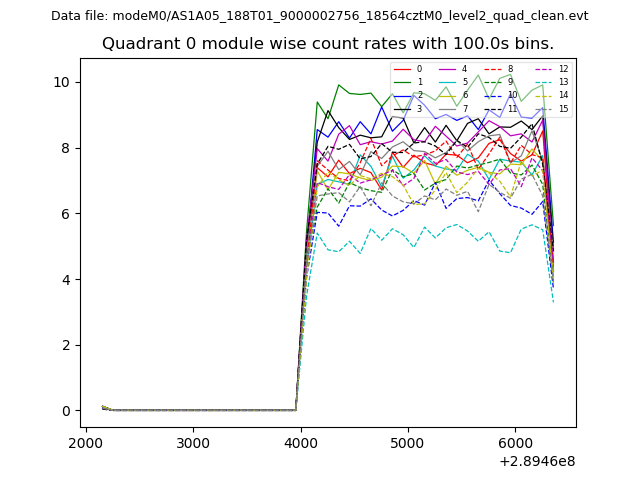
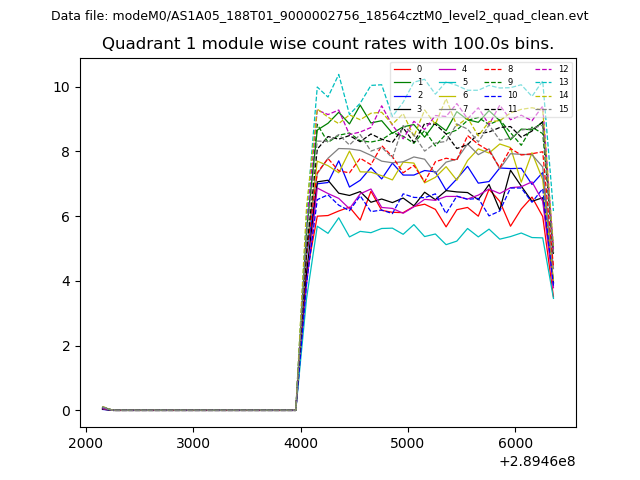
| Module-wise count rates for Quadrant A Data is divided into 100 sec bins |
 |
 |
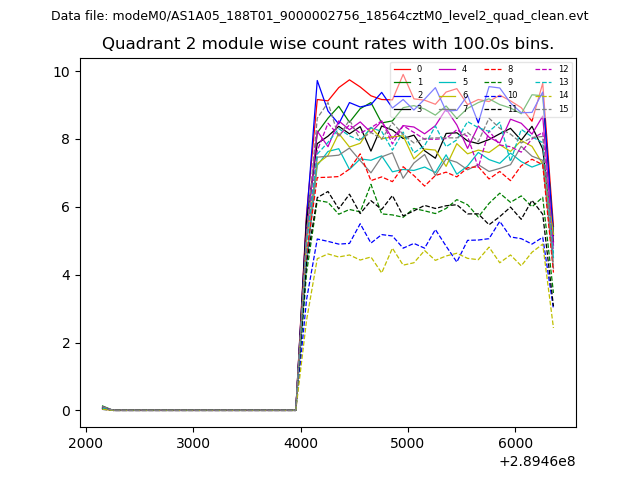
| Module-wise count rates for Quadrant B Data is divided into 100 sec bins |
 |
 |
| Module-wise count rates for Quadrant C Data is divided into 100 sec bins |
 |
 |
| Module-wise count rates for Quadrant D Data is divided into 100 sec bins |
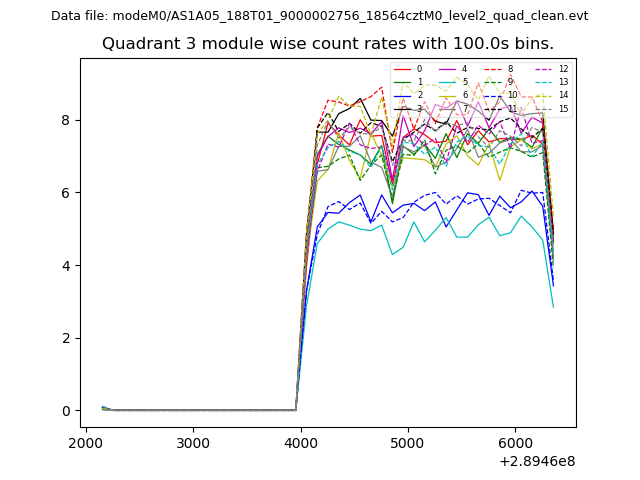 |
 |
| Parameter | Plot |
|---|---|
| CZT HV Monitor | 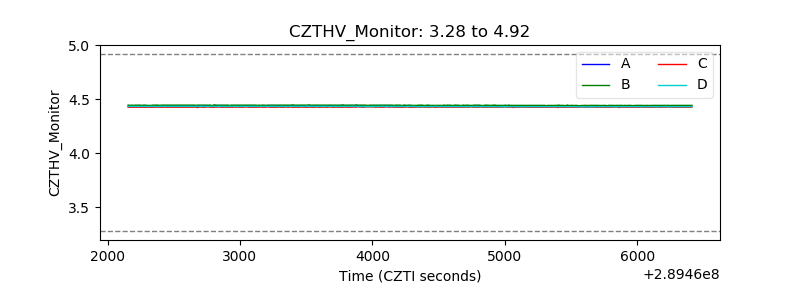 |
| D_VDD | 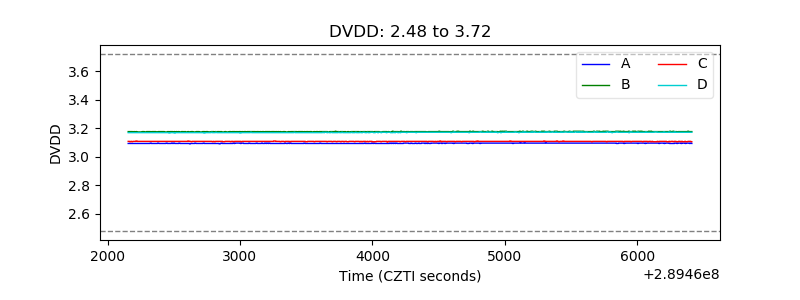 |
| Temperature 1 | 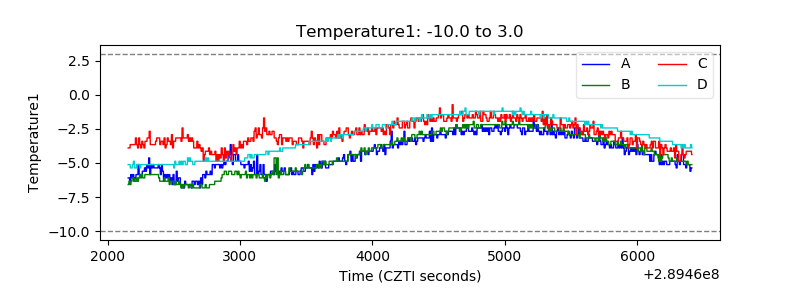 |
| Veto HV Monitor | 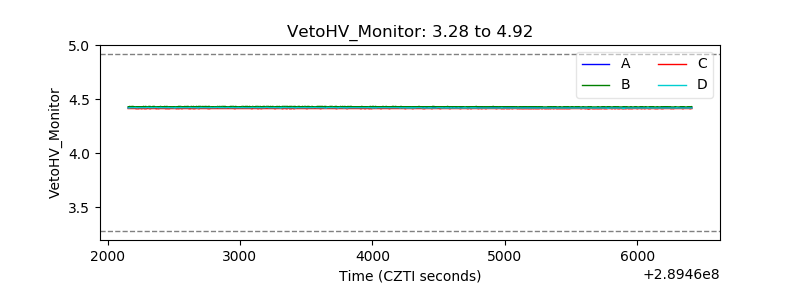 |
| Veto LLD | 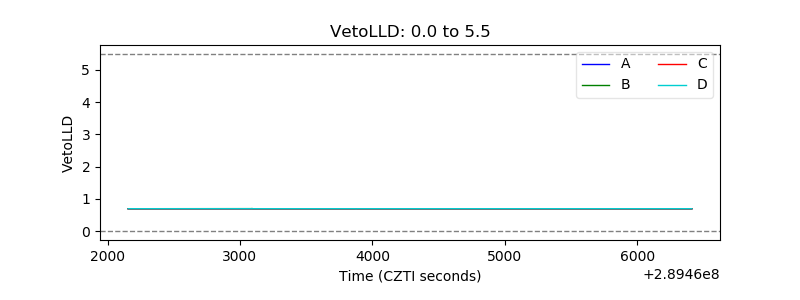 |
| Alpha Counter | 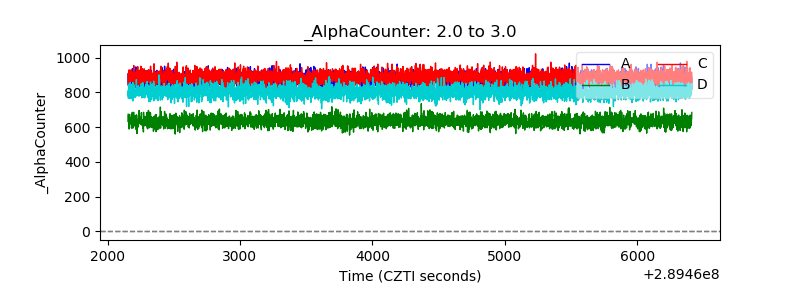 |
| _CPM_Rate | 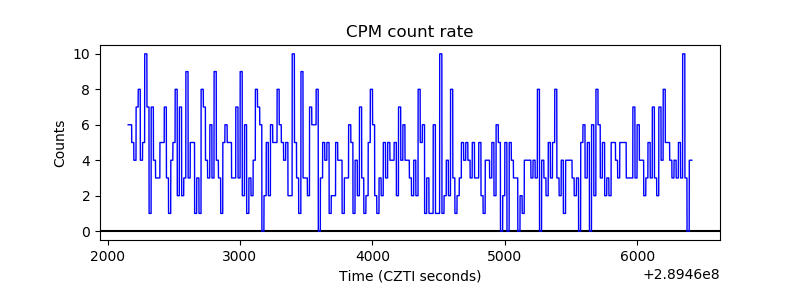 |
| CZT Counter | 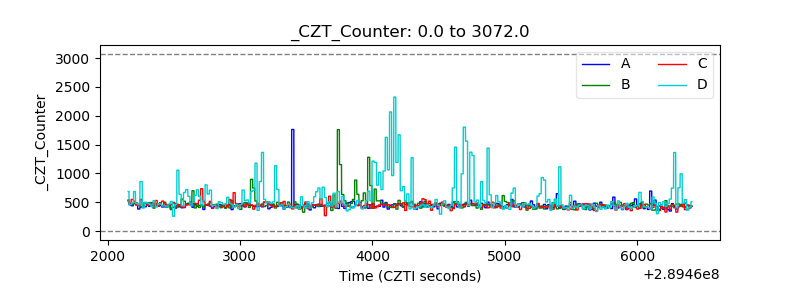 |
| +2.5 Volts monitor |  |
| +5 Volts monitor | 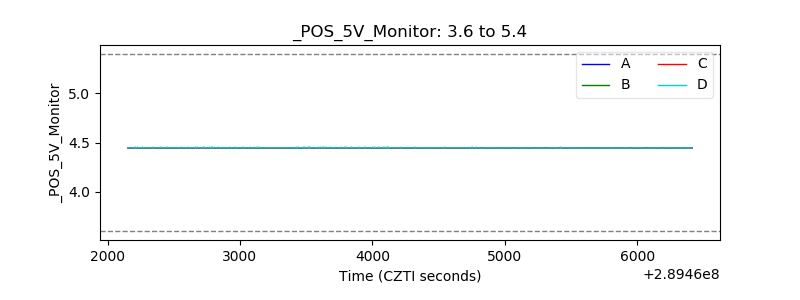 |
| _ROLL_ROT | 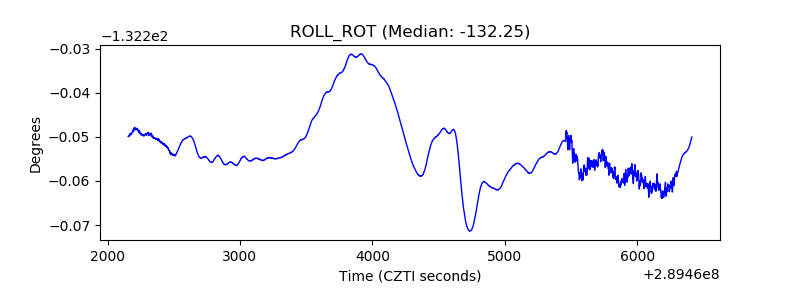 |
| _Roll_DEC | 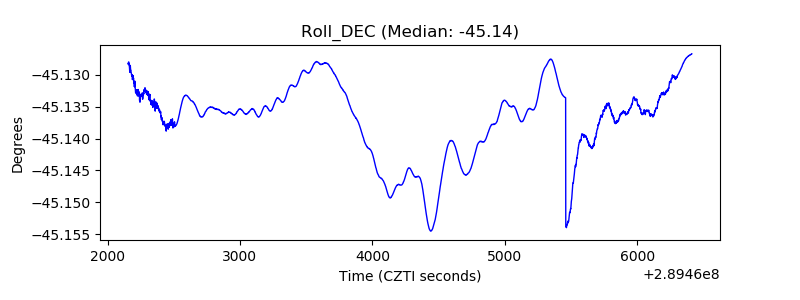 |
| _Roll_RA | 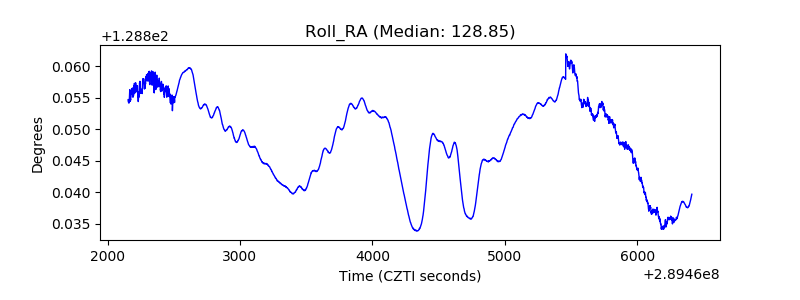 |
| Veto Counter | 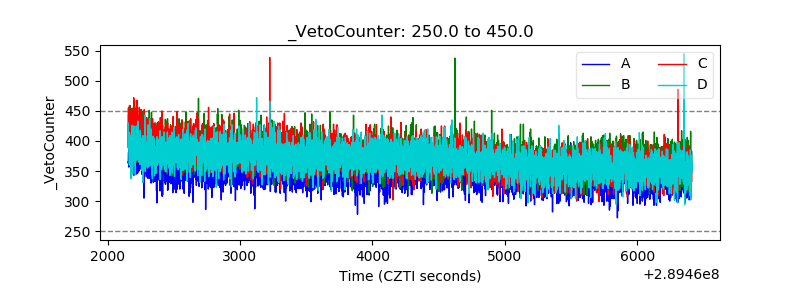 |