| Param | Original file | Final file |
|---|---|---|
| Filename | modeM0/AS1A05_075T07_9000002760cztM0_level2.fits | modeM0/AS1A05_075T07_9000002760cztM0_level2_quad_clean.evt |
| Size (bytes) | 395,349,120 | 371,427,840 |
| Size | 377.0 MB | 354.2 MB |
| Events in quadrant A | 2,393,296 | 2,169,138 |
| Events in quadrant B | 2,328,244 | 2,212,378 |
| Events in quadrant C | 2,362,492 | 2,087,735 |
| Events in quadrant D | 1,991,844 | 1,883,781 |
| Mode M9 | |||
|---|---|---|---|
| Quadrant | BADHDUFLAG | Total packets | Discarded packets |
| A | 0 | 36 | 0 |
| B | 0 | 36 | 0 |
| C | 0 | 36 | 0 |
| D | 0 | 36 | 0 |
| Mode M0 | |||
|---|---|---|---|
| Quadrant | BADHDUFLAG | Total packets | Discarded packets |
| A | 0 | 89200 | 0 |
| B | 0 | 87235 | 0 |
| C | 0 | 94844 | 0 |
| D | 0 | 121338 | 0 |
| Mode SS | |||
|---|---|---|---|
| Quadrant | BADHDUFLAG | Total packets | Discarded packets |
| A | 0 | 856 | 0 |
| B | 0 | 856 | 0 |
| C | 0 | 856 | 0 |
| D | 0 | 856 | 0 |
| Quadrant | Total seconds | Saturated seconds | Saturation percentage |
|---|---|---|---|
| A | 42177 | 789 | 1.870688% |
| B | 42177 | 662 | 1.569576% |
| C | 42177 | 1403 | 3.326458% |
| D | 42177 | 3568 | 8.459587% |
Noise dominated data is calculated using 1-second bins in cleaned event files. If a bin has >2000 counts, and if more than 50% of those come from <1% of pixels, then it is considered to be noise-dominated and hence unusable.
| Quadrant | # 1 sec bins | Bins with >0 counts | Bins with >2000 counts | High rate bins dominated by noise | Noise dominated (total time) | Noise dominated (detector-on time) | Marked lightcurve |
|---|---|---|---|---|---|---|---|
| A | 45632 | 42166 | 0 | 0 | 0.00% | 0.00% |  |
| B | 45632 | 42174 | 0 | 0 | 0.00% | 0.00% |  |
| C | 45632 | 42174 | 0 | 0 | 0.00% | 0.00% | 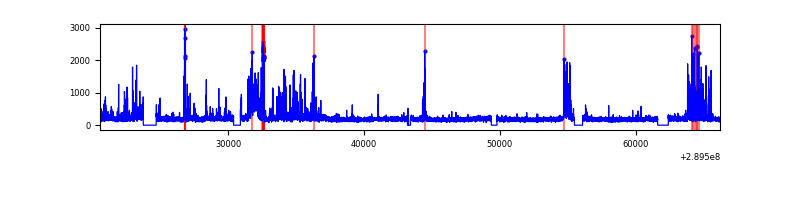 |
| D | 45632 | 42149 | 0 | 0 | 0.00% | 0.00% | 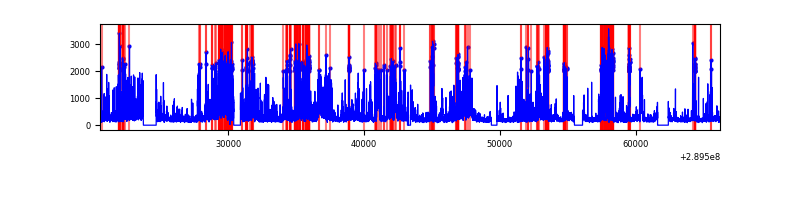 |
Top three noisy pixels from each quadrant. If the there are fewer than three noisy pixels in the level2.evt file, extra rows are filled as -1
| Pixel properties | Quadrant properties | ||||||
|---|---|---|---|---|---|---|---|
| Quadrant | DetID | PixID | Counts | Sigma | Mean | Median | Sigma |
| A | 0 | 29 | 2100 | 9.62 | 623 | 584 | 157.6 |
| A | 7 | 110 | 1881 | 8.23 | 623 | 584 | 157.6 |
| A | 0 | 30 | 1779 | 7.58 | 623 | 584 | 157.6 |
| B | 2 | 9 | 1926 | 10.83 | 614 | 582 | 124.1 |
| B | 2 | 8 | 1679 | 8.84 | 614 | 582 | 124.1 |
| B | 3 | 17 | 1588 | 8.11 | 614 | 582 | 124.1 |
| C | 1 | 80 | 1837 | 7.87 | 622 | 577 | 160.0 |
| C | 1 | 81 | 1803 | 7.66 | 622 | 577 | 160.0 |
| C | 3 | 126 | 1712 | 7.09 | 622 | 577 | 160.0 |
| D | 10 | 190 | 1528 | 6.67 | 567 | 514 | 151.9 |
| D | 3 | 14 | 1457 | 6.21 | 567 | 514 | 151.9 |
| D | 10 | 189 | 1428 | 6.02 | 567 | 514 | 151.9 |
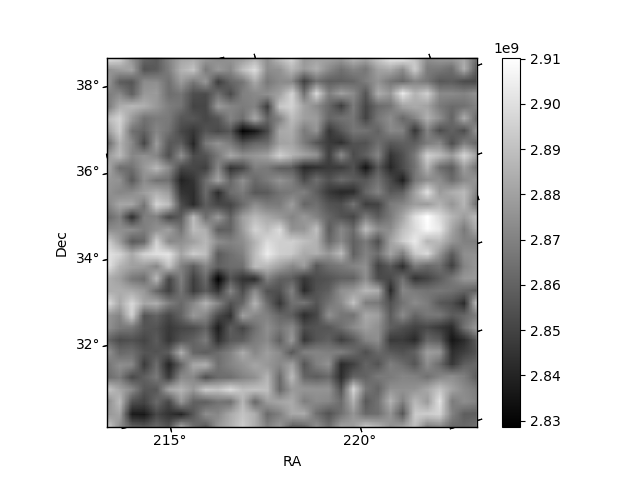
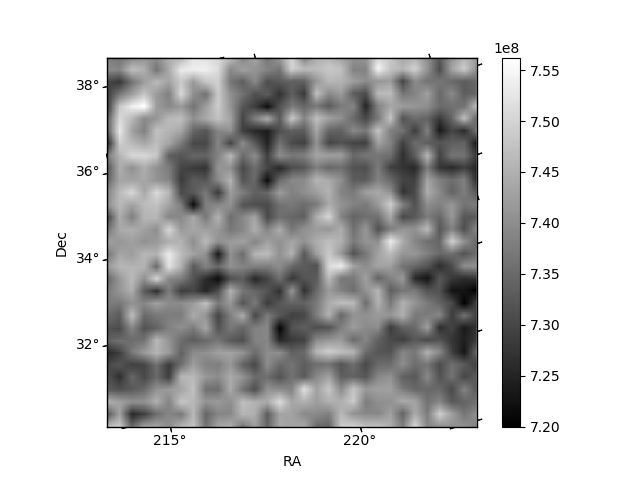
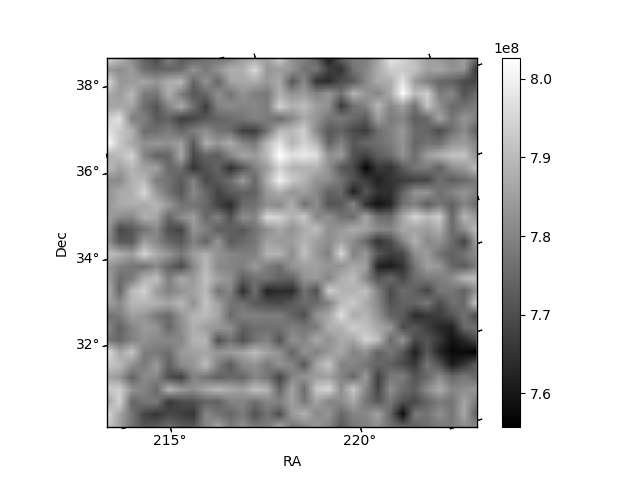
Histogram calculated using DETX and DETY for each event in the final _common_clean file
| Quadrant A | 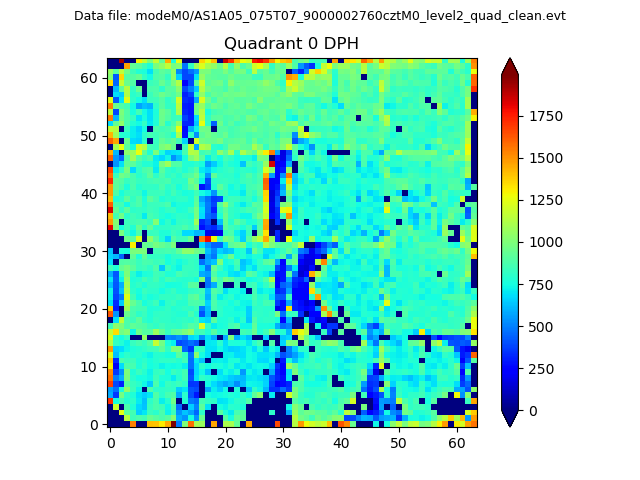 |
 |
Quadrant B |
|---|---|---|---|
| Quadrant D |  |
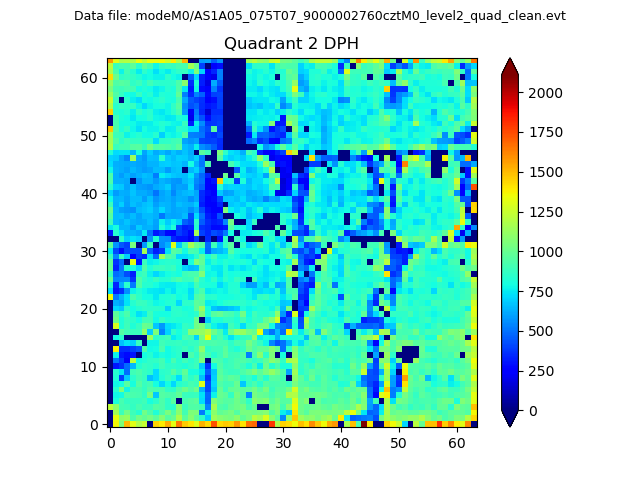 |
Quadrant C |
| Plot type | Count rate plots | Images |
|---|---|---|
| Comparison with Poisson distribution Blue bars denote a histogram of data divided into 1 sec bins. Red curve is a Poisson curve with rate = median count rate of data. |
 |
 |
| Quadrant-wise count rates Data is divided into 100 sec bins |
 |
|
| Module-wise count rates for Quadrant A Data is divided into 100 sec bins |
 |
 |
| Module-wise count rates for Quadrant B Data is divided into 100 sec bins |
 |
 |
| Module-wise count rates for Quadrant C Data is divided into 100 sec bins |
 |
 |
| Module-wise count rates for Quadrant D Data is divided into 100 sec bins |
 |
 |
| Parameter | Plot |
|---|---|
| CZT HV Monitor |  |
| D_VDD | 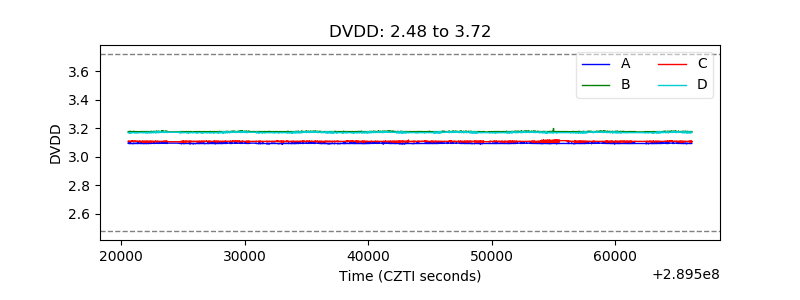 |
| Temperature 1 | 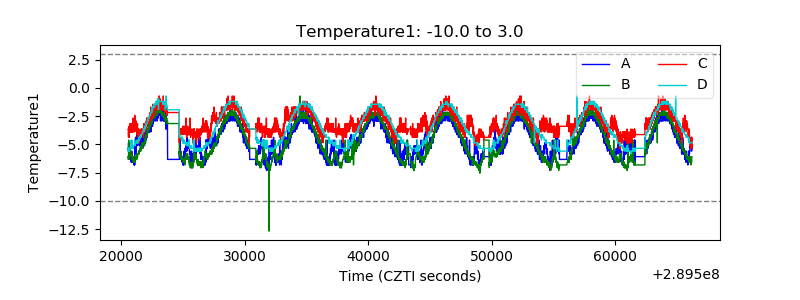 |
| Veto HV Monitor |  |
| Veto LLD |  |
| Alpha Counter |  |
| _CPM_Rate |  |
| CZT Counter |  |
| +2.5 Volts monitor | 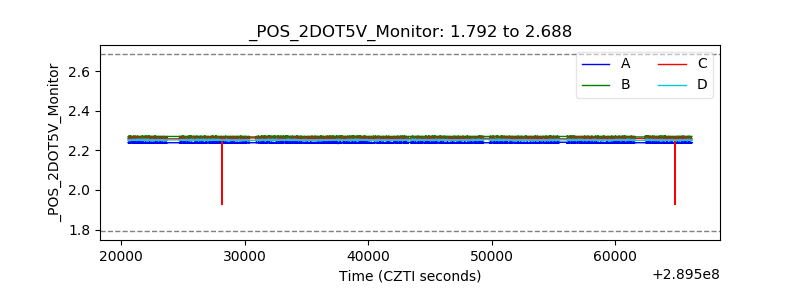 |
| +5 Volts monitor | 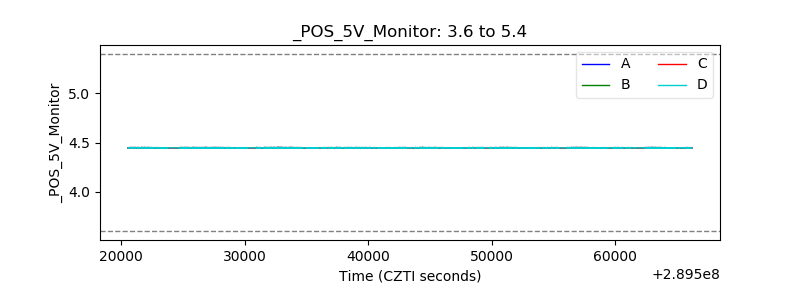 |
| _ROLL_ROT |  |
| _Roll_DEC |  |
| _Roll_RA | 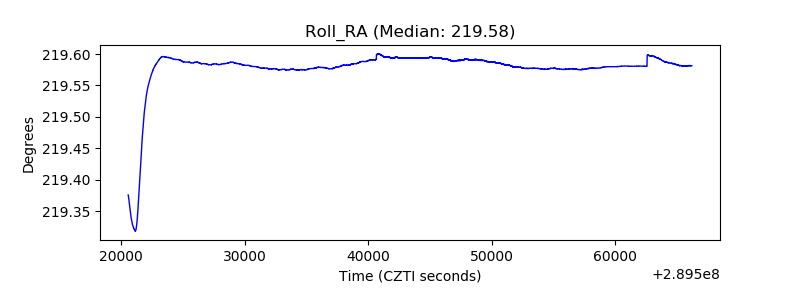 |
| Veto Counter |  |