| Param | Original file | Final file |
|---|---|---|
| Filename | modeM0/AS1A05_075T07_9000002760_18573cztM0_level2.evt | modeM0/AS1A05_075T07_9000002760_18573cztM0_level2_quad_clean.evt |
| Size (bytes) | 344,136,960 | 58,544,640 |
| Size | 328.2 MB | 55.8 MB |
| Events in quadrant A | 2,282,705 | 362,069 |
| Events in quadrant B | 2,247,781 | 375,188 |
| Events in quadrant C | 2,363,033 | 363,964 |
| Events in quadrant D | 3,217,466 | 350,223 |
| Mode M9 | |||
|---|---|---|---|
| Quadrant | BADHDUFLAG | Total packets | Discarded packets |
| A | 0 | 10 | 0 |
| B | 0 | 10 | 0 |
| C | 0 | 10 | 0 |
| D | 0 | 10 | 0 |
| Mode M0 | |||
|---|---|---|---|
| Quadrant | BADHDUFLAG | Total packets | Discarded packets |
| A | 0 | 9747 | 1 |
| B | 0 | 9654 | 1 |
| C | 0 | 9952 | 1 |
| D | 0 | 12729 | 1 |
| Mode SS | |||
|---|---|---|---|
| Quadrant | BADHDUFLAG | Total packets | Discarded packets |
| A | 0 | 92 | 0 |
| B | 0 | 92 | 0 |
| C | 0 | 92 | 0 |
| D | 0 | 92 | 0 |
| Quadrant | Total seconds | Saturated seconds | Saturation percentage |
|---|---|---|---|
| A | 4572 | 35 | 0.765529% |
| B | 4572 | 59 | 1.290464% |
| C | 4572 | 81 | 1.771654% |
| D | 4572 | 284 | 6.211724% |
Noise dominated data is calculated using 1-second bins in cleaned event files. If a bin has >2000 counts, and if more than 50% of those come from <1% of pixels, then it is considered to be noise-dominated and hence unusable.
| Quadrant | # 1 sec bins | Bins with >0 counts | Bins with >2000 counts | High rate bins dominated by noise | Noise dominated (total time) | Noise dominated (detector-on time) | Marked lightcurve |
|---|---|---|---|---|---|---|---|
| A | 5522 | 4573 | 0 | 0 | 0.00% | 0.00% |  |
| B | 5522 | 4573 | 2 | 2 | 0.04% | 0.04% |  |
| C | 5522 | 4573 | 4 | 4 | 0.07% | 0.09% |  |
| D | 5522 | 4573 | 191 | 191 | 3.46% | 4.18% | 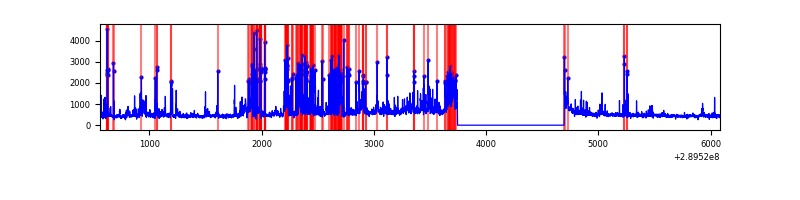 |
Top three noisy pixels from each quadrant. If the there are fewer than three noisy pixels in the level2.evt file, extra rows are filled as -1
| Pixel properties | Quadrant properties | ||||||
|---|---|---|---|---|---|---|---|
| Quadrant | DetID | PixID | Counts | Sigma | Mean | Median | Sigma |
| A | 14 | 111 | 98077 | 850.35 | 564 | 554 | 114.7 |
| A | 5 | 98 | 8039 | 65.26 | 564 | 554 | 114.7 |
| A | 13 | 254 | 7105 | 57.12 | 564 | 554 | 114.7 |
| B | 0 | 190 | 15764 | 138.31 | 566 | 551 | 110.0 |
| B | 12 | 111 | 12930 | 112.54 | 566 | 551 | 110.0 |
| B | 11 | 111 | 11267 | 97.42 | 566 | 551 | 110.0 |
| C | 14 | 238 | 84637 | 652.69 | 545 | 547 | 128.8 |
| C | 4 | 254 | 75064 | 578.39 | 545 | 547 | 128.8 |
| C | 9 | 54 | 66003 | 508.06 | 545 | 547 | 128.8 |
| D | 1 | 52 | 848399 | 6396.78 | 538 | 523 | 132.5 |
| D | 7 | 238 | 269547 | 2029.64 | 538 | 523 | 132.5 |
| D | 10 | 50 | 57401 | 429.11 | 538 | 523 | 132.5 |
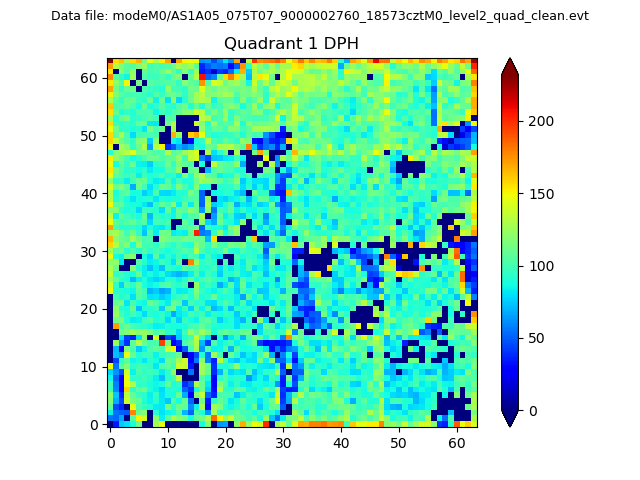
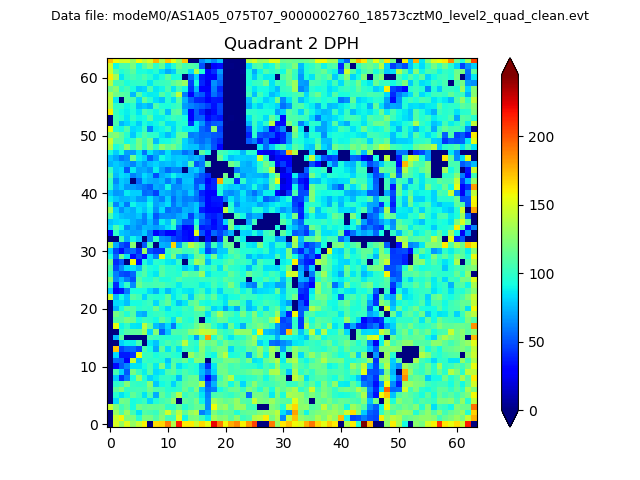
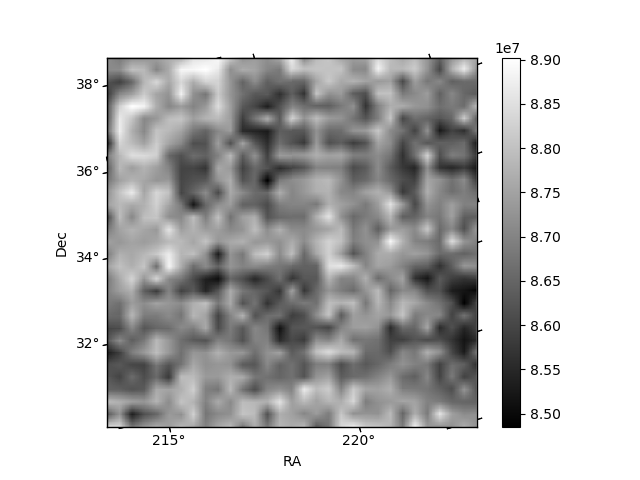
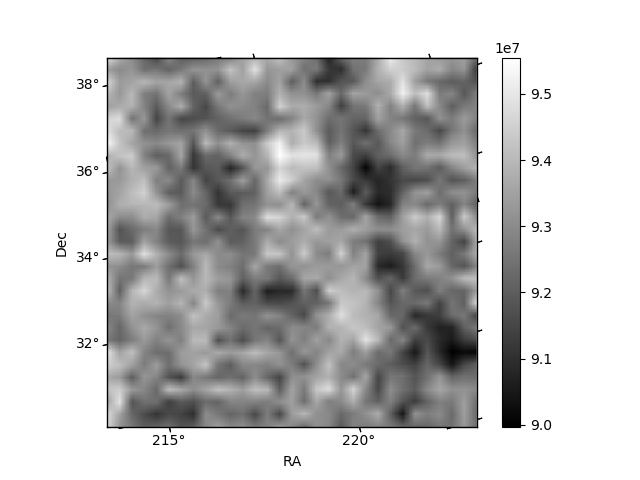
Histogram calculated using DETX and DETY for each event in the final _common_clean file
| Quadrant A |  |
 |
Quadrant B |
|---|---|---|---|
| Quadrant D |  |
 |
Quadrant C |
| Plot type | Count rate plots | Images |
|---|---|---|
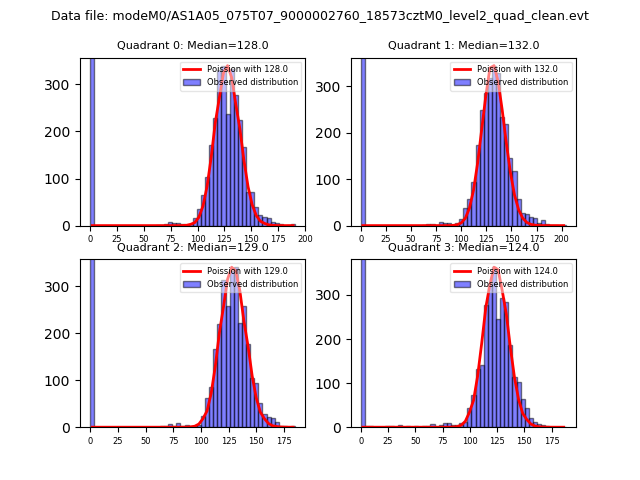
| Comparison with Poisson distribution Blue bars denote a histogram of data divided into 1 sec bins. Red curve is a Poisson curve with rate = median count rate of data. |
 |
 |
| Quadrant-wise count rates Data is divided into 100 sec bins |
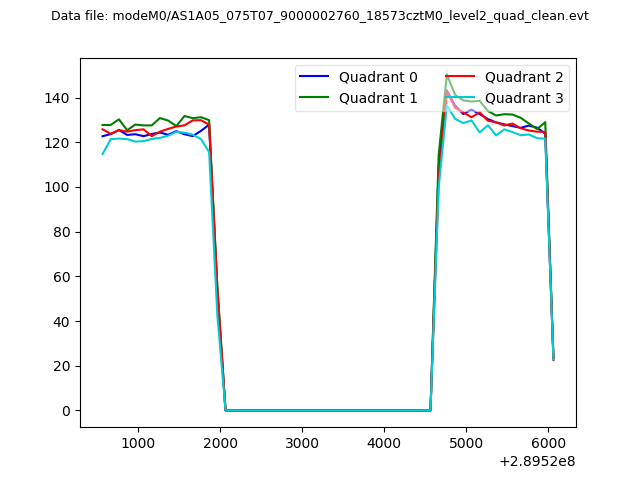 |
|
| Module-wise count rates for Quadrant A Data is divided into 100 sec bins |
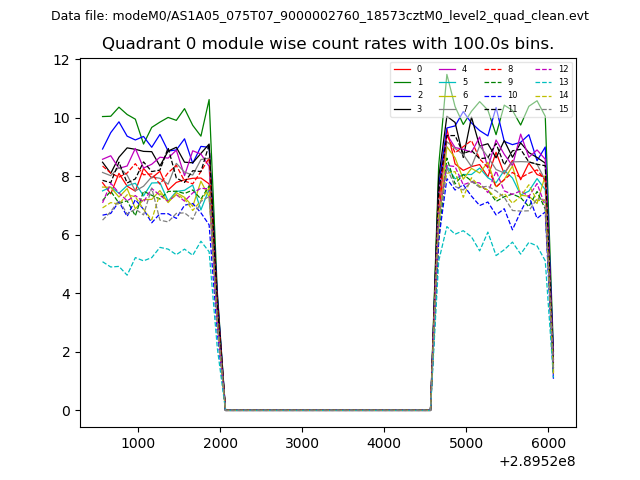 |
 |
| Module-wise count rates for Quadrant B Data is divided into 100 sec bins |
 |
 |
| Module-wise count rates for Quadrant C Data is divided into 100 sec bins |
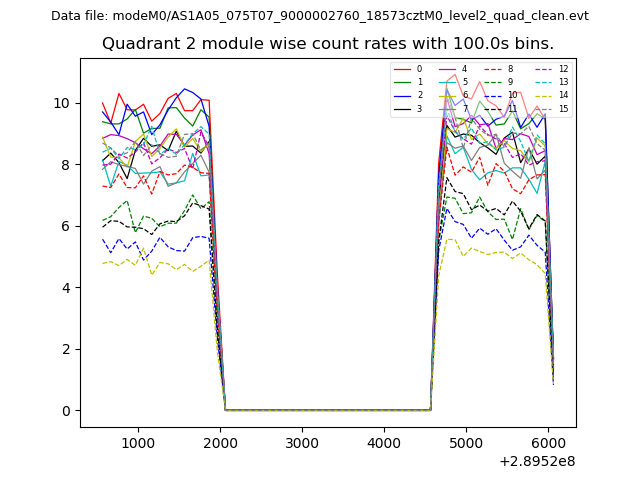 |
 |
| Module-wise count rates for Quadrant D Data is divided into 100 sec bins |
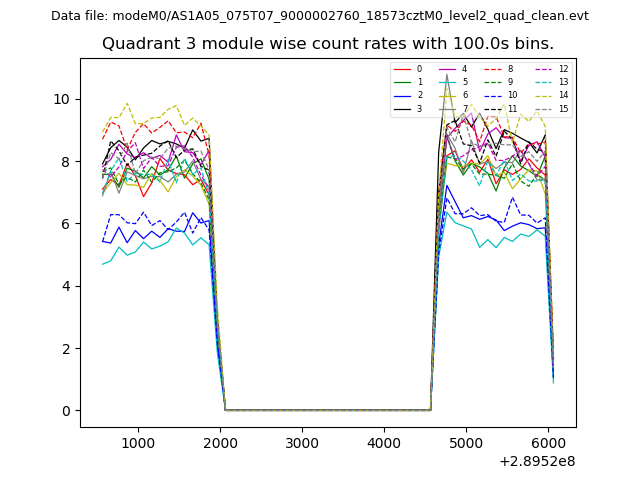 |
 |
| Parameter | Plot |
|---|---|
| CZT HV Monitor |  |
| D_VDD | 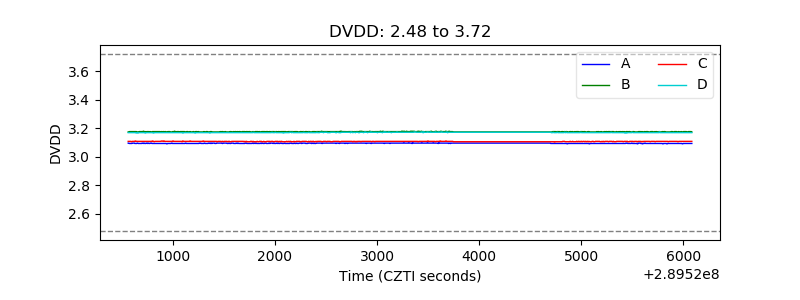 |
| Temperature 1 | 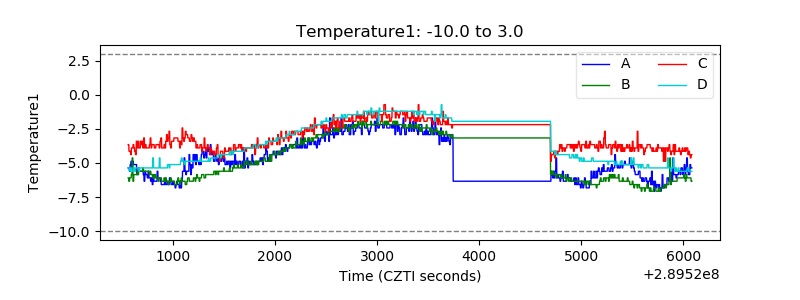 |
| Veto HV Monitor | 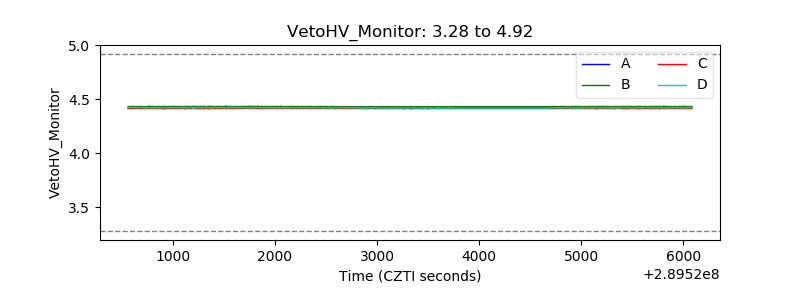 |
| Veto LLD | 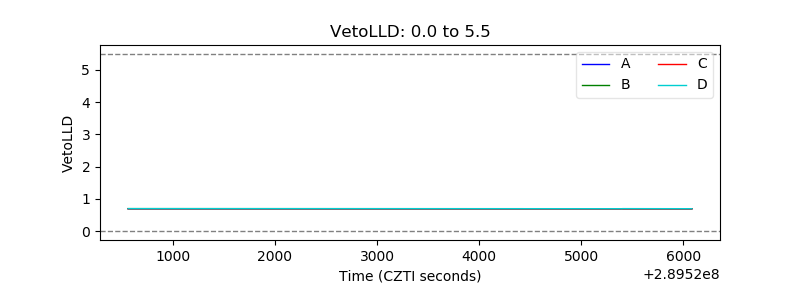 |
| Alpha Counter | 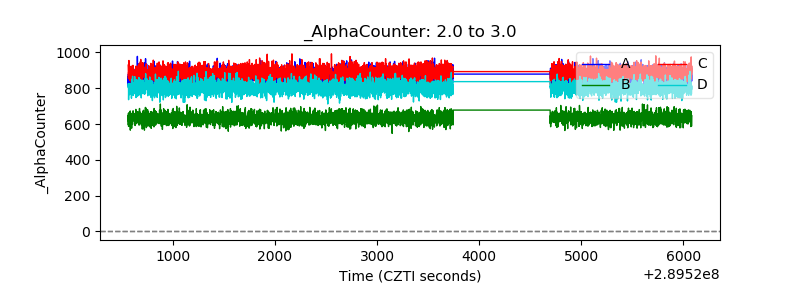 |
| _CPM_Rate | 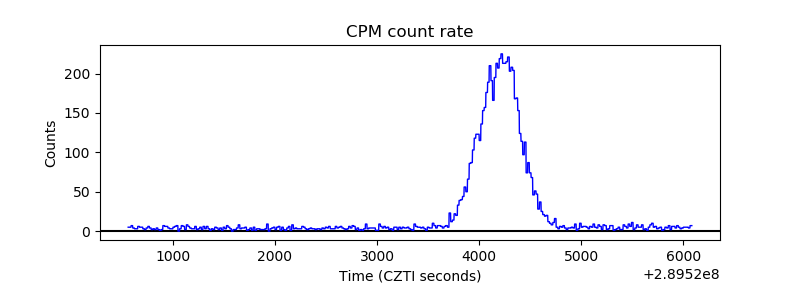 |
| CZT Counter | 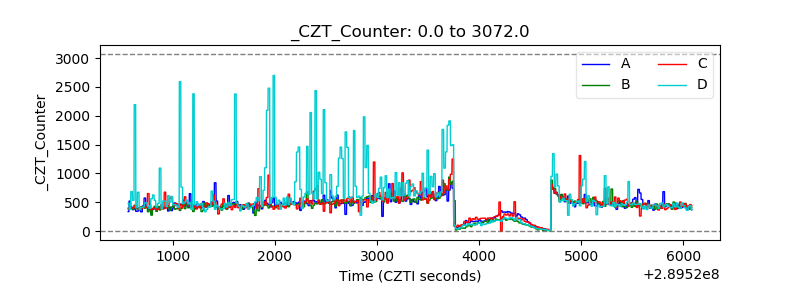 |
| +2.5 Volts monitor |  |
| +5 Volts monitor | 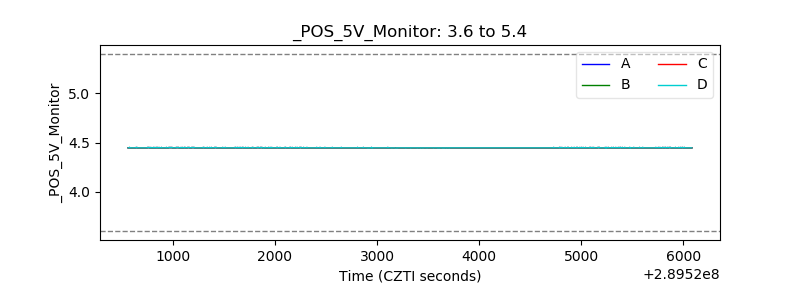 |
| _ROLL_ROT | 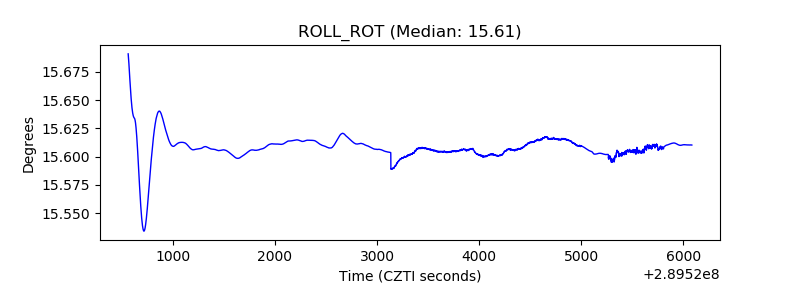 |
| _Roll_DEC | 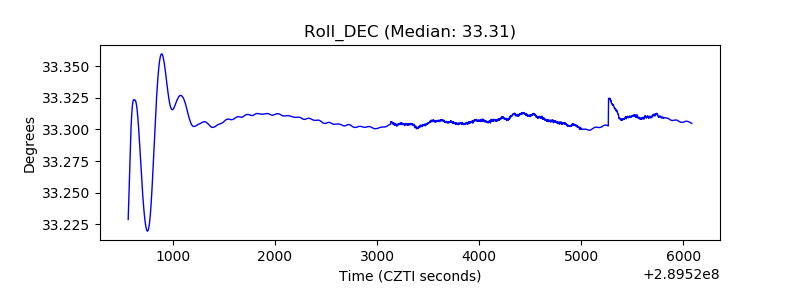 |
| _Roll_RA | 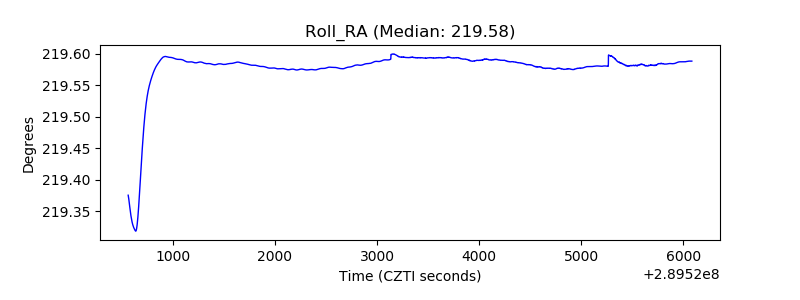 |
| Veto Counter | 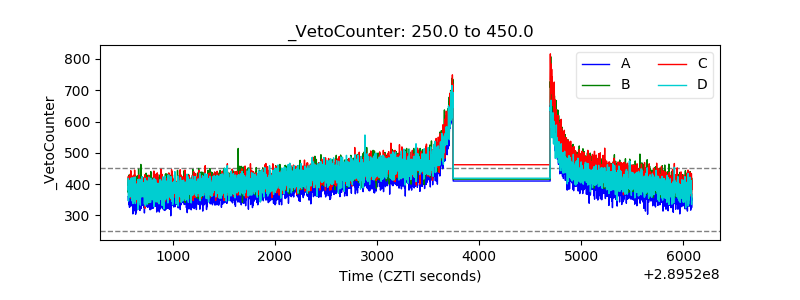 |