| Param | Original file | Final file |
|---|---|---|
| Filename | modeM0/AS1A05_075T07_9000002760_18574cztM0_level2.evt | modeM0/AS1A05_075T07_9000002760_18574cztM0_level2_quad_clean.evt |
| Size (bytes) | 447,912,000 | 59,322,240 |
| Size | 427.2 MB | 56.6 MB |
| Events in quadrant A | 2,461,252 | 368,091 |
| Events in quadrant B | 2,496,922 | 376,785 |
| Events in quadrant C | 3,534,459 | 351,008 |
| Events in quadrant D | 4,723,587 | 340,313 |
| Mode M9 | |||
|---|---|---|---|
| Quadrant | BADHDUFLAG | Total packets | Discarded packets |
| A | 0 | 5 | 0 |
| B | 0 | 5 | 0 |
| C | 0 | 5 | 0 |
| D | 0 | 5 | 0 |
| Mode M0 | |||
|---|---|---|---|
| Quadrant | BADHDUFLAG | Total packets | Discarded packets |
| A | 0 | 13786 | 3114 |
| B | 0 | 13777 | 3092 |
| C | 0 | 17029 | 3277 |
| D | 0 | 20807 | 3115 |
| Mode SS | |||
|---|---|---|---|
| Quadrant | BADHDUFLAG | Total packets | Discarded packets |
| A | 0 | 134 | 30 |
| B | 0 | 134 | 30 |
| C | 0 | 134 | 24 |
| D | 0 | 133 | 29 |
| Quadrant | Total seconds | Saturated seconds | Saturation percentage |
|---|---|---|---|
| A | 5128 | 33 | 0.643526% |
| B | 5109 | 64 | 1.252691% |
| C | 5117 | 424 | 8.286105% |
| D | 5140 | 690 | 13.424125% |
Noise dominated data is calculated using 1-second bins in cleaned event files. If a bin has >2000 counts, and if more than 50% of those come from <1% of pixels, then it is considered to be noise-dominated and hence unusable.
| Quadrant | # 1 sec bins | Bins with >0 counts | Bins with >2000 counts | High rate bins dominated by noise | Noise dominated (total time) | Noise dominated (detector-on time) | Marked lightcurve |
|---|---|---|---|---|---|---|---|
| A | 6662 | 5318 | 0 | 0 | 0.00% | 0.00% | 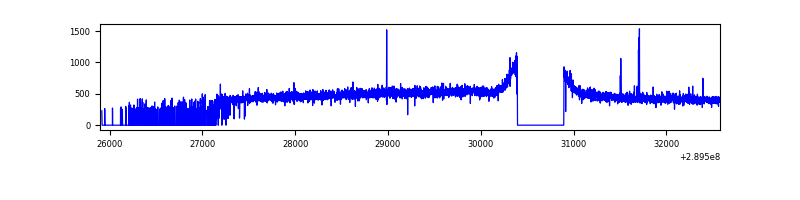 |
| B | 6682 | 5286 | 1 | 1 | 0.01% | 0.02% | 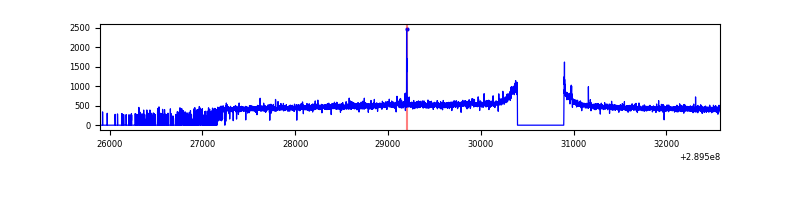 |
| C | 6539 | 5299 | 198 | 198 | 3.03% | 3.74% | 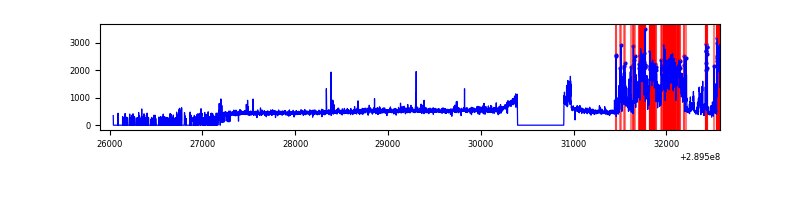 |
| D | 6669 | 5325 | 510 | 510 | 7.65% | 9.58% | 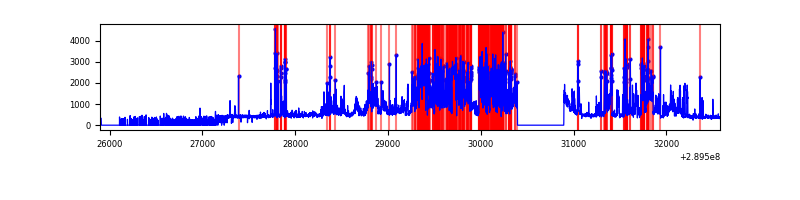 |
Top three noisy pixels from each quadrant. If the there are fewer than three noisy pixels in the level2.evt file, extra rows are filled as -1
| Pixel properties | Quadrant properties | ||||||
|---|---|---|---|---|---|---|---|
| Quadrant | DetID | PixID | Counts | Sigma | Mean | Median | Sigma |
| A | 14 | 111 | 14258 | 105.59 | 634 | 621 | 129.1 |
| A | 13 | 254 | 7873 | 56.15 | 634 | 621 | 129.1 |
| A | 0 | 226 | 5485 | 37.66 | 634 | 621 | 129.1 |
| B | 12 | 111 | 14871 | 115.26 | 631 | 614 | 123.7 |
| B | 11 | 111 | 12823 | 98.71 | 631 | 614 | 123.7 |
| B | 14 | 111 | 10566 | 80.46 | 631 | 614 | 123.7 |
| C | 9 | 54 | 1050553 | 7415.46 | 600 | 605 | 141.6 |
| C | 14 | 238 | 92882 | 651.72 | 600 | 605 | 141.6 |
| C | 4 | 254 | 48614 | 339.07 | 600 | 605 | 141.6 |
| D | 1 | 52 | 1654082 | 11644.44 | 580 | 562 | 142.0 |
| D | 7 | 238 | 850800 | 5987.56 | 580 | 562 | 142.0 |
| D | 2 | 234 | 19624 | 134.24 | 580 | 562 | 142.0 |
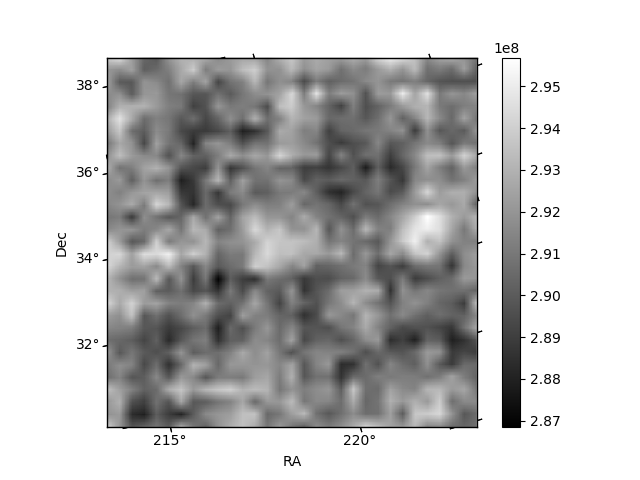
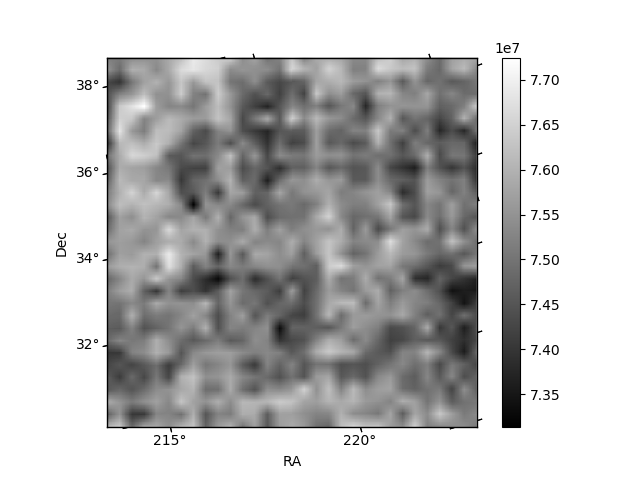
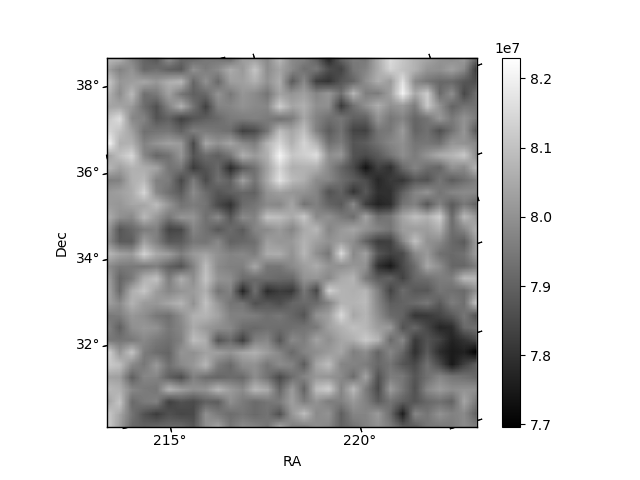
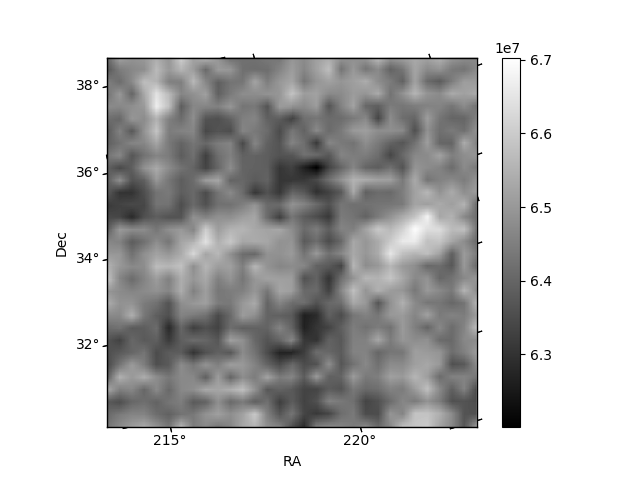
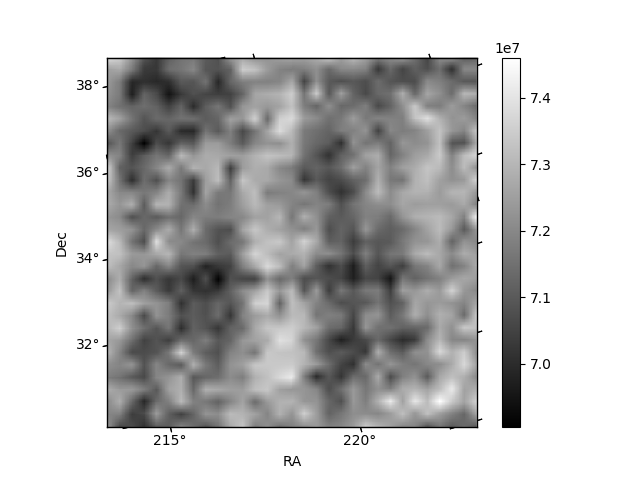
Histogram calculated using DETX and DETY for each event in the final _common_clean file
| Quadrant A | 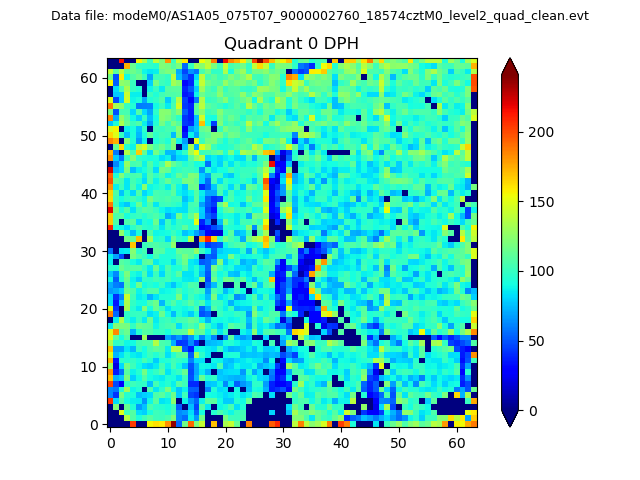 |
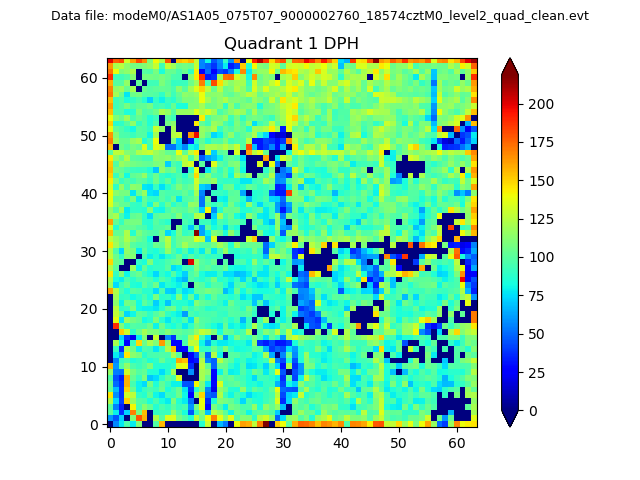 |
Quadrant B |
|---|---|---|---|
| Quadrant D | 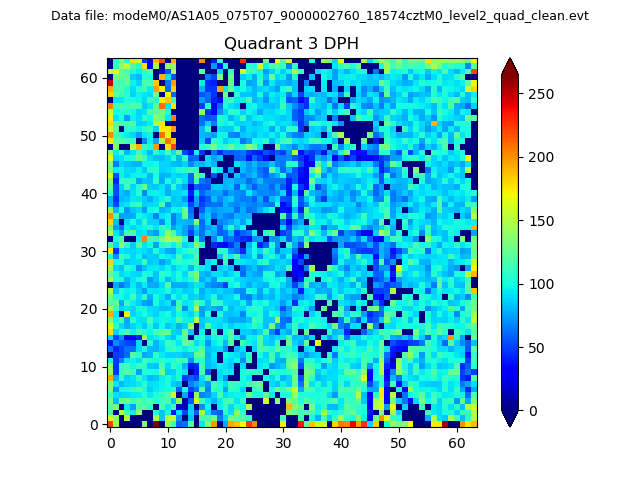 |
 |
Quadrant C |
| Plot type | Count rate plots | Images |
|---|---|---|
| Comparison with Poisson distribution Blue bars denote a histogram of data divided into 1 sec bins. Red curve is a Poisson curve with rate = median count rate of data. |
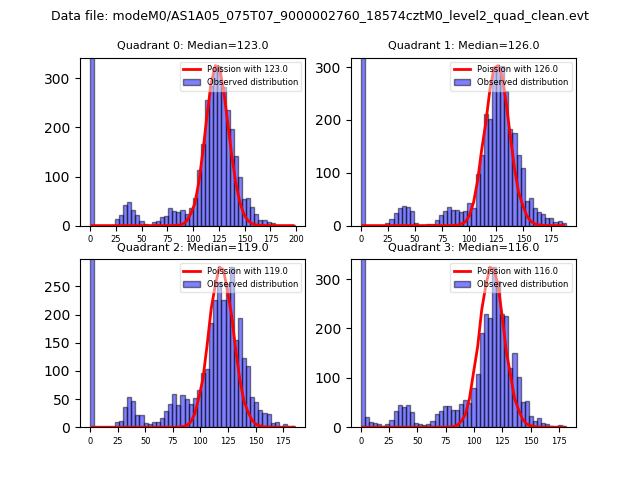 |
 |
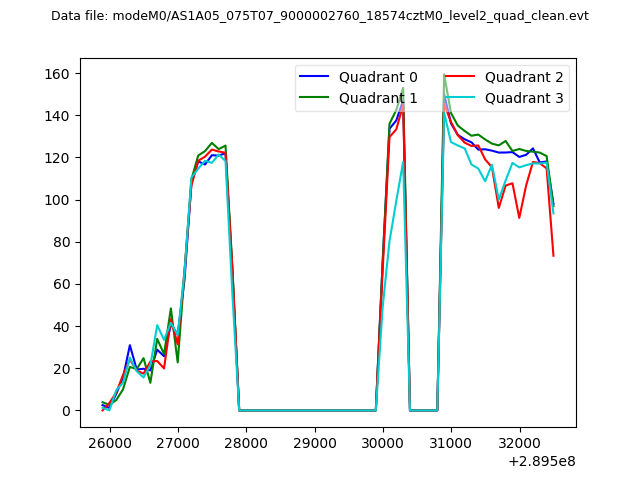
| Quadrant-wise count rates Data is divided into 100 sec bins |
 |
|
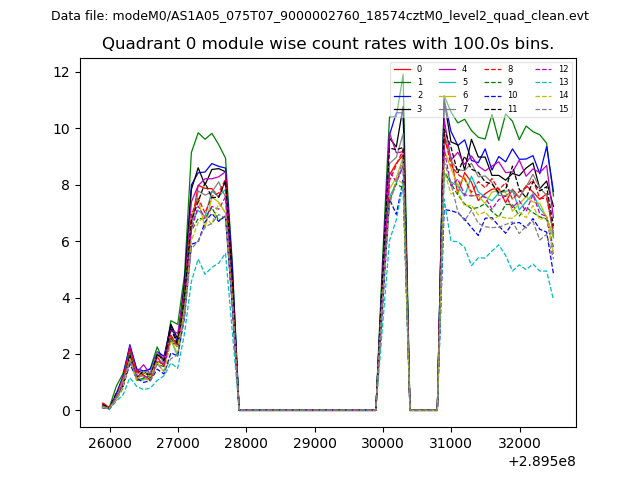
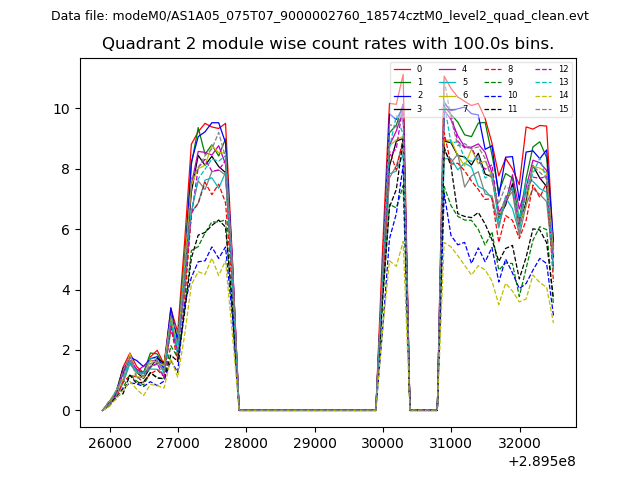
| Module-wise count rates for Quadrant A Data is divided into 100 sec bins |
 |
 |
| Module-wise count rates for Quadrant B Data is divided into 100 sec bins |
 |
 |
| Module-wise count rates for Quadrant C Data is divided into 100 sec bins |
 |
 |
| Module-wise count rates for Quadrant D Data is divided into 100 sec bins |
 |
 |
| Parameter | Plot |
|---|---|
| CZT HV Monitor | 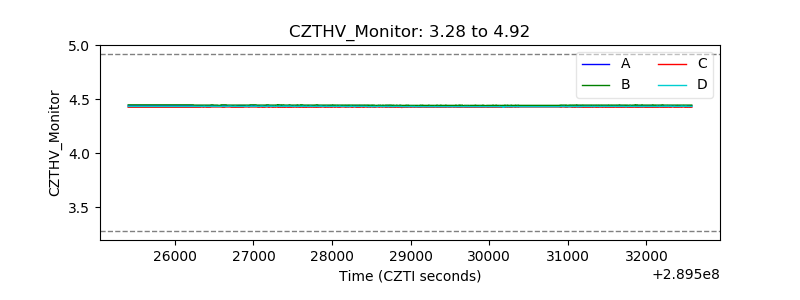 |
| D_VDD | 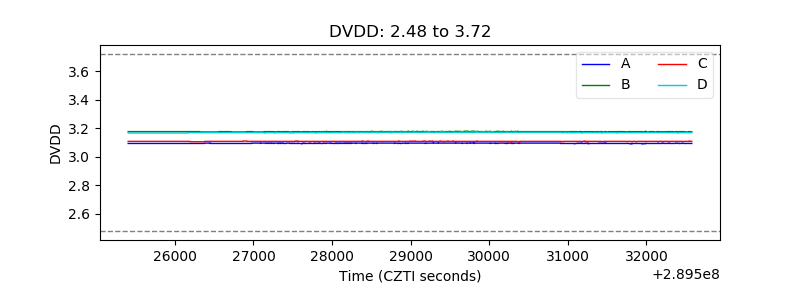 |
| Temperature 1 | 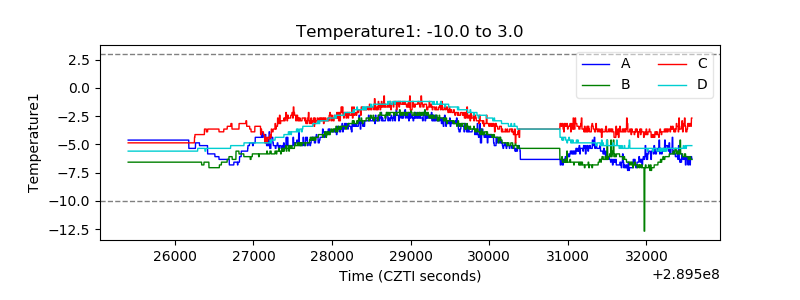 |
| Veto HV Monitor | 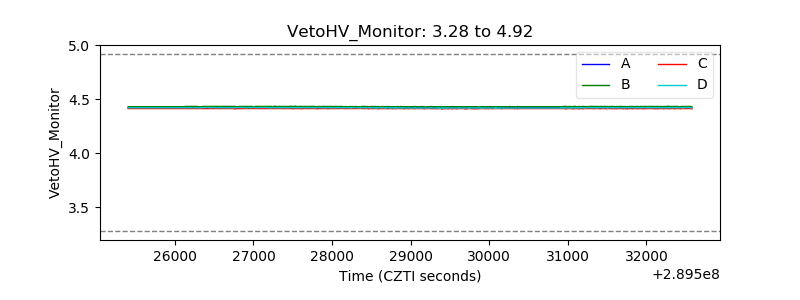 |
| Veto LLD |  |
| Alpha Counter | 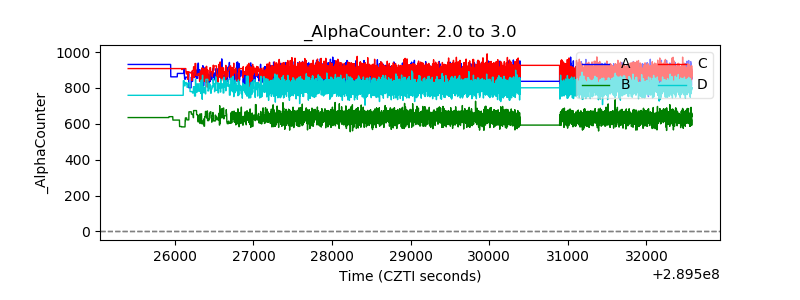 |
| _CPM_Rate | 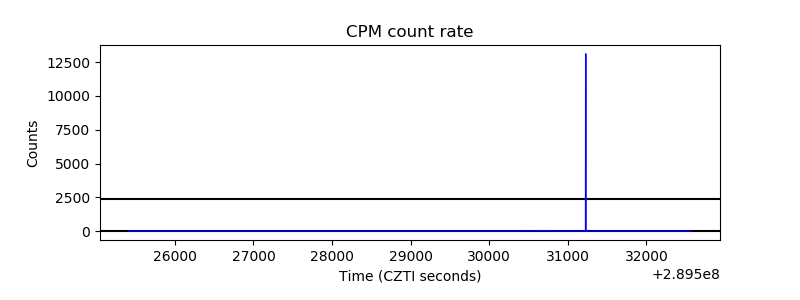 |
| CZT Counter | 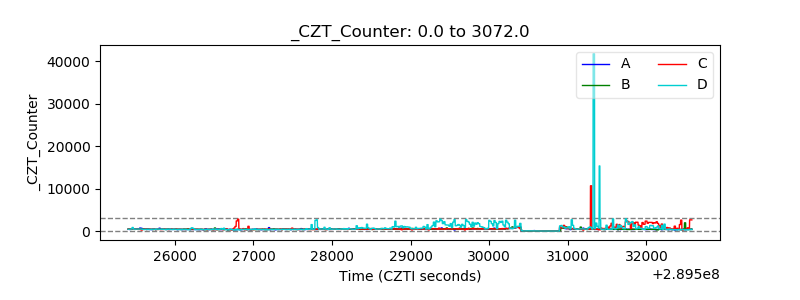 |
| +2.5 Volts monitor | 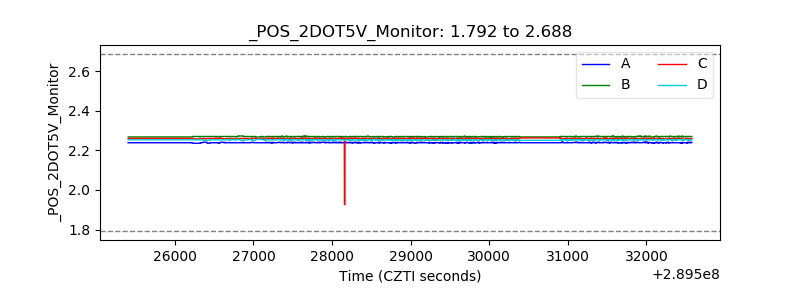 |
| +5 Volts monitor |  |
| _ROLL_ROT | 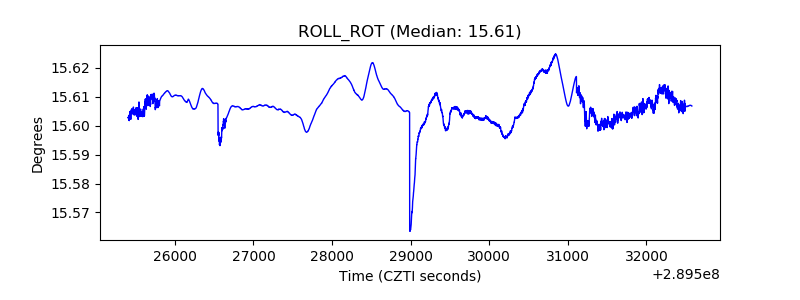 |
| _Roll_DEC | 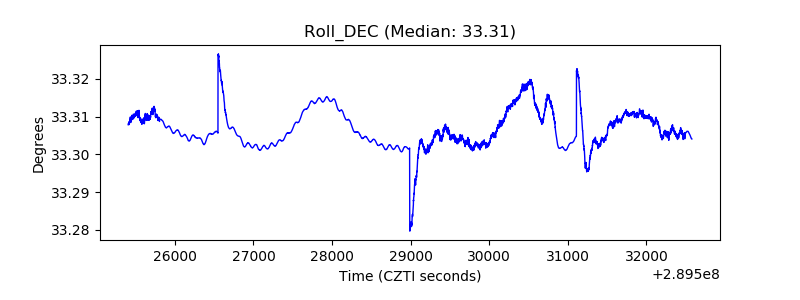 |
| _Roll_RA | 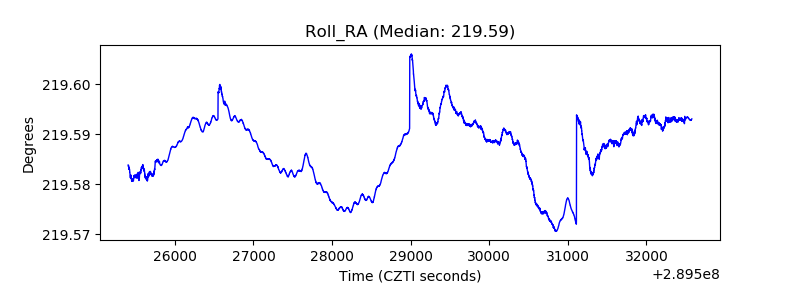 |
| Veto Counter | 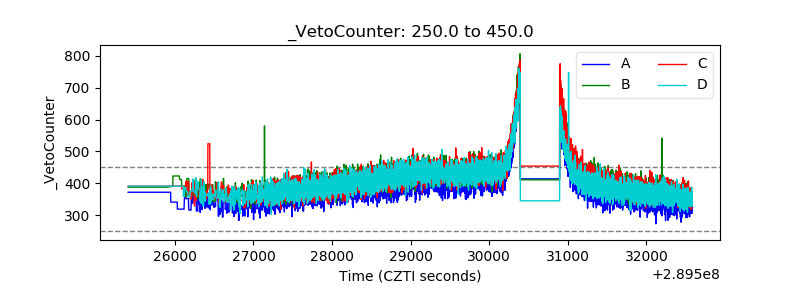 |