| Param | Original file | Final file |
|---|---|---|
| Filename | modeM0/AS1A05_075T07_9000002760_18576cztM0_level2.evt | modeM0/AS1A05_075T07_9000002760_18576cztM0_level2_quad_clean.evt |
| Size (bytes) | 578,566,080 | 107,023,680 |
| Size | 551.8 MB | 102.1 MB |
| Events in quadrant A | 3,554,853 | 682,687 |
| Events in quadrant B | 3,635,560 | 700,714 |
| Events in quadrant C | 3,697,959 | 680,490 |
| Events in quadrant D | 6,109,972 | 640,622 |
| Mode M9 | |||
|---|---|---|---|
| Quadrant | BADHDUFLAG | Total packets | Discarded packets |
| A | 0 | 3 | 0 |
| B | 0 | 3 | 0 |
| C | 0 | 3 | 0 |
| D | 0 | 3 | 0 |
| Mode M0 | |||
|---|---|---|---|
| Quadrant | BADHDUFLAG | Total packets | Discarded packets |
| A | 0 | 15863 | 1 |
| B | 0 | 15974 | 1 |
| C | 0 | 16141 | 2 |
| D | 0 | 23512 | 1 |
| Mode SS | |||
|---|---|---|---|
| Quadrant | BADHDUFLAG | Total packets | Discarded packets |
| A | 0 | 156 | 0 |
| B | 0 | 156 | 0 |
| C | 0 | 156 | 0 |
| D | 0 | 156 | 0 |
| Quadrant | Total seconds | Saturated seconds | Saturation percentage |
|---|---|---|---|
| A | 7721 | 102 | 1.321072% |
| B | 7722 | 130 | 1.683502% |
| C | 7721 | 143 | 1.852092% |
| D | 7721 | 840 | 10.879420% |
Noise dominated data is calculated using 1-second bins in cleaned event files. If a bin has >2000 counts, and if more than 50% of those come from <1% of pixels, then it is considered to be noise-dominated and hence unusable.
| Quadrant | # 1 sec bins | Bins with >0 counts | Bins with >2000 counts | High rate bins dominated by noise | Noise dominated (total time) | Noise dominated (detector-on time) | Marked lightcurve |
|---|---|---|---|---|---|---|---|
| A | 7921 | 7722 | 0 | 0 | 0.00% | 0.00% | 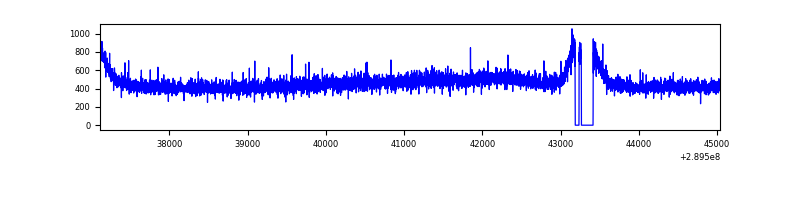 |
| B | 7922 | 7724 | 4 | 4 | 0.05% | 0.05% | 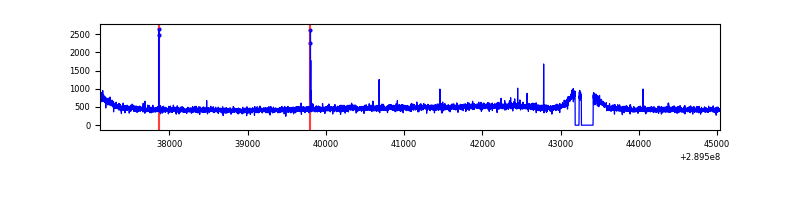 |
| C | 7921 | 7723 | 11 | 11 | 0.14% | 0.14% | 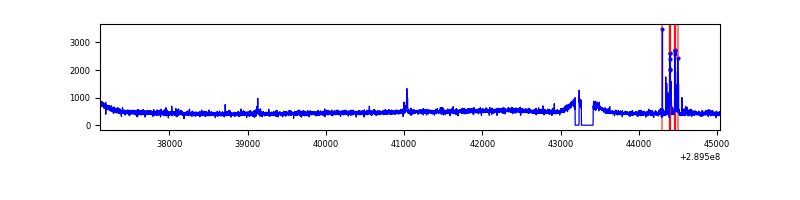 |
| D | 7921 | 7723 | 673 | 673 | 8.50% | 8.71% | 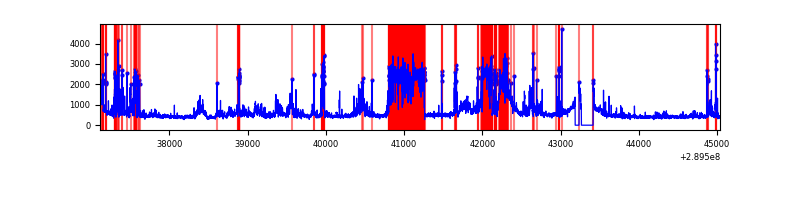 |
Top three noisy pixels from each quadrant. If the there are fewer than three noisy pixels in the level2.evt file, extra rows are filled as -1
| Pixel properties | Quadrant properties | ||||||
|---|---|---|---|---|---|---|---|
| Quadrant | DetID | PixID | Counts | Sigma | Mean | Median | Sigma |
| A | 13 | 254 | 12154 | 59.88 | 920 | 901 | 187.9 |
| A | 0 | 226 | 7948 | 37.5 | 920 | 901 | 187.9 |
| A | 3 | 137 | 7522 | 35.23 | 920 | 901 | 187.9 |
| B | 12 | 111 | 22095 | 118.21 | 924 | 898 | 179.3 |
| B | 11 | 111 | 19122 | 101.63 | 924 | 898 | 179.3 |
| B | 14 | 111 | 16614 | 87.64 | 924 | 898 | 179.3 |
| C | 14 | 238 | 137042 | 651.93 | 886 | 891 | 208.8 |
| C | 9 | 54 | 91046 | 431.69 | 886 | 891 | 208.8 |
| C | 3 | 233 | 13973 | 62.64 | 886 | 891 | 208.8 |
| D | 7 | 238 | 2319936 | 11181.14 | 849 | 823 | 207.4 |
| D | 1 | 52 | 470847 | 2266.13 | 849 | 823 | 207.4 |
| D | 10 | 50 | 56231 | 267.14 | 849 | 823 | 207.4 |
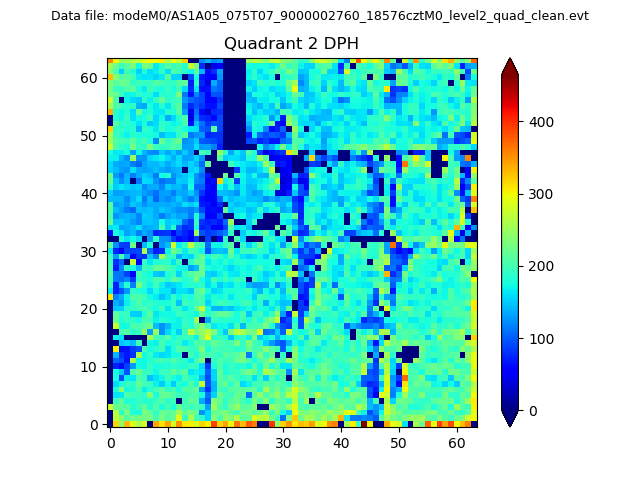
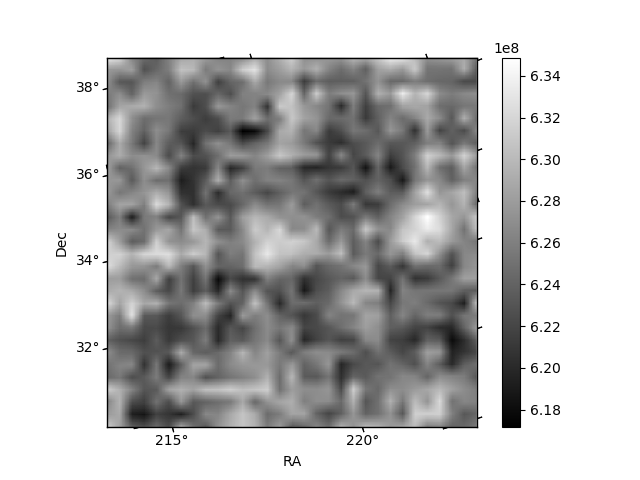
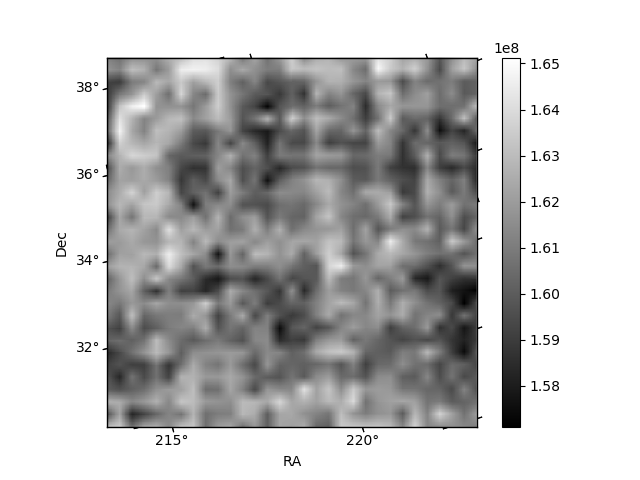
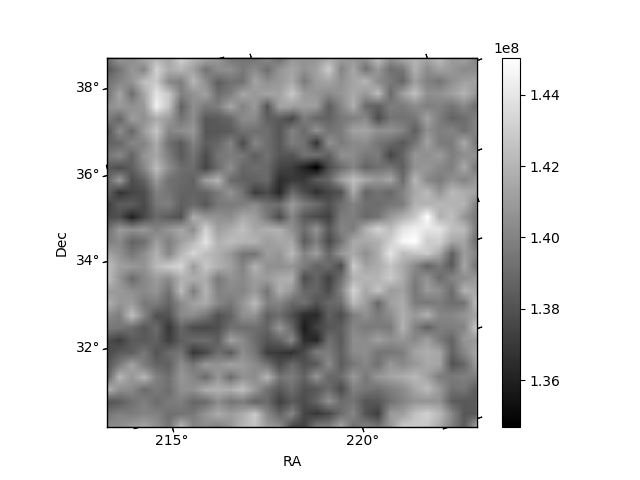
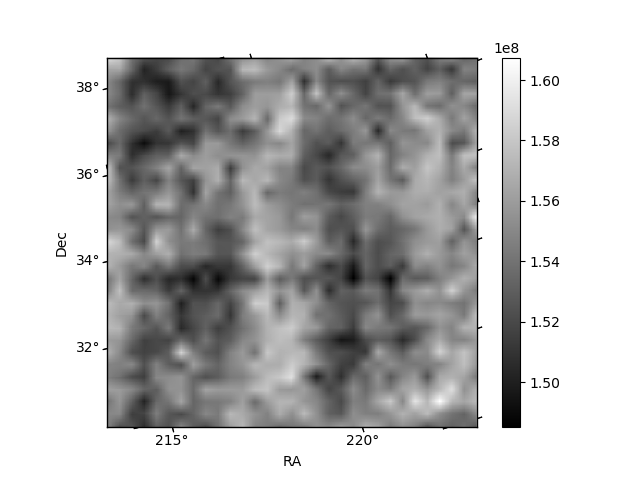
Histogram calculated using DETX and DETY for each event in the final _common_clean file
| Quadrant A | 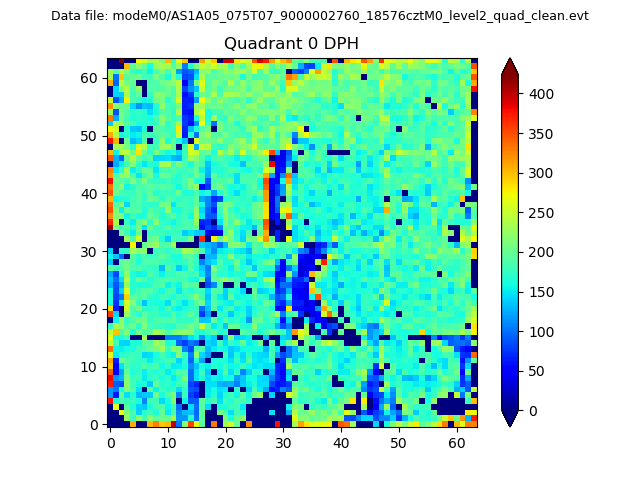 |
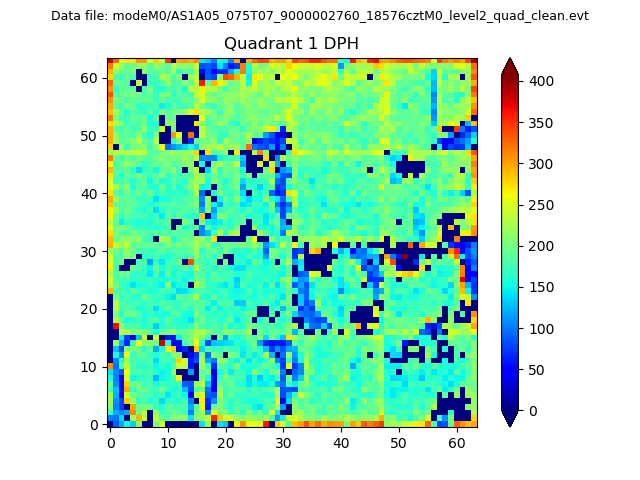 |
Quadrant B |
|---|---|---|---|
| Quadrant D | 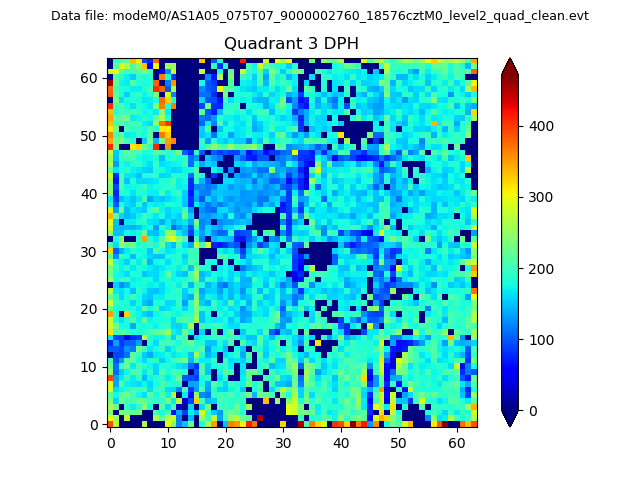 |
 |
Quadrant C |
| Plot type | Count rate plots | Images |
|---|---|---|
| Comparison with Poisson distribution Blue bars denote a histogram of data divided into 1 sec bins. Red curve is a Poisson curve with rate = median count rate of data. |
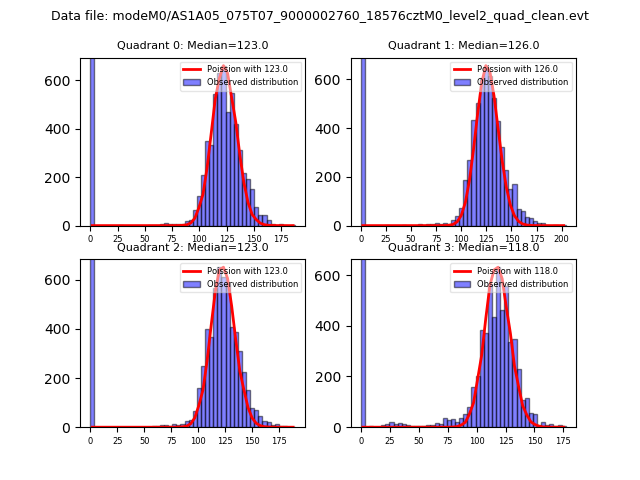 |
 |
| Quadrant-wise count rates Data is divided into 100 sec bins |
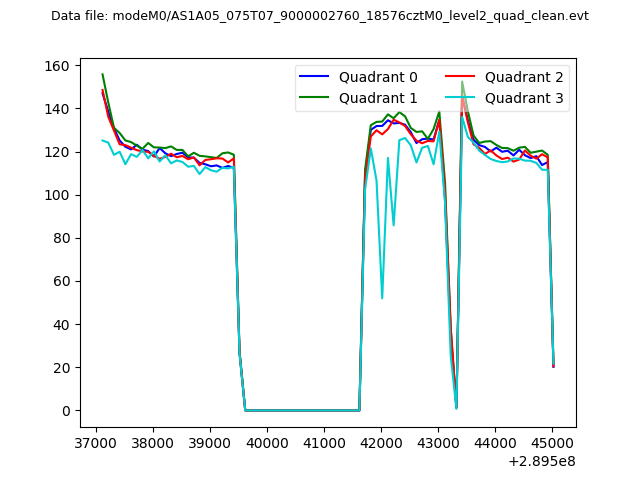 |
|
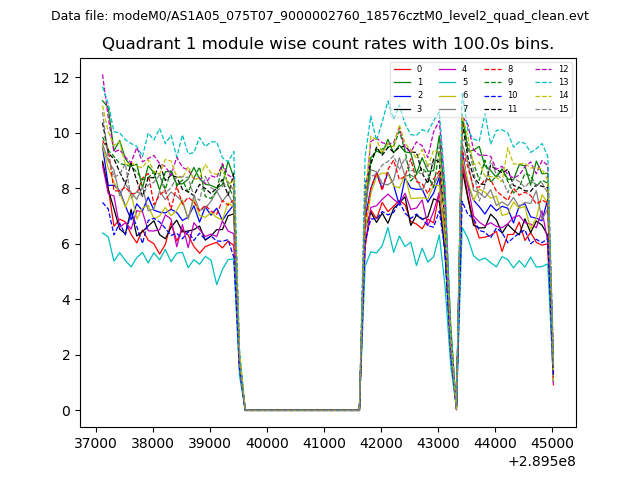
| Module-wise count rates for Quadrant A Data is divided into 100 sec bins |
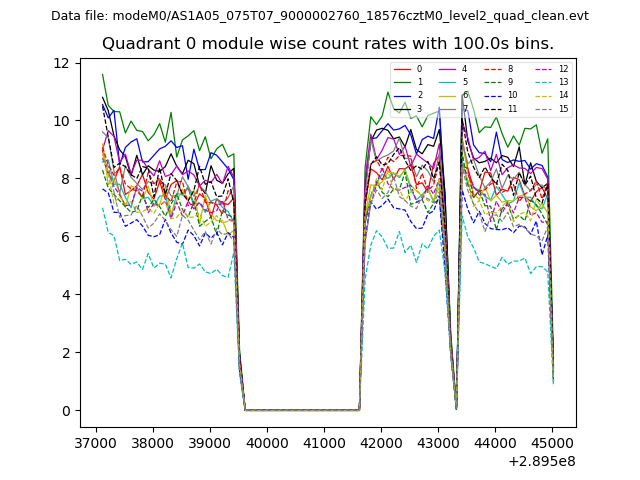 |
 |
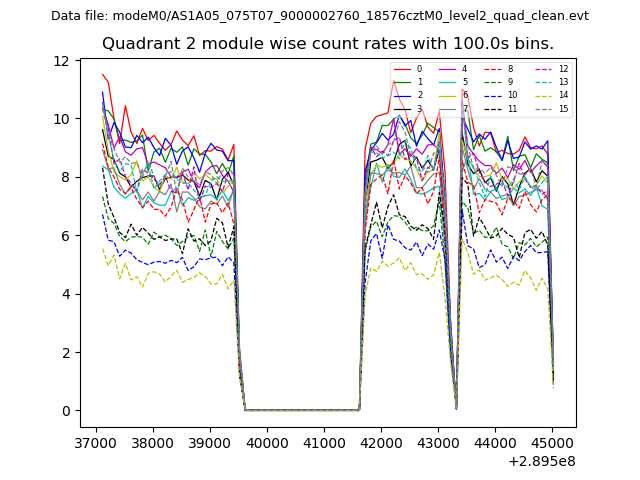
| Module-wise count rates for Quadrant B Data is divided into 100 sec bins |
 |
 |
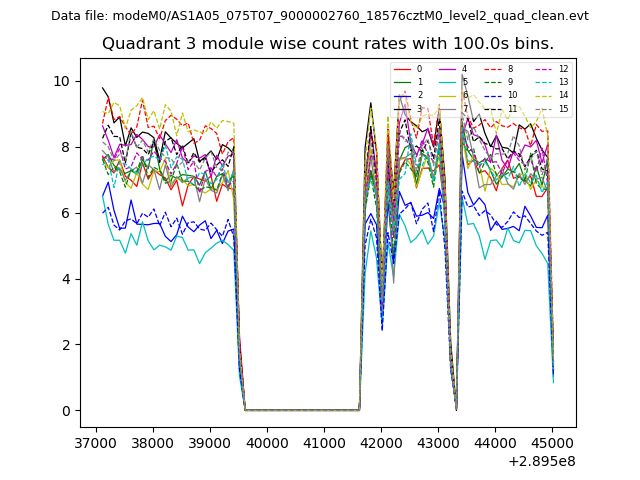
| Module-wise count rates for Quadrant C Data is divided into 100 sec bins |
 |
 |
| Module-wise count rates for Quadrant D Data is divided into 100 sec bins |
 |
 |
| Parameter | Plot |
|---|---|
| CZT HV Monitor | 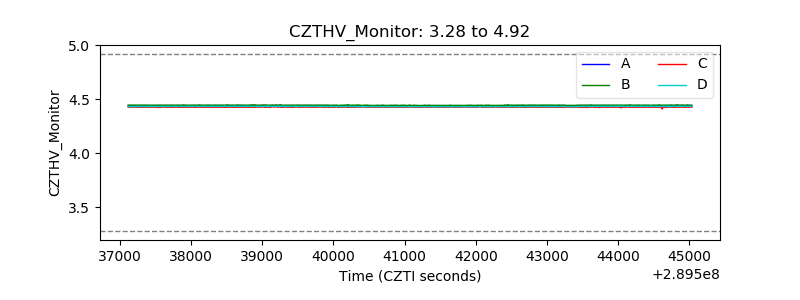 |
| D_VDD | 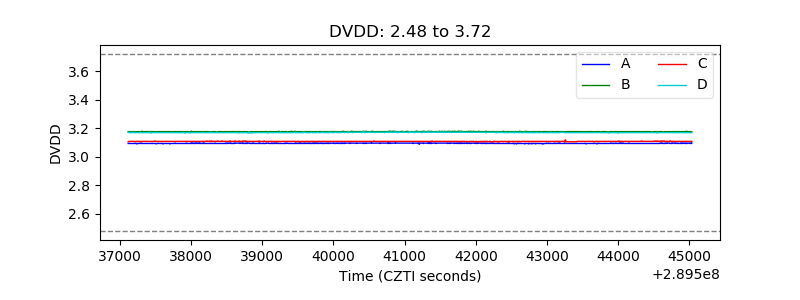 |
| Temperature 1 | 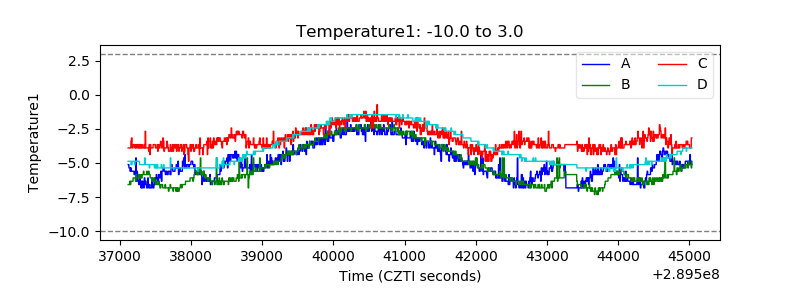 |
| Veto HV Monitor | 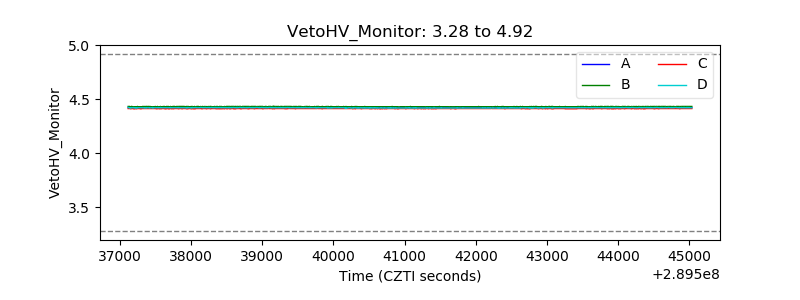 |
| Veto LLD | 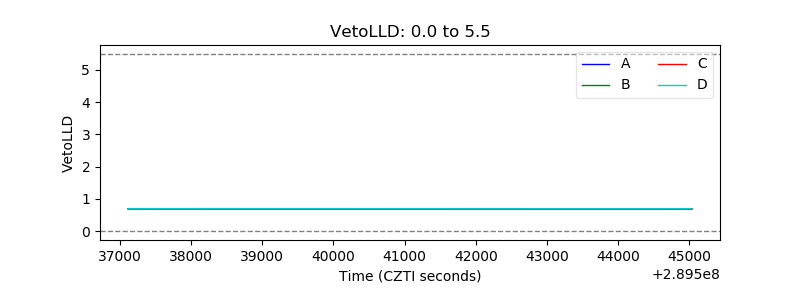 |
| Alpha Counter | 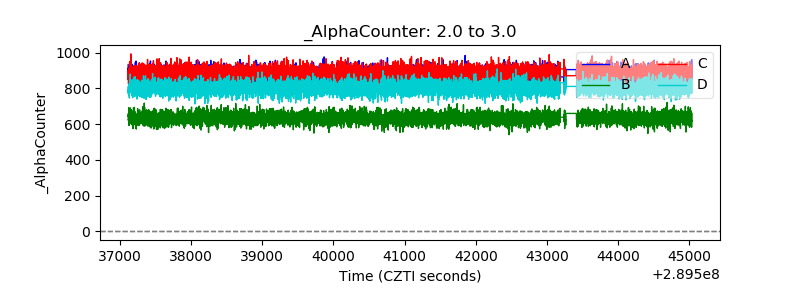 |
| _CPM_Rate | 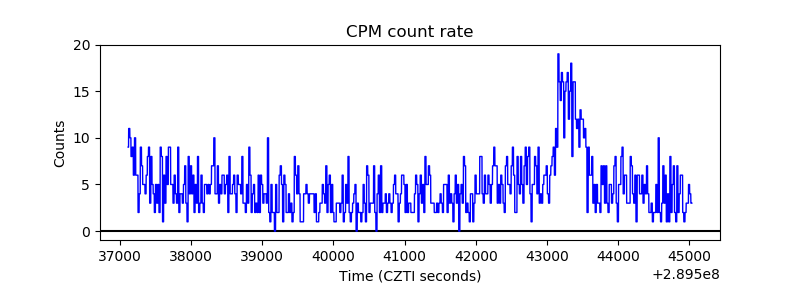 |
| CZT Counter | 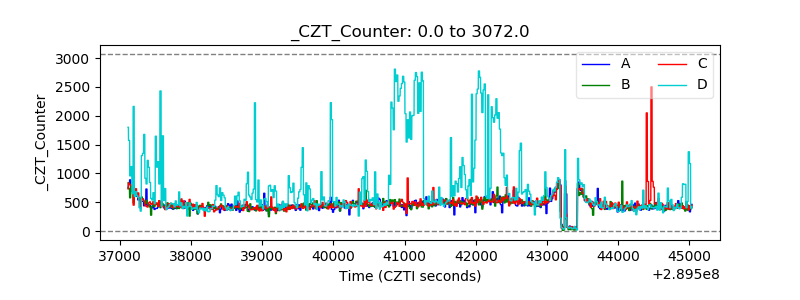 |
| +2.5 Volts monitor |  |
| +5 Volts monitor | 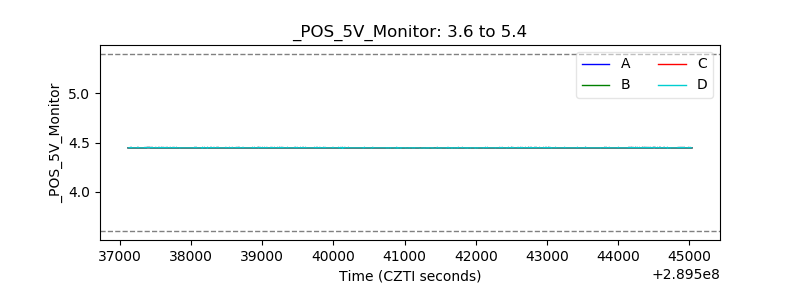 |
| _ROLL_ROT | 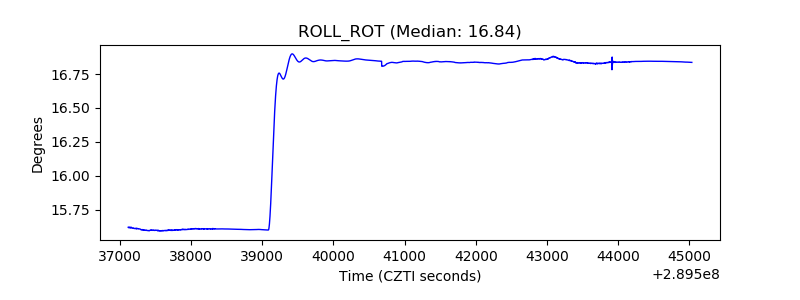 |
| _Roll_DEC | 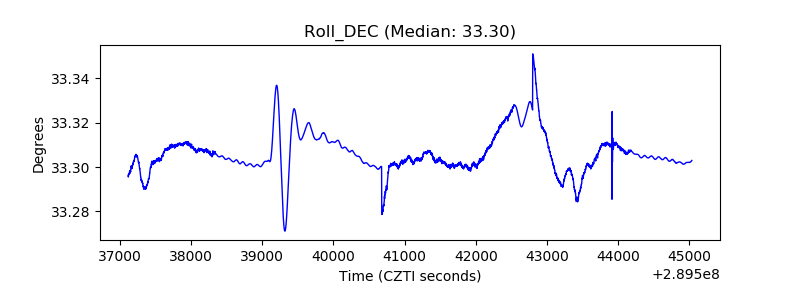 |
| _Roll_RA | 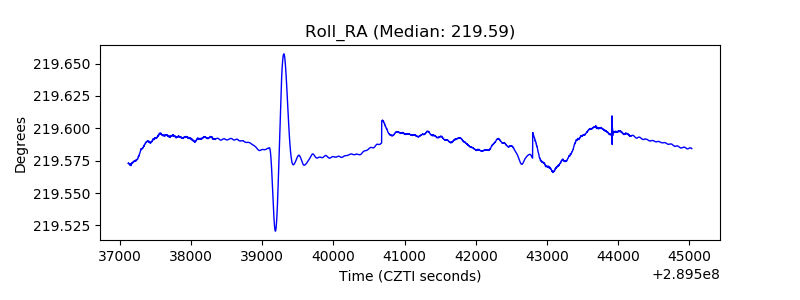 |
| Veto Counter | 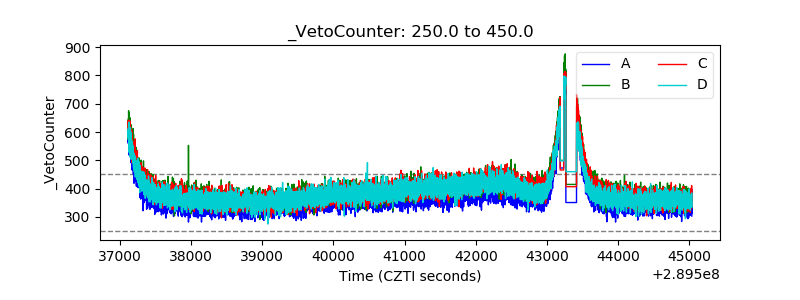 |