| Param | Original file | Final file |
|---|---|---|
| Filename | modeM0/AS1A05_075T07_9000002760_18579cztM0_level2.evt | modeM0/AS1A05_075T07_9000002760_18579cztM0_level2_quad_clean.evt |
| Size (bytes) | 1,349,979,840 | 224,691,840 |
| Size | 1.3 GB | 214.3 MB |
| Events in quadrant A | 9,181,854 | 1,382,415 |
| Events in quadrant B | 8,896,803 | 1,421,942 |
| Events in quadrant C | 9,316,852 | 1,371,421 |
| Events in quadrant D | 12,219,627 | 1,335,345 |
| Mode M9 | |||
|---|---|---|---|
| Quadrant | BADHDUFLAG | Total packets | Discarded packets |
| A | 0 | 18 | 0 |
| B | 0 | 18 | 0 |
| C | 0 | 18 | 0 |
| D | 0 | 18 | 0 |
| Mode M0 | |||
|---|---|---|---|
| Quadrant | BADHDUFLAG | Total packets | Discarded packets |
| A | 0 | 39625 | 5 |
| B | 0 | 38438 | 4 |
| C | 0 | 39858 | 4 |
| D | 0 | 48924 | 4 |
| Mode SS | |||
|---|---|---|---|
| Quadrant | BADHDUFLAG | Total packets | Discarded packets |
| A | 0 | 382 | 0 |
| B | 0 | 382 | 0 |
| C | 0 | 382 | 0 |
| D | 0 | 382 | 0 |
| Quadrant | Total seconds | Saturated seconds | Saturation percentage |
|---|---|---|---|
| A | 18771 | 346 | 1.843269% |
| B | 18772 | 228 | 1.214575% |
| C | 18772 | 394 | 2.098871% |
| D | 18772 | 922 | 4.911570% |
Noise dominated data is calculated using 1-second bins in cleaned event files. If a bin has >2000 counts, and if more than 50% of those come from <1% of pixels, then it is considered to be noise-dominated and hence unusable.
| Quadrant | # 1 sec bins | Bins with >0 counts | Bins with >2000 counts | High rate bins dominated by noise | Noise dominated (total time) | Noise dominated (detector-on time) | Marked lightcurve |
|---|---|---|---|---|---|---|---|
| A | 20576 | 18771 | 91 | 91 | 0.44% | 0.48% |  |
| B | 20577 | 18772 | 2 | 2 | 0.01% | 0.01% | 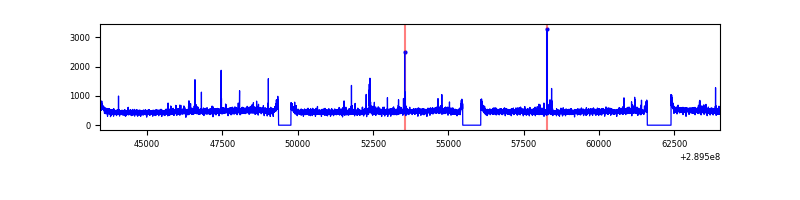 |
| C | 20577 | 18772 | 94 | 94 | 0.46% | 0.50% | 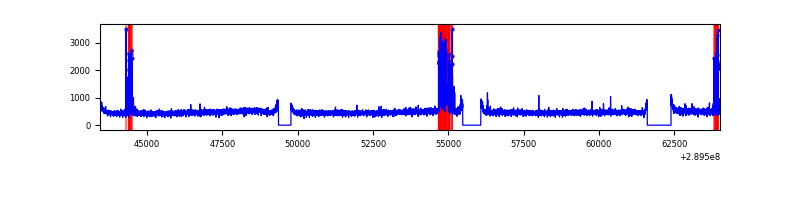 |
| D | 20577 | 18773 | 673 | 673 | 3.27% | 3.58% | 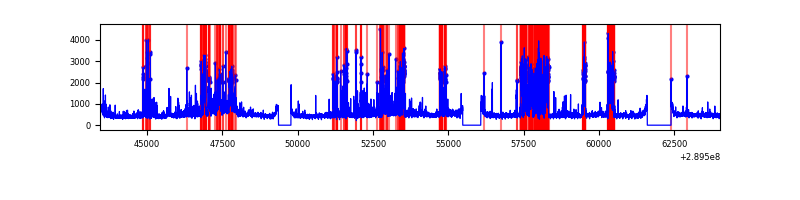 |
Top three noisy pixels from each quadrant. If the there are fewer than three noisy pixels in the level2.evt file, extra rows are filled as -1
| Pixel properties | Quadrant properties | ||||||
|---|---|---|---|---|---|---|---|
| Quadrant | DetID | PixID | Counts | Sigma | Mean | Median | Sigma |
| A | 0 | 13 | 540347 | 1179.56 | 2241 | 2186 | 456.2 |
| A | 13 | 254 | 30047 | 61.07 | 2241 | 2186 | 456.2 |
| A | 0 | 226 | 19363 | 37.65 | 2241 | 2186 | 456.2 |
| B | 12 | 111 | 53066 | 118.29 | 2244 | 2184 | 430.2 |
| B | 0 | 190 | 47864 | 106.19 | 2244 | 2184 | 430.2 |
| B | 11 | 111 | 46253 | 102.45 | 2244 | 2184 | 430.2 |
| C | 9 | 54 | 454691 | 900.23 | 2152 | 2167 | 502.7 |
| C | 14 | 238 | 332027 | 656.21 | 2152 | 2167 | 502.7 |
| C | 4 | 254 | 124240 | 242.85 | 2152 | 2167 | 502.7 |
| D | 1 | 52 | 2237267 | 4265.21 | 2162 | 2103 | 524.0 |
| D | 7 | 238 | 1501850 | 2861.87 | 2162 | 2103 | 524.0 |
| D | 10 | 50 | 145215 | 273.09 | 2162 | 2103 | 524.0 |
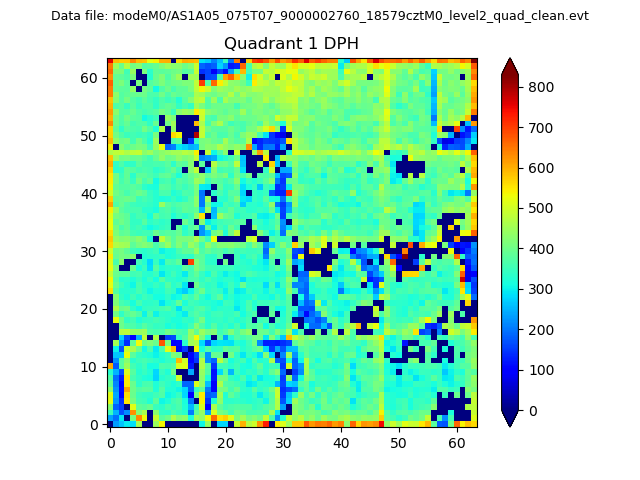
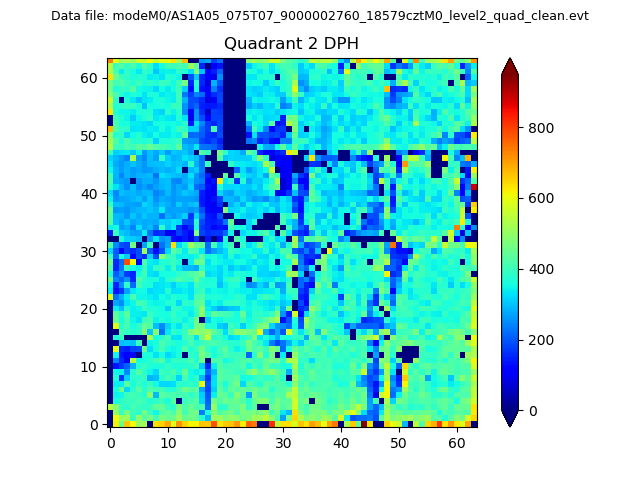
Histogram calculated using DETX and DETY for each event in the final _common_clean file
| Quadrant A | 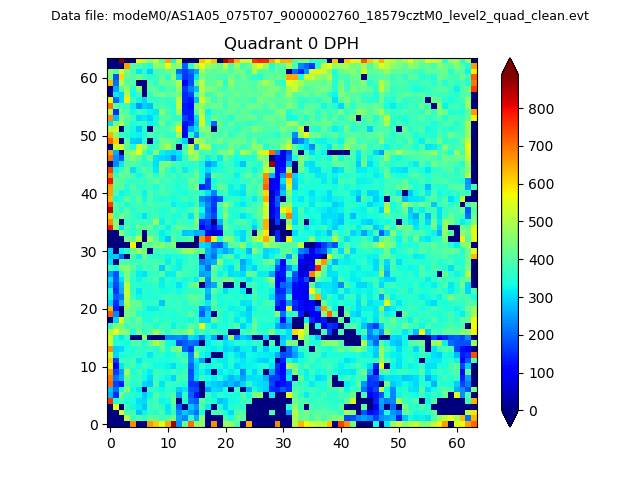 |
 |
Quadrant B |
|---|---|---|---|
| Quadrant D | 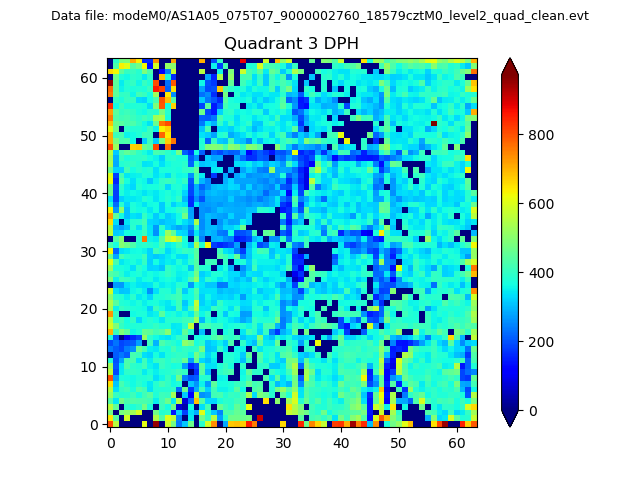 |
 |
Quadrant C |
| Plot type | Count rate plots | Images |
|---|---|---|
| Comparison with Poisson distribution Blue bars denote a histogram of data divided into 1 sec bins. Red curve is a Poisson curve with rate = median count rate of data. |
 |
 |
| Quadrant-wise count rates Data is divided into 100 sec bins |
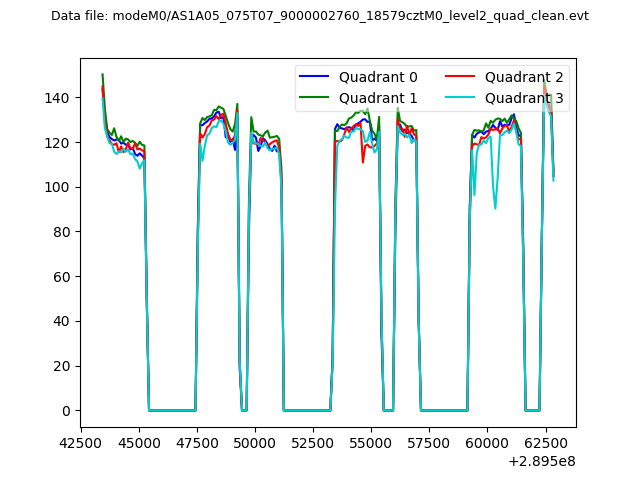 |
|
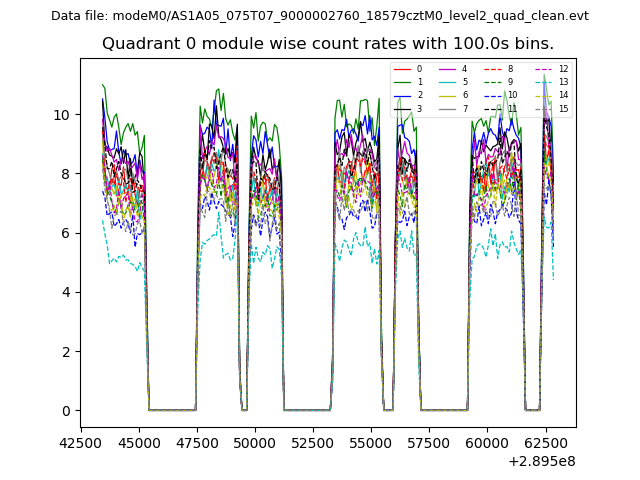
| Module-wise count rates for Quadrant A Data is divided into 100 sec bins |
 |
 |
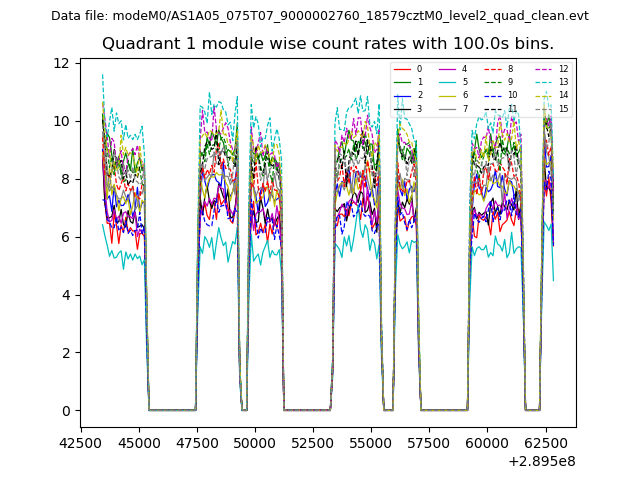
| Module-wise count rates for Quadrant B Data is divided into 100 sec bins |
 |
 |
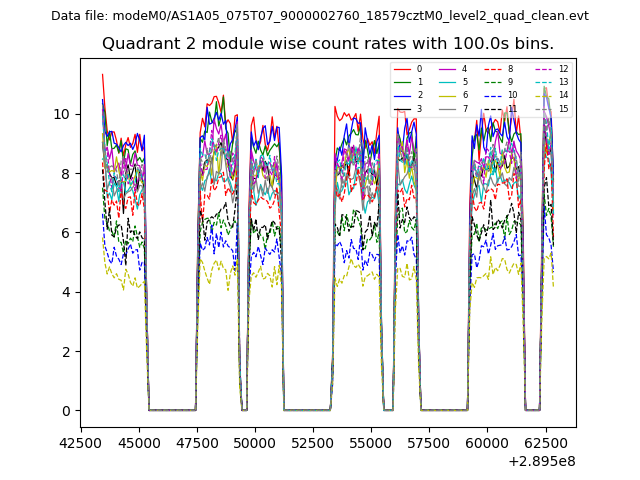
| Module-wise count rates for Quadrant C Data is divided into 100 sec bins |
 |
 |
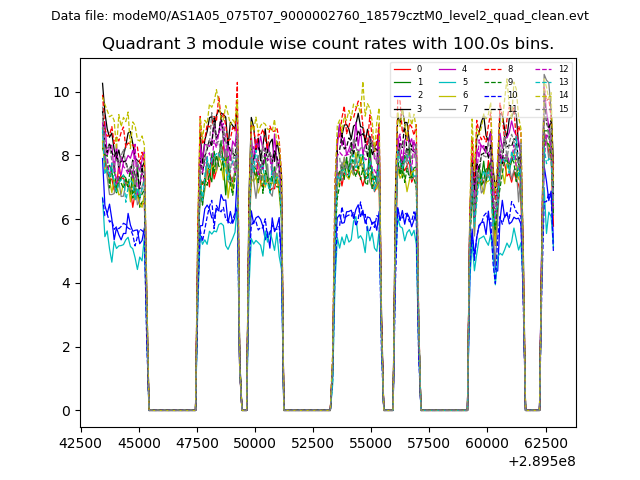
| Module-wise count rates for Quadrant D Data is divided into 100 sec bins |
 |
 |
| Parameter | Plot |
|---|---|
| CZT HV Monitor | 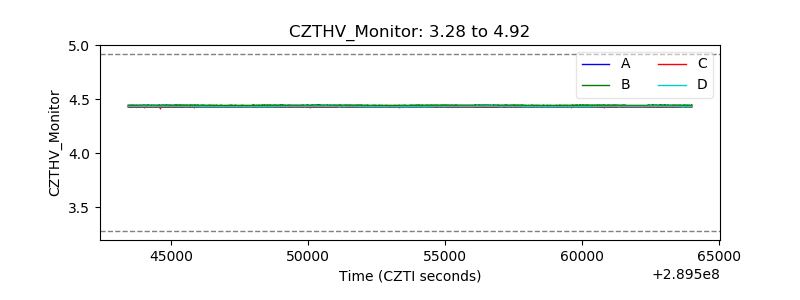 |
| D_VDD | 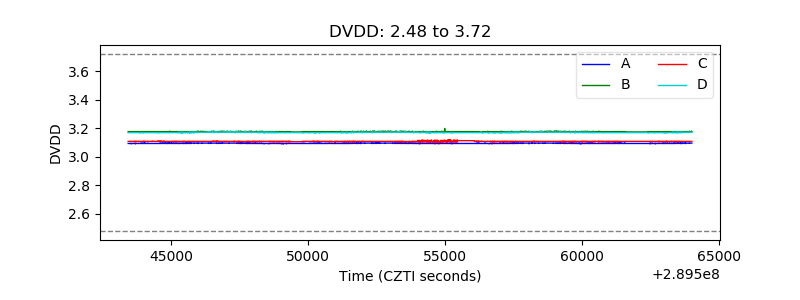 |
| Temperature 1 |  |
| Veto HV Monitor | 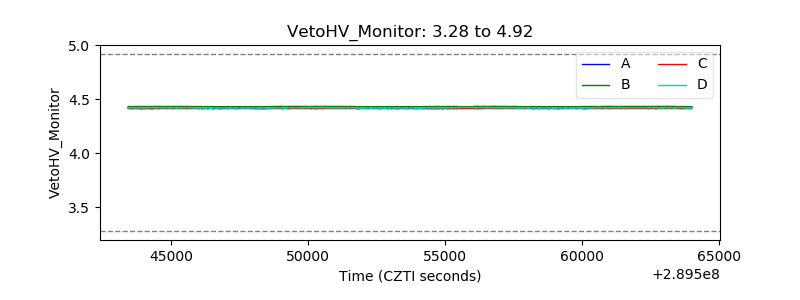 |
| Veto LLD | 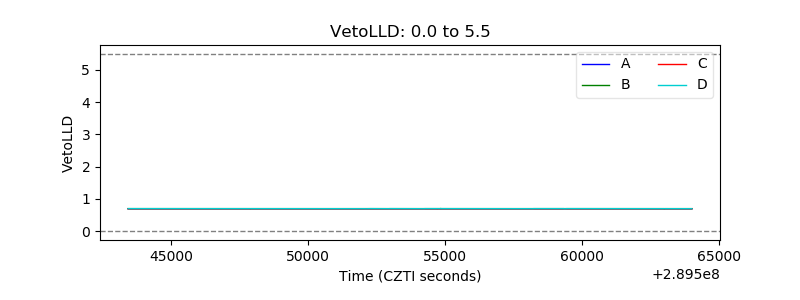 |
| Alpha Counter |  |
| _CPM_Rate | 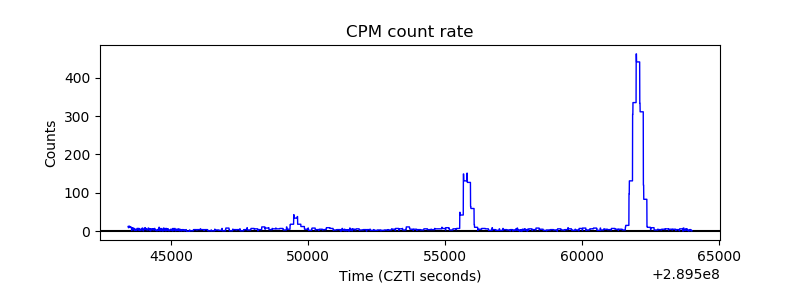 |
| CZT Counter |  |
| +2.5 Volts monitor |  |
| +5 Volts monitor |  |
| _ROLL_ROT | 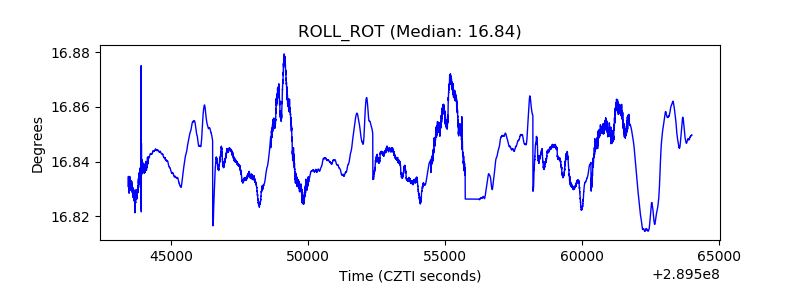 |
| _Roll_DEC | 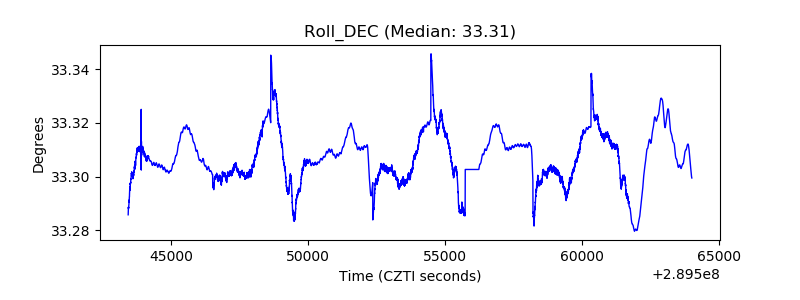 |
| _Roll_RA |  |
| Veto Counter | 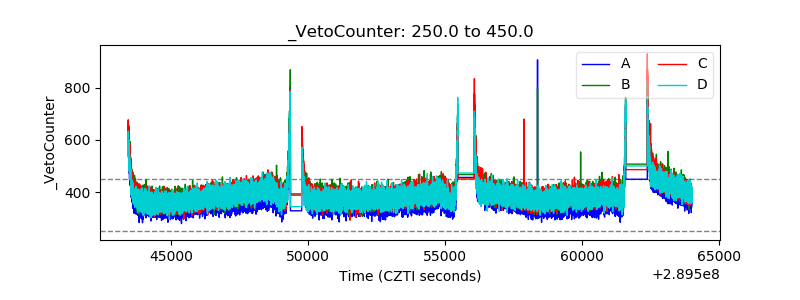 |