| Param | Original file | Final file |
|---|---|---|
| Filename | modeM0/AS1A05_075T07_9000002760_18580cztM0_level2.evt | modeM0/AS1A05_075T07_9000002760_18580cztM0_level2_quad_clean.evt |
| Size (bytes) | 2,969,640,000 | 474,410,880 |
| Size | 2.8 GB | 452.4 MB |
| Events in quadrant A | 19,030,905 | 2,946,272 |
| Events in quadrant B | 18,616,568 | 3,033,748 |
| Events in quadrant C | 21,020,655 | 2,918,353 |
| Events in quadrant D | 28,637,348 | 2,792,310 |
| Mode M9 | |||
|---|---|---|---|
| Quadrant | BADHDUFLAG | Total packets | Discarded packets |
| A | 0 | 27 | 0 |
| B | 0 | 28 | 0 |
| C | 0 | 28 | 0 |
| D | 0 | 28 | 0 |
| Mode M0 | |||
|---|---|---|---|
| Quadrant | BADHDUFLAG | Total packets | Discarded packets |
| A | 0 | 82406 | 6 |
| B | 0 | 80515 | 6 |
| C | 0 | 87818 | 6 |
| D | 0 | 111707 | 6 |
| Mode SS | |||
|---|---|---|---|
| Quadrant | BADHDUFLAG | Total packets | Discarded packets |
| A | 0 | 790 | 0 |
| B | 0 | 790 | 0 |
| C | 0 | 790 | 0 |
| D | 0 | 790 | 0 |
| Quadrant | Total seconds | Saturated seconds | Saturation percentage |
|---|---|---|---|
| A | 38993 | 756 | 1.938810% |
| B | 38993 | 612 | 1.569512% |
| C | 38993 | 1337 | 3.428821% |
| D | 38993 | 3298 | 8.457928% |
Noise dominated data is calculated using 1-second bins in cleaned event files. If a bin has >2000 counts, and if more than 50% of those come from <1% of pixels, then it is considered to be noise-dominated and hence unusable.
| Quadrant | # 1 sec bins | Bins with >0 counts | Bins with >2000 counts | High rate bins dominated by noise | Noise dominated (total time) | Noise dominated (detector-on time) | Marked lightcurve |
|---|---|---|---|---|---|---|---|
| A | 41498 | 38995 | 168 | 168 | 0.40% | 0.43% | 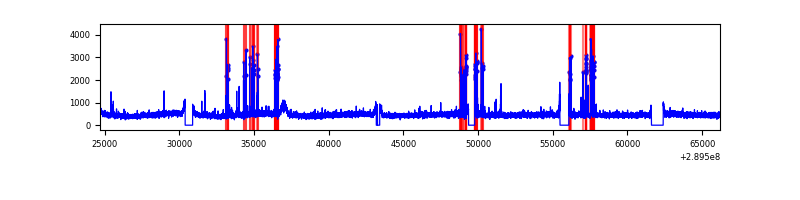 |
| B | 41498 | 38996 | 7 | 7 | 0.02% | 0.02% | 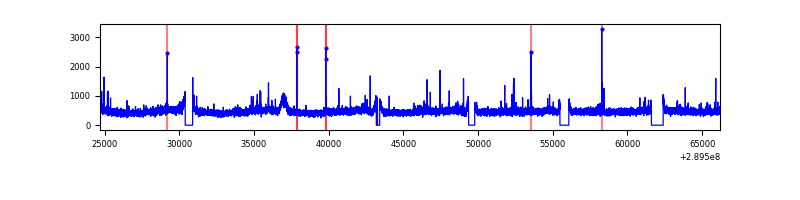 |
| C | 41498 | 38996 | 429 | 429 | 1.03% | 1.10% | 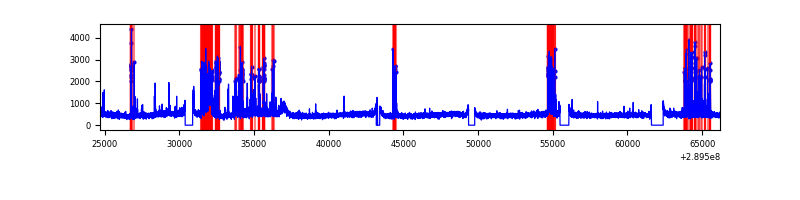 |
| D | 41498 | 38997 | 2363 | 2363 | 5.69% | 6.06% | 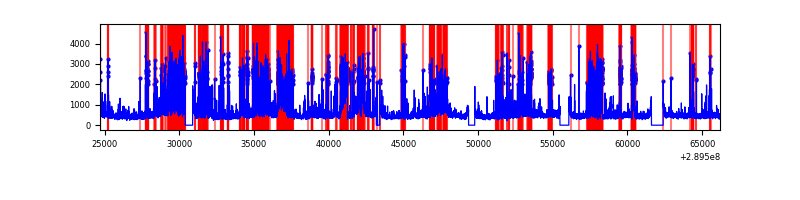 |
Top three noisy pixels from each quadrant. If the there are fewer than three noisy pixels in the level2.evt file, extra rows are filled as -1
| Pixel properties | Quadrant properties | ||||||
|---|---|---|---|---|---|---|---|
| Quadrant | DetID | PixID | Counts | Sigma | Mean | Median | Sigma |
| A | 0 | 13 | 543656 | 569.68 | 4692 | 4594 | 946.3 |
| A | 14 | 111 | 391391 | 408.76 | 4692 | 4594 | 946.3 |
| A | 13 | 254 | 62120 | 60.79 | 4692 | 4594 | 946.3 |
| B | 12 | 111 | 111305 | 117.94 | 4707 | 4573 | 905.0 |
| B | 11 | 111 | 96621 | 101.71 | 4707 | 4573 | 905.0 |
| B | 14 | 111 | 81565 | 85.08 | 4707 | 4573 | 905.0 |
| C | 9 | 54 | 2183324 | 2069.28 | 4508 | 4537 | 1052.9 |
| C | 14 | 238 | 695888 | 656.6 | 4508 | 4537 | 1052.9 |
| C | 4 | 254 | 546807 | 515.01 | 4508 | 4537 | 1052.9 |
| D | 7 | 238 | 5822579 | 5415.06 | 4442 | 4325 | 1074.5 |
| D | 1 | 52 | 5472745 | 5089.47 | 4442 | 4325 | 1074.5 |
| D | 10 | 50 | 271357 | 248.53 | 4442 | 4325 | 1074.5 |
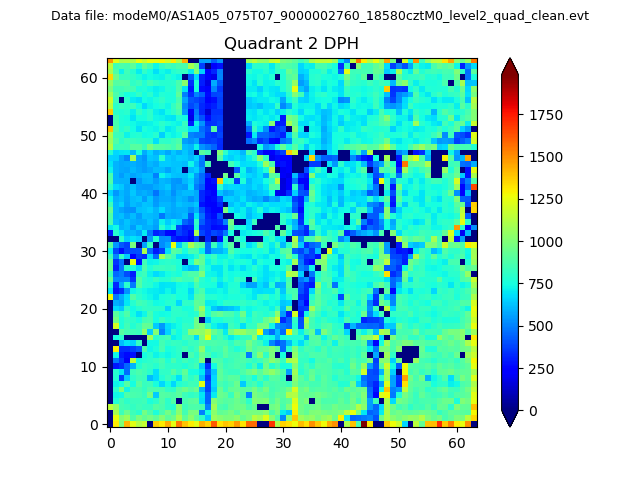
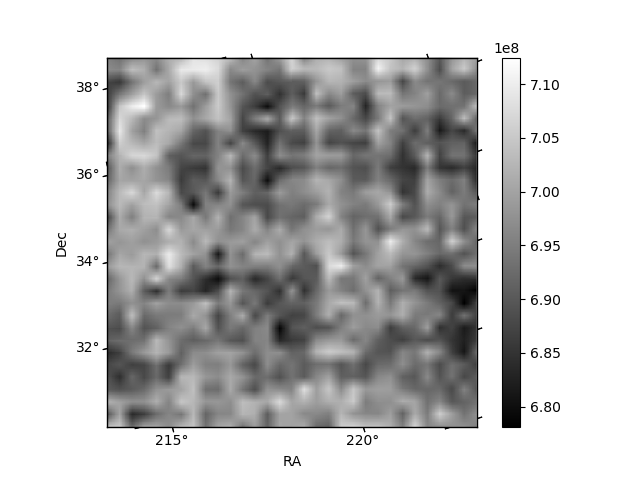
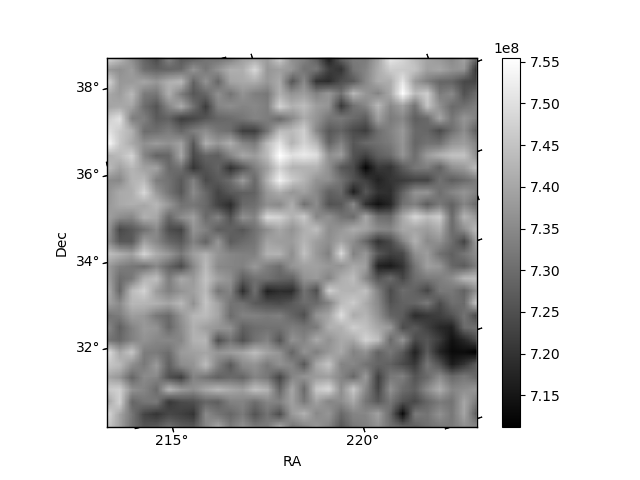
Histogram calculated using DETX and DETY for each event in the final _common_clean file
| Quadrant A | 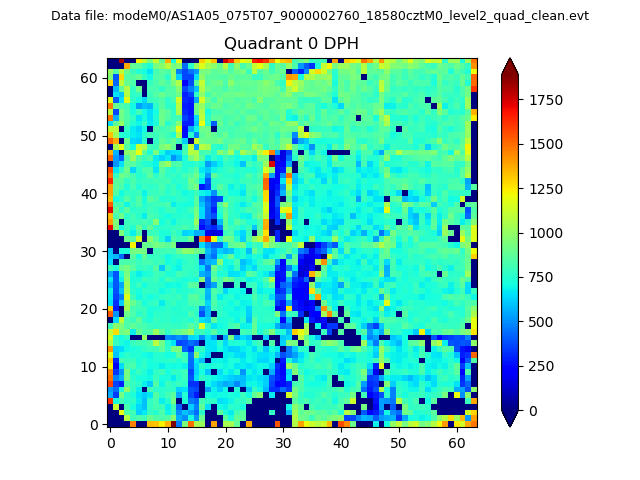 |
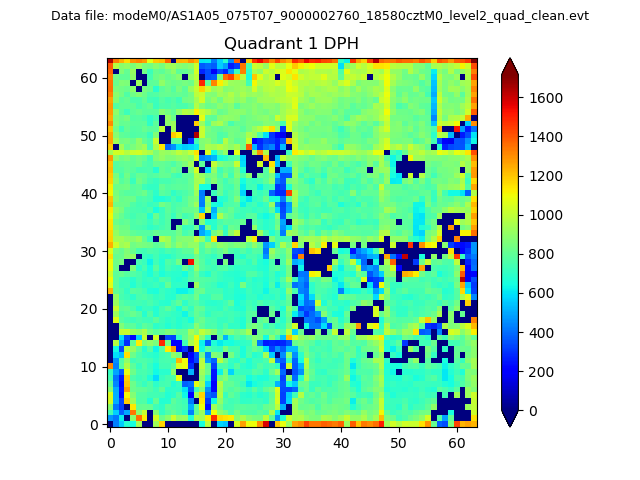 |
Quadrant B |
|---|---|---|---|
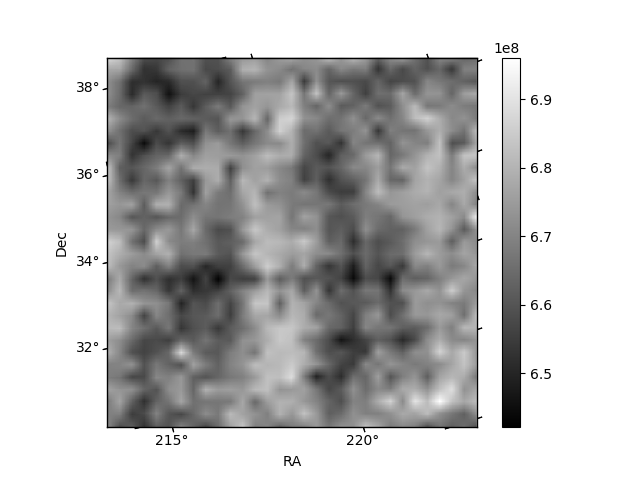
| Quadrant D | 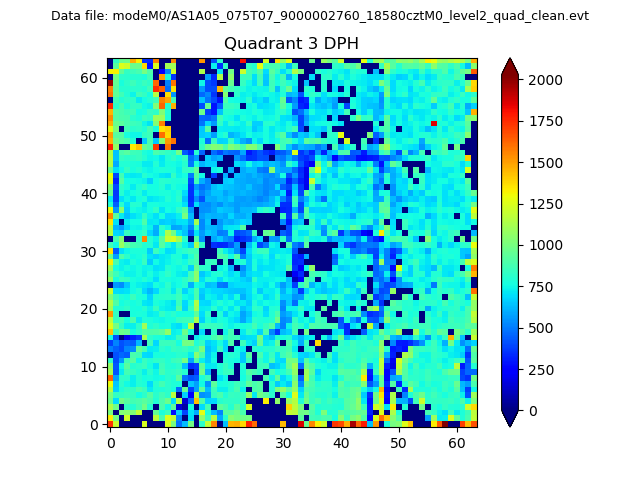 |
 |
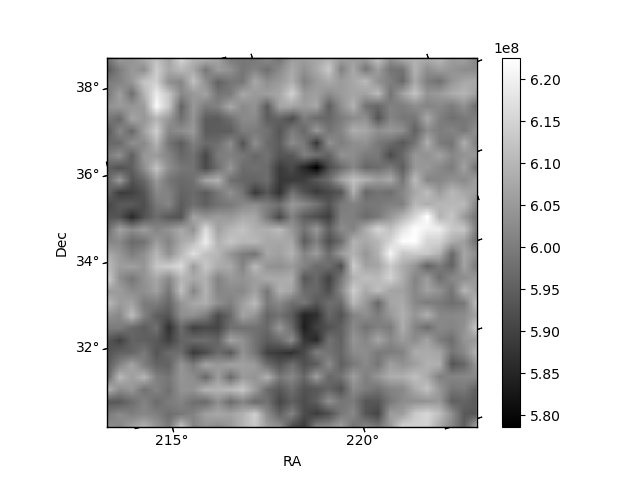
Quadrant C |
| Plot type | Count rate plots | Images |
|---|---|---|
| Comparison with Poisson distribution Blue bars denote a histogram of data divided into 1 sec bins. Red curve is a Poisson curve with rate = median count rate of data. |
 |
 |
| Quadrant-wise count rates Data is divided into 100 sec bins |
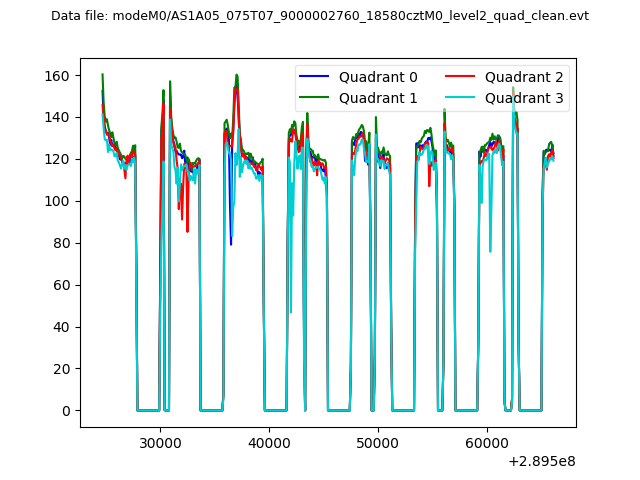 |
|
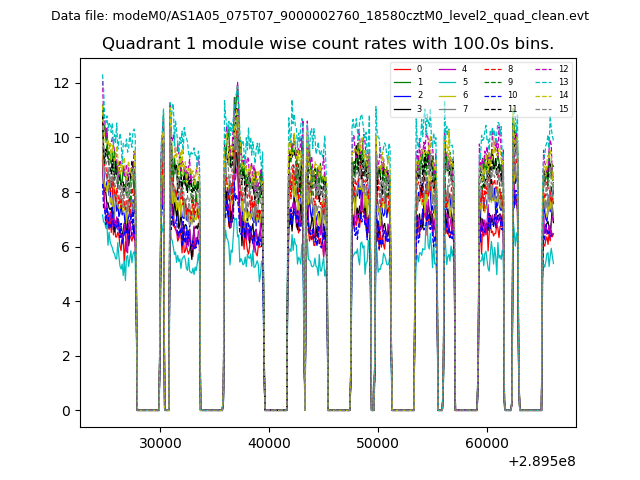
| Module-wise count rates for Quadrant A Data is divided into 100 sec bins |
 |
 |
| Module-wise count rates for Quadrant B Data is divided into 100 sec bins |
 |
 |
| Module-wise count rates for Quadrant C Data is divided into 100 sec bins |
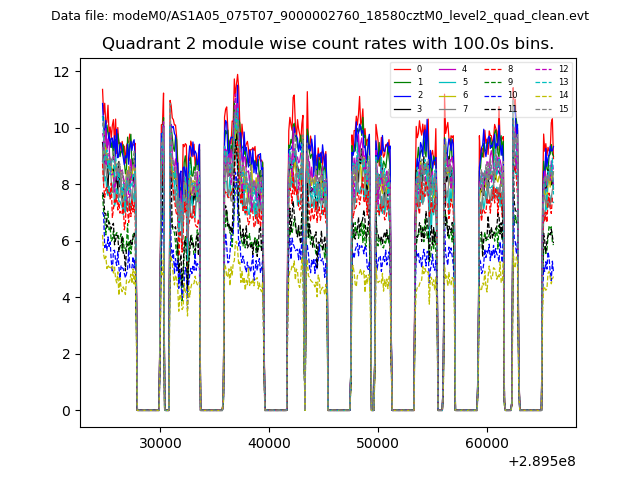 |
 |
| Module-wise count rates for Quadrant D Data is divided into 100 sec bins |
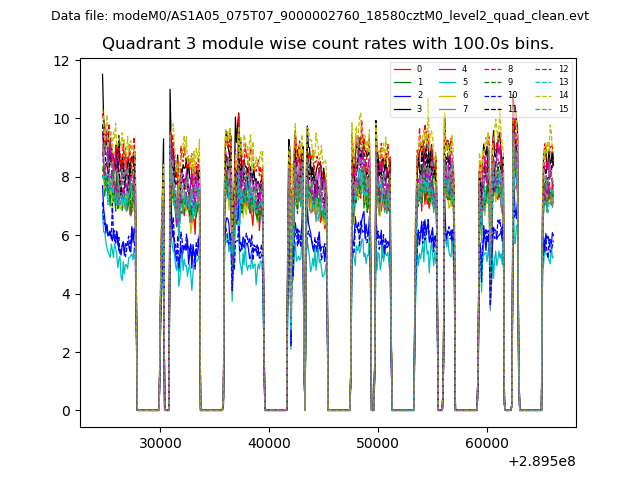 |
 |
| Parameter | Plot |
|---|---|
| CZT HV Monitor | 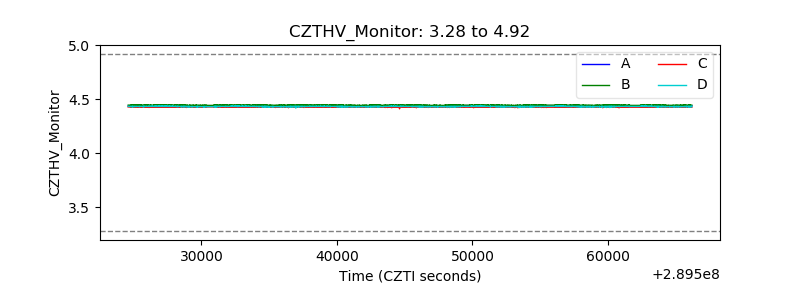 |
| D_VDD | 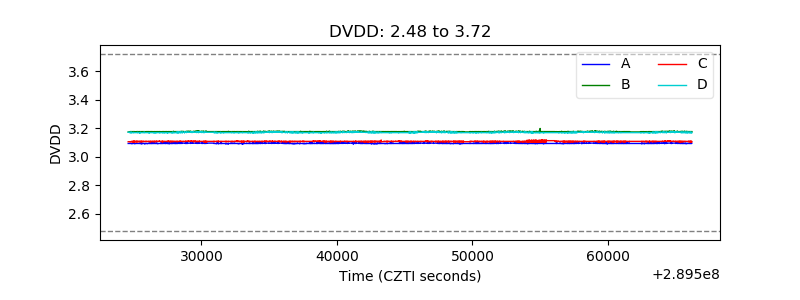 |
| Temperature 1 | 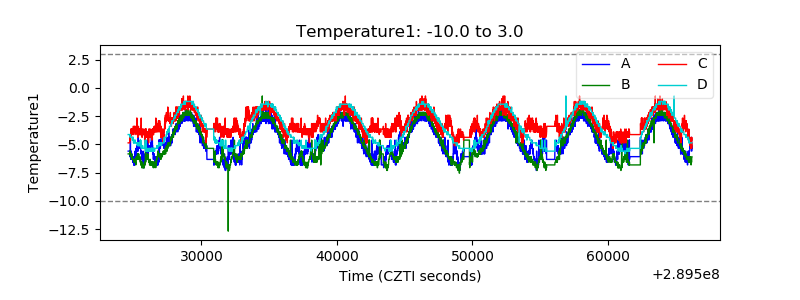 |
| Veto HV Monitor | 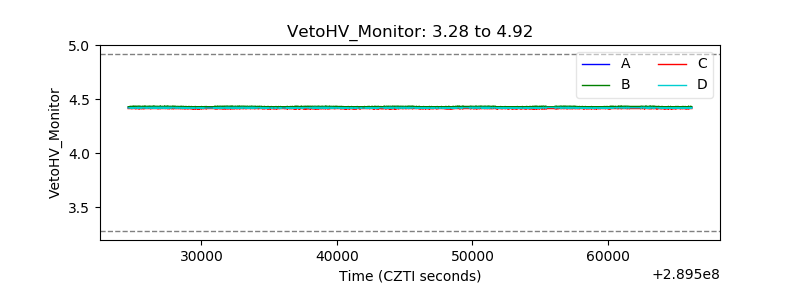 |
| Veto LLD | 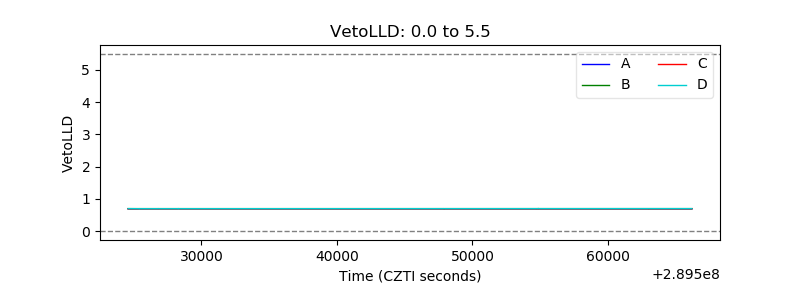 |
| Alpha Counter | 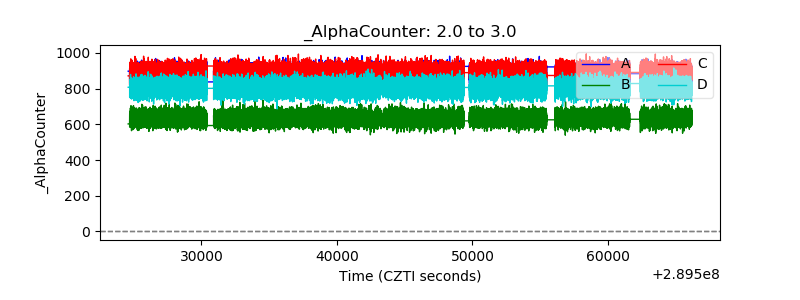 |
| _CPM_Rate | 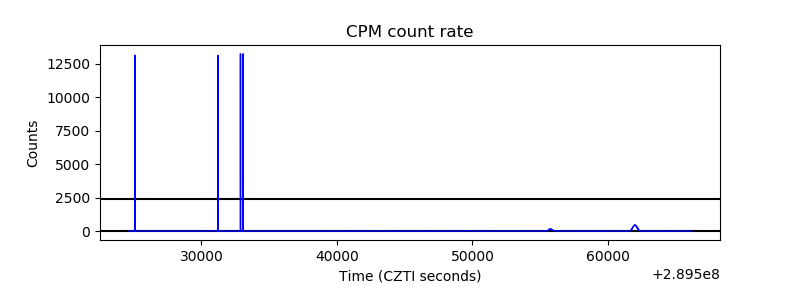 |
| CZT Counter | 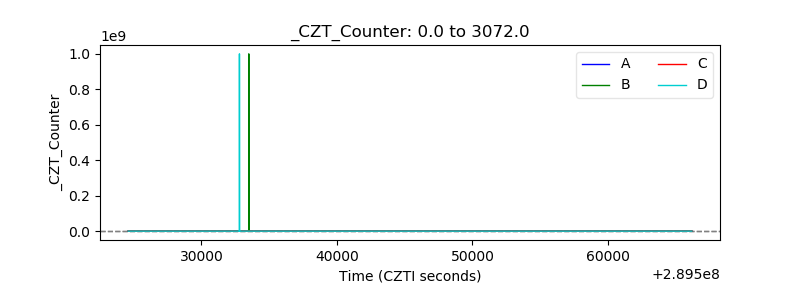 |
| +2.5 Volts monitor |  |
| +5 Volts monitor |  |
| _ROLL_ROT | 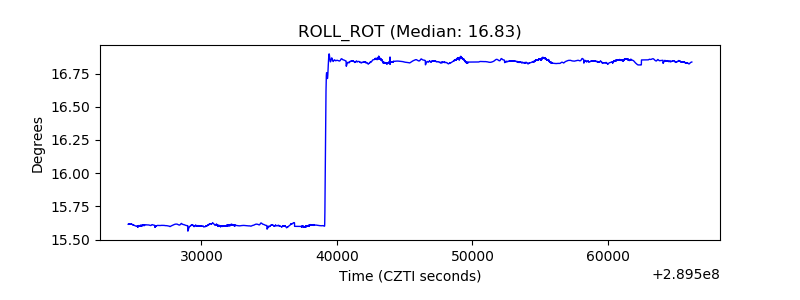 |
| _Roll_DEC | 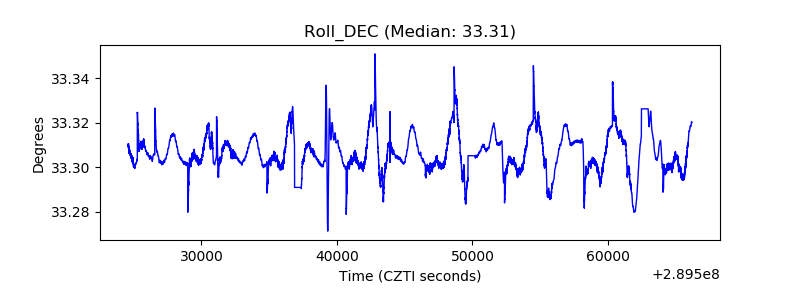 |
| _Roll_RA |  |
| Veto Counter | 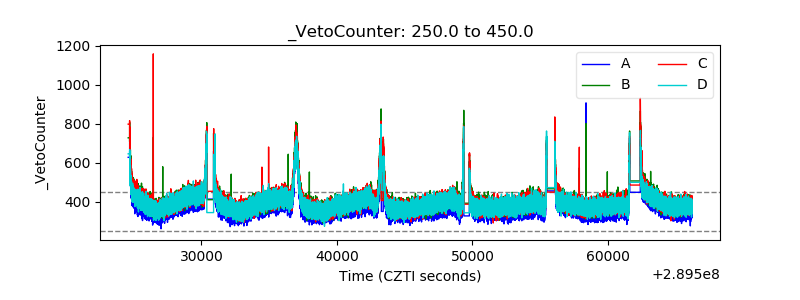 |