| Param | Original file | Final file |
|---|---|---|
| Filename | modeM0/AS1A05_167T01_9000002758cztM0_level2.fits | modeM0/AS1A05_167T01_9000002758cztM0_level2_quad_clean.evt |
| Size (bytes) | 438,747,840 | 360,342,720 |
| Size | 418.4 MB | 343.6 MB |
| Events in quadrant A | 2,727,886 | 2,069,400 |
| Events in quadrant B | 2,633,800 | 2,113,515 |
| Events in quadrant C | 2,704,240 | 2,027,528 |
| Events in quadrant D | 2,294,046 | 1,774,140 |
| Mode SS | |||
|---|---|---|---|
| Quadrant | BADHDUFLAG | Total packets | Discarded packets |
| A | 0 | 874 | 0 |
| B | 0 | 874 | 0 |
| C | 0 | 874 | 0 |
| D | 0 | 874 | 0 |
| Mode M0 | |||
|---|---|---|---|
| Quadrant | BADHDUFLAG | Total packets | Discarded packets |
| A | 0 | 91856 | 0 |
| B | 0 | 92444 | 0 |
| C | 0 | 93423 | 0 |
| D | 0 | 127079 | 0 |
| Mode M9 | |||
|---|---|---|---|
| Quadrant | BADHDUFLAG | Total packets | Discarded packets |
| A | 0 | 96 | 0 |
| B | 0 | 96 | 0 |
| C | 0 | 96 | 0 |
| D | 0 | 96 | 0 |
| Quadrant | Total seconds | Saturated seconds | Saturation percentage |
|---|---|---|---|
| A | 42621 | 655 | 1.536801% |
| B | 42621 | 666 | 1.562610% |
| C | 42621 | 773 | 1.813660% |
| D | 42621 | 3021 | 7.088055% |
Noise dominated data is calculated using 1-second bins in cleaned event files. If a bin has >2000 counts, and if more than 50% of those come from <1% of pixels, then it is considered to be noise-dominated and hence unusable.
| Quadrant | # 1 sec bins | Bins with >0 counts | Bins with >2000 counts | High rate bins dominated by noise | Noise dominated (total time) | Noise dominated (detector-on time) | Marked lightcurve |
|---|---|---|---|---|---|---|---|
| A | 52362 | 42616 | 0 | 0 | 0.00% | 0.00% |  |
| B | 52362 | 42613 | 0 | 0 | 0.00% | 0.00% |  |
| C | 52362 | 42610 | 0 | 0 | 0.00% | 0.00% | 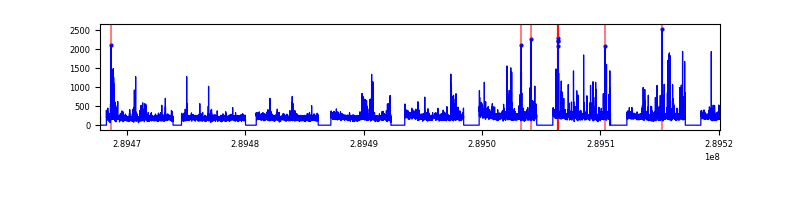 |
| D | 52362 | 42581 | 0 | 0 | 0.00% | 0.00% |  |
Top three noisy pixels from each quadrant. If the there are fewer than three noisy pixels in the level2.evt file, extra rows are filled as -1
| Pixel properties | Quadrant properties | ||||||
|---|---|---|---|---|---|---|---|
| Quadrant | DetID | PixID | Counts | Sigma | Mean | Median | Sigma |
| A | 0 | 29 | 2650 | 11.2 | 711 | 668 | 176.8 |
| A | 7 | 110 | 2138 | 8.31 | 711 | 668 | 176.8 |
| A | 0 | 30 | 2077 | 7.96 | 711 | 668 | 176.8 |
| B | 2 | 9 | 2030 | 9.86 | 696 | 665 | 138.4 |
| B | 5 | 128 | 1779 | 8.05 | 696 | 665 | 138.4 |
| B | 3 | 17 | 1720 | 7.62 | 696 | 665 | 138.4 |
| C | 1 | 81 | 2075 | 7.62 | 714 | 670 | 184.4 |
| C | 1 | 80 | 2073 | 7.61 | 714 | 670 | 184.4 |
| C | 12 | 250 | 1839 | 6.34 | 714 | 670 | 184.4 |
| D | 10 | 190 | 1783 | 6.89 | 655 | 600 | 171.7 |
| D | 10 | 189 | 1662 | 6.19 | 655 | 600 | 171.7 |
| D | 6 | 67 | 1662 | 6.19 | 655 | 600 | 171.7 |
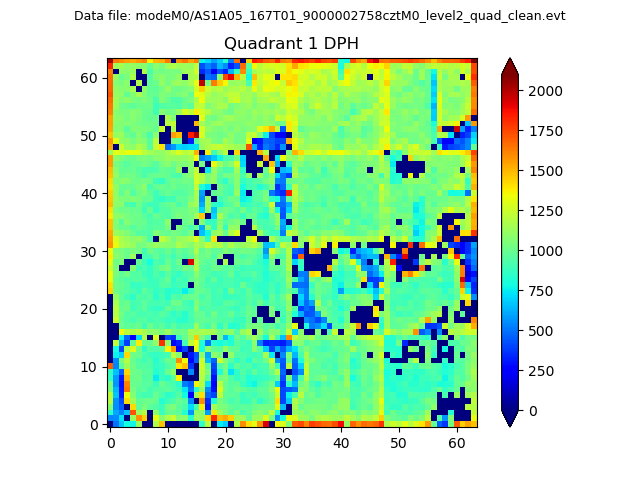
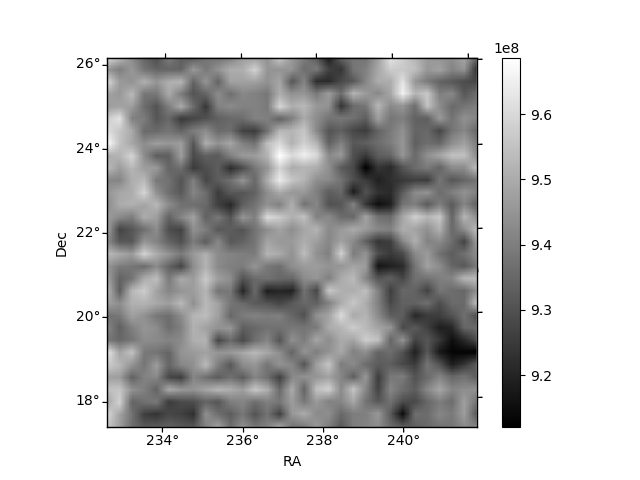
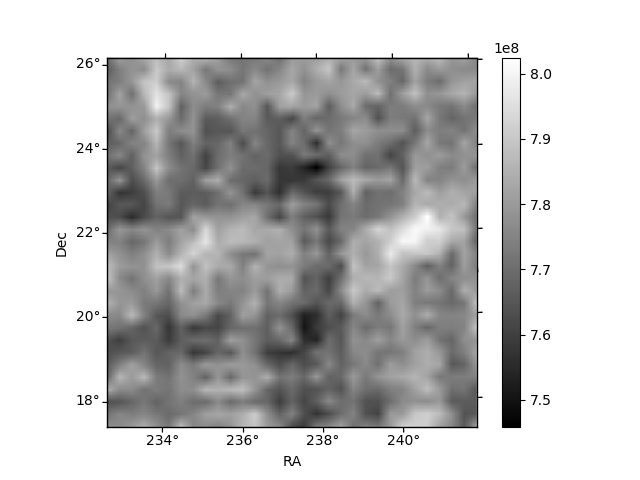
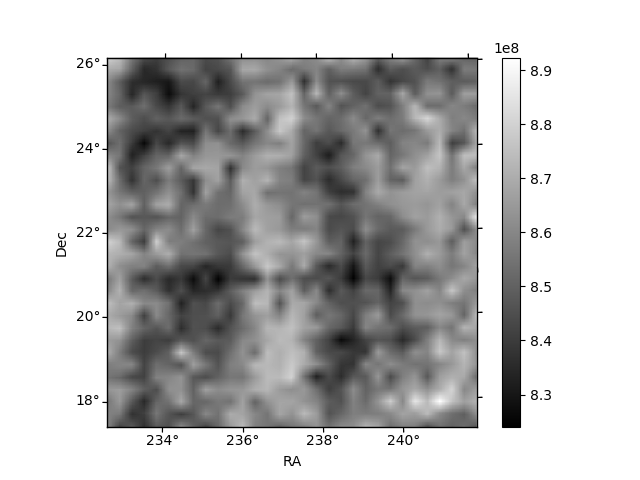
Histogram calculated using DETX and DETY for each event in the final _common_clean file
| Quadrant A |  |
 |
Quadrant B |
|---|---|---|---|
| Quadrant D | 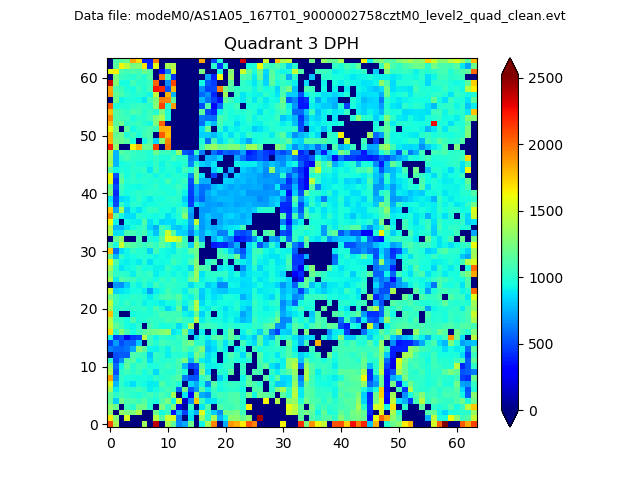 |
 |
Quadrant C |
| Plot type | Count rate plots | Images |
|---|---|---|
| Comparison with Poisson distribution Blue bars denote a histogram of data divided into 1 sec bins. Red curve is a Poisson curve with rate = median count rate of data. |
 |
 |
| Quadrant-wise count rates Data is divided into 100 sec bins |
 |
|
| Module-wise count rates for Quadrant A Data is divided into 100 sec bins |
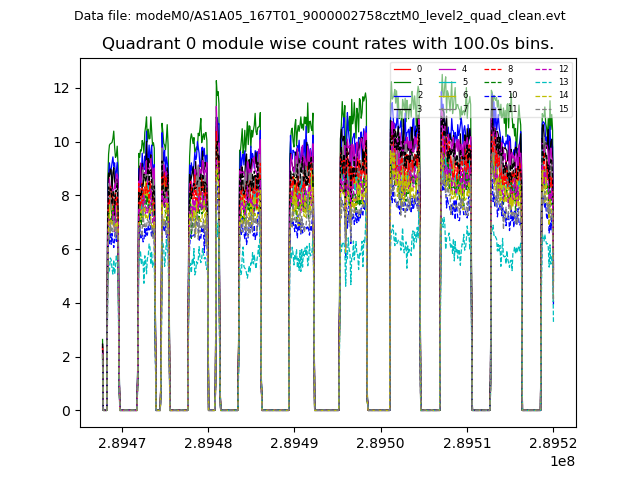 |
 |
| Module-wise count rates for Quadrant B Data is divided into 100 sec bins |
 |
 |
| Module-wise count rates for Quadrant C Data is divided into 100 sec bins |
 |
 |
| Module-wise count rates for Quadrant D Data is divided into 100 sec bins |
 |
 |
| Parameter | Plot |
|---|---|
| CZT HV Monitor | 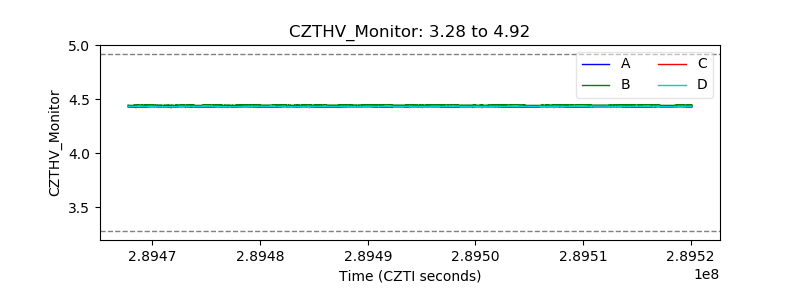 |
| D_VDD |  |
| Temperature 1 | 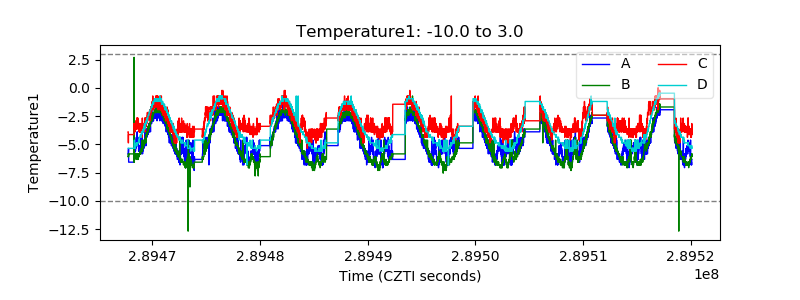 |
| Veto HV Monitor |  |
| Veto LLD |  |
| Alpha Counter |  |
| _CPM_Rate | 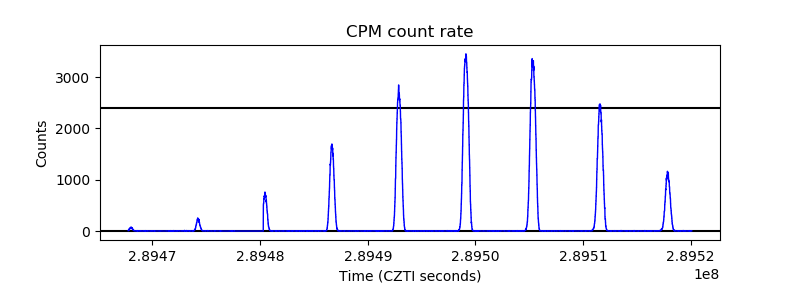 |
| CZT Counter |  |
| +2.5 Volts monitor | 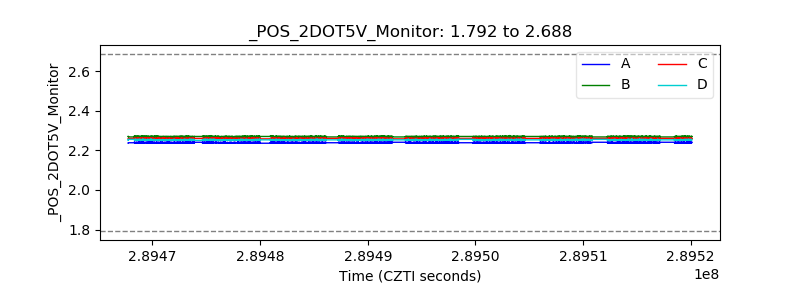 |
| +5 Volts monitor |  |
| _ROLL_ROT |  |
| _Roll_DEC | 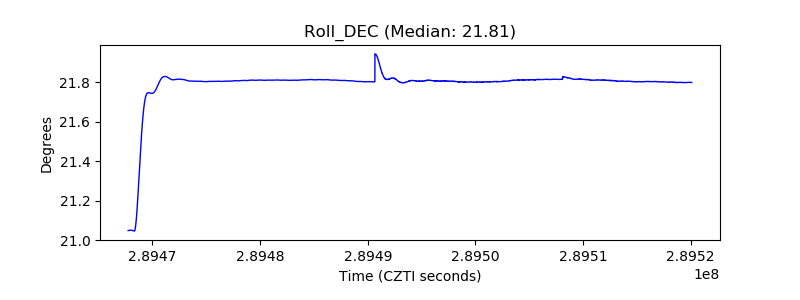 |
| _Roll_RA |  |
| Veto Counter | 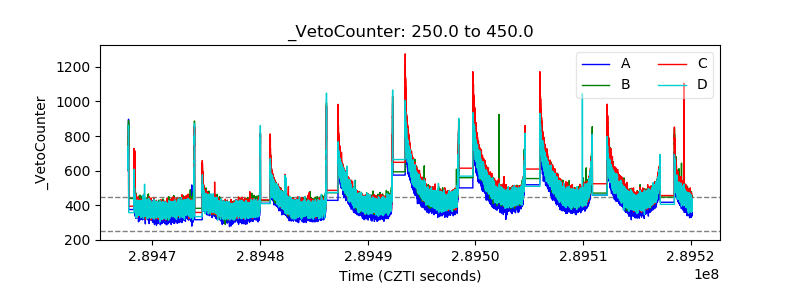 |