| Param | Original file | Final file |
|---|---|---|
| Filename | modeM0/AS1A05_167T01_9000002758_18564cztM0_level2.evt | modeM0/AS1A05_167T01_9000002758_18564cztM0_level2_quad_clean.evt |
| Size (bytes) | 522,221,760 | 87,759,360 |
| Size | 498.0 MB | 83.7 MB |
| Events in quadrant A | 3,578,538 | 535,230 |
| Events in quadrant B | 3,637,919 | 559,535 |
| Events in quadrant C | 3,513,157 | 538,182 |
| Events in quadrant D | 4,598,635 | 524,840 |
| Mode SS | |||
|---|---|---|---|
| Quadrant | BADHDUFLAG | Total packets | Discarded packets |
| A | 0 | 148 | 0 |
| B | 0 | 148 | 0 |
| C | 0 | 148 | 0 |
| D | 0 | 148 | 0 |
| Mode M0 | |||
|---|---|---|---|
| Quadrant | BADHDUFLAG | Total packets | Discarded packets |
| A | 0 | 15184 | 2 |
| B | 0 | 15345 | 2 |
| C | 0 | 14937 | 2 |
| D | 0 | 18319 | 2 |
| Mode M9 | |||
|---|---|---|---|
| Quadrant | BADHDUFLAG | Total packets | Discarded packets |
| A | 0 | 12 | 0 |
| B | 0 | 12 | 0 |
| C | 0 | 12 | 0 |
| D | 0 | 12 | 0 |
| Quadrant | Total seconds | Saturated seconds | Saturation percentage |
|---|---|---|---|
| A | 7174 | 202 | 2.815723% |
| B | 7174 | 193 | 2.690270% |
| C | 7173 | 132 | 1.840234% |
| D | 7173 | 287 | 4.001115% |
Noise dominated data is calculated using 1-second bins in cleaned event files. If a bin has >2000 counts, and if more than 50% of those come from <1% of pixels, then it is considered to be noise-dominated and hence unusable.
| Quadrant | # 1 sec bins | Bins with >0 counts | Bins with >2000 counts | High rate bins dominated by noise | Noise dominated (total time) | Noise dominated (detector-on time) | Marked lightcurve |
|---|---|---|---|---|---|---|---|
| A | 8395 | 7175 | 3 | 3 | 0.04% | 0.04% | 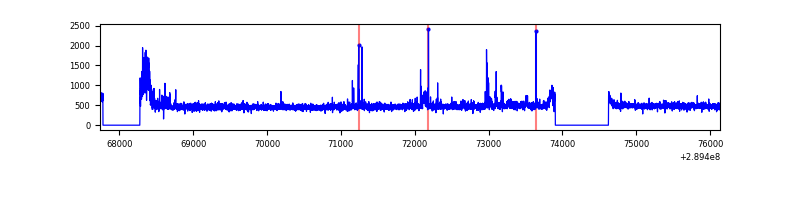 |
| B | 8395 | 7175 | 77 | 77 | 0.92% | 1.07% | 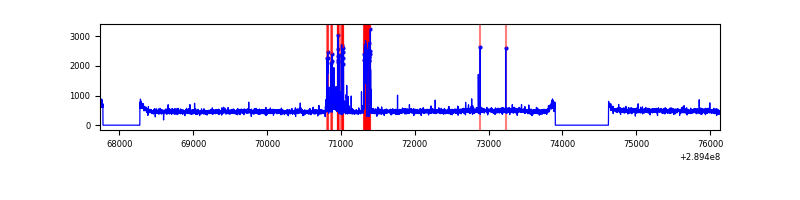 |
| C | 8394 | 7174 | 11 | 11 | 0.13% | 0.15% | 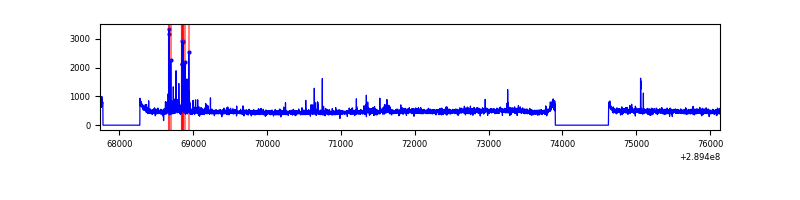 |
| D | 8394 | 7174 | 157 | 157 | 1.87% | 2.19% | 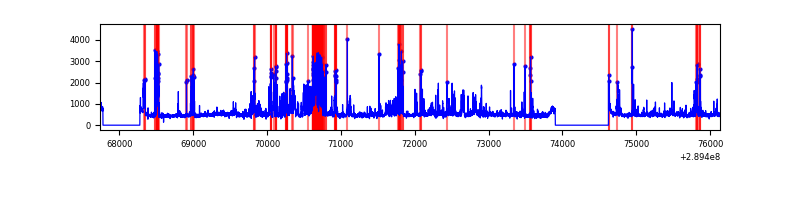 |
Top three noisy pixels from each quadrant. If the there are fewer than three noisy pixels in the level2.evt file, extra rows are filled as -1
| Pixel properties | Quadrant properties | ||||||
|---|---|---|---|---|---|---|---|
| Quadrant | DetID | PixID | Counts | Sigma | Mean | Median | Sigma |
| A | 14 | 111 | 246111 | 1406.44 | 862 | 840 | 174.4 |
| A | 13 | 254 | 10857 | 57.44 | 862 | 840 | 174.4 |
| A | 0 | 226 | 7575 | 38.62 | 862 | 840 | 174.4 |
| B | 0 | 229 | 174582 | 1038.94 | 858 | 835 | 167.2 |
| B | 7 | 220 | 94503 | 560.1 | 858 | 835 | 167.2 |
| B | 12 | 111 | 20385 | 116.9 | 858 | 835 | 167.2 |
| C | 4 | 254 | 139998 | 707.3 | 829 | 833 | 196.8 |
| C | 14 | 238 | 127564 | 644.11 | 829 | 833 | 196.8 |
| C | 9 | 54 | 13765 | 65.73 | 829 | 833 | 196.8 |
| D | 1 | 52 | 848319 | 4152.76 | 835 | 810 | 204.1 |
| D | 7 | 238 | 503248 | 2461.93 | 835 | 810 | 204.1 |
| D | 7 | 38 | 43813 | 210.71 | 835 | 810 | 204.1 |
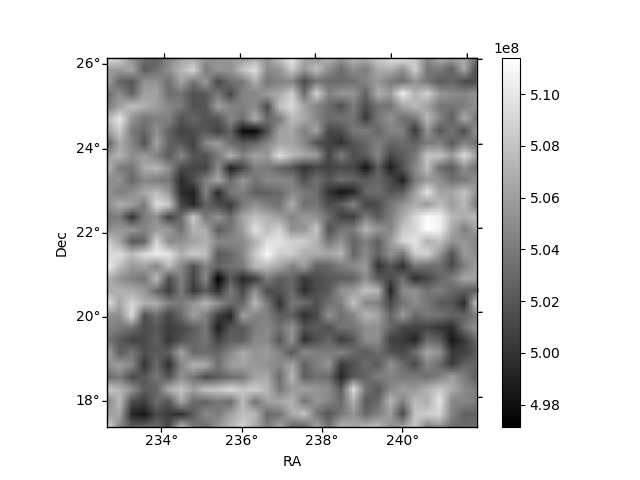
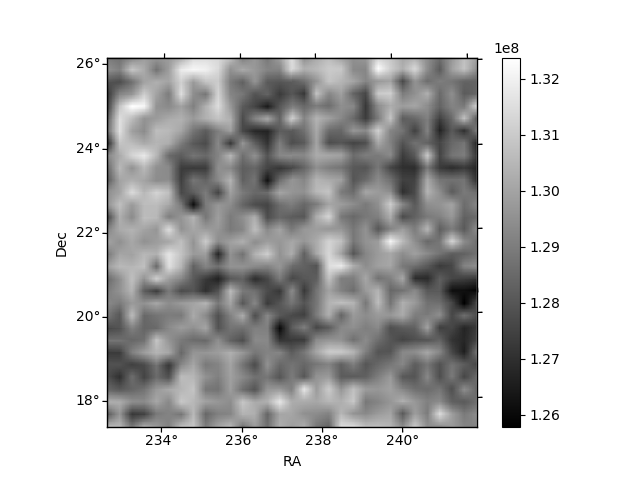
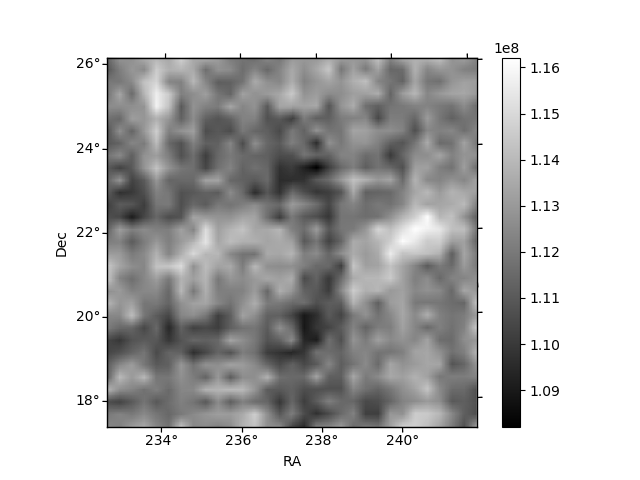
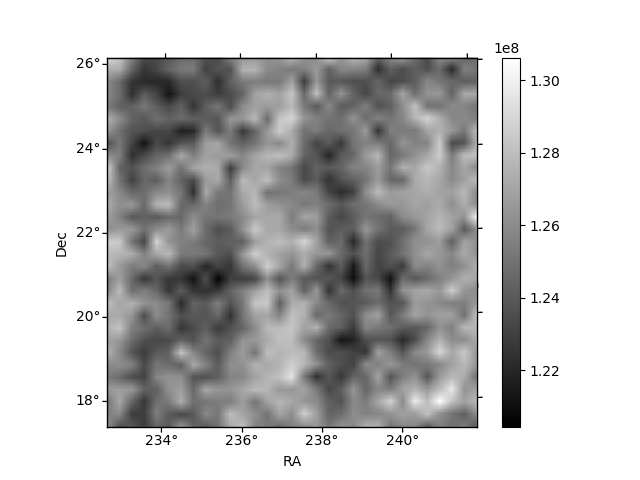
Histogram calculated using DETX and DETY for each event in the final _common_clean file
| Quadrant A | 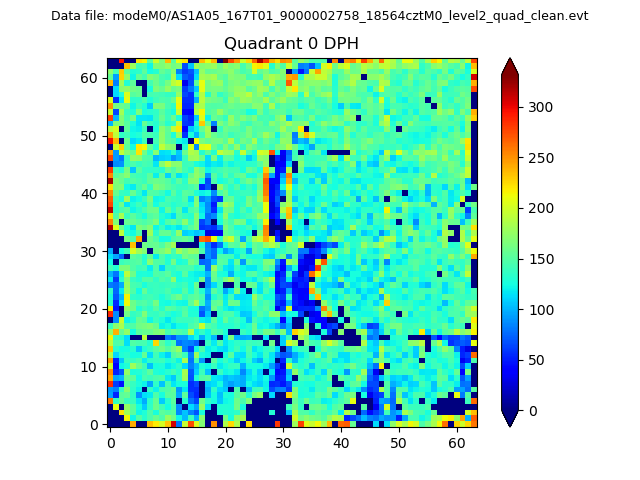 |
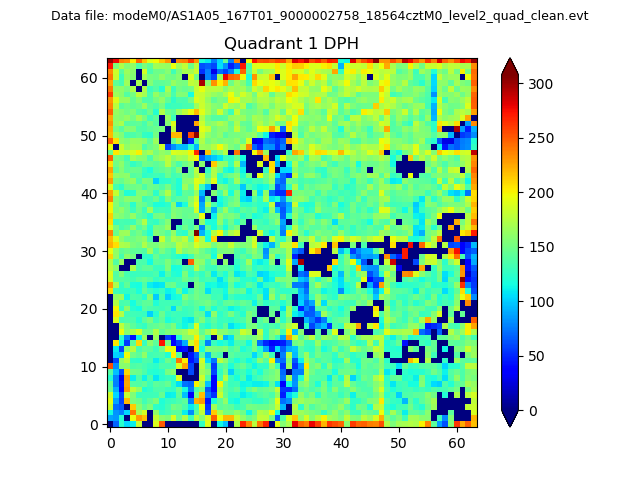 |
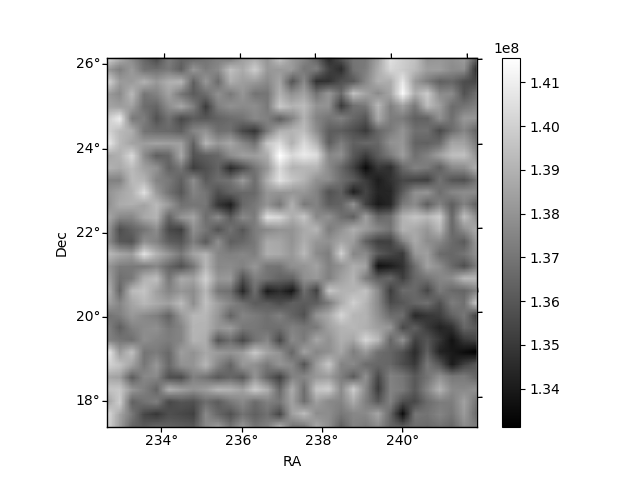
Quadrant B |
|---|---|---|---|
| Quadrant D | 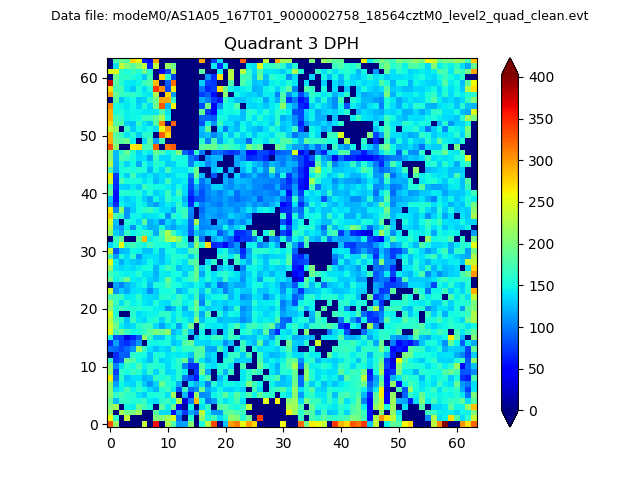 |
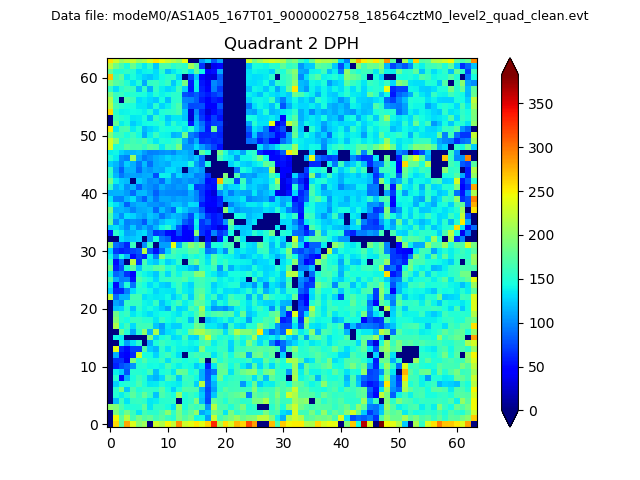 |
Quadrant C |
| Plot type | Count rate plots | Images |
|---|---|---|
| Comparison with Poisson distribution Blue bars denote a histogram of data divided into 1 sec bins. Red curve is a Poisson curve with rate = median count rate of data. |
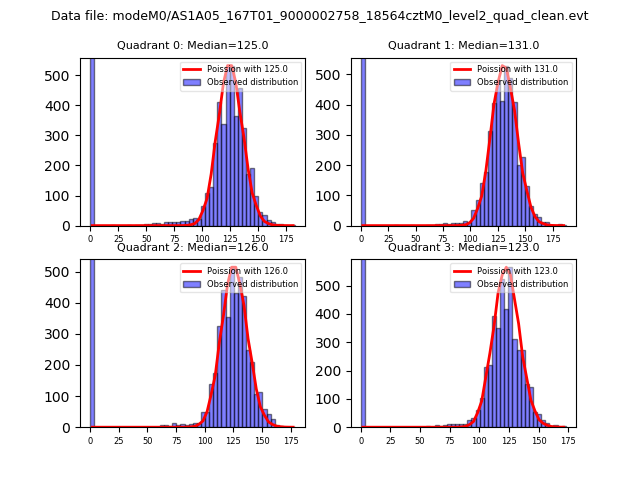 |
 |
| Quadrant-wise count rates Data is divided into 100 sec bins |
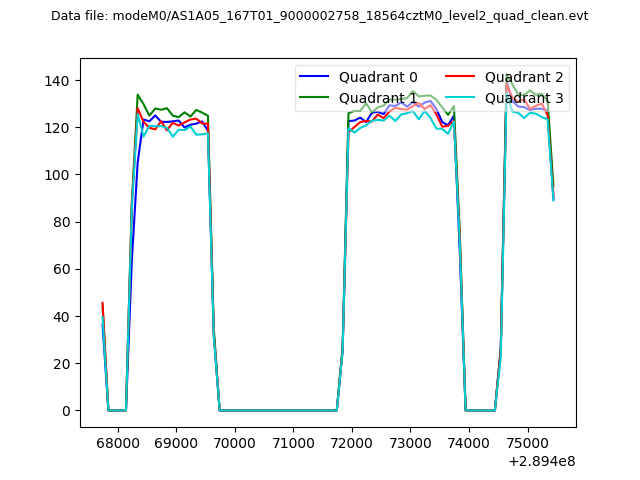 |
|
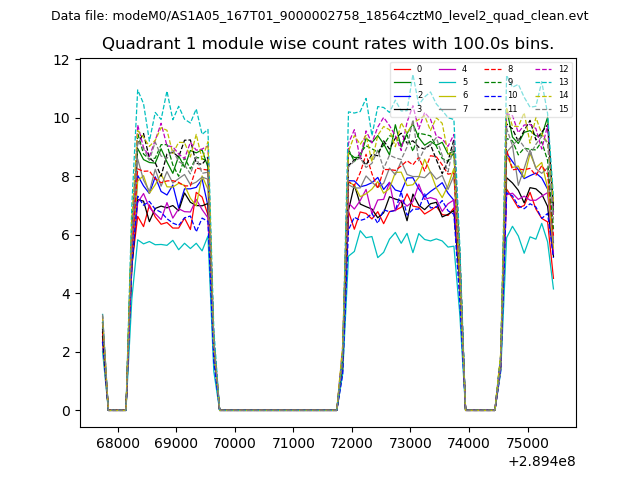
| Module-wise count rates for Quadrant A Data is divided into 100 sec bins |
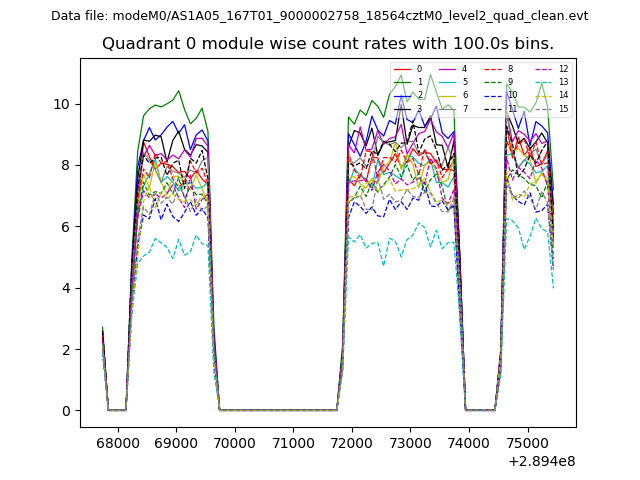 |
 |
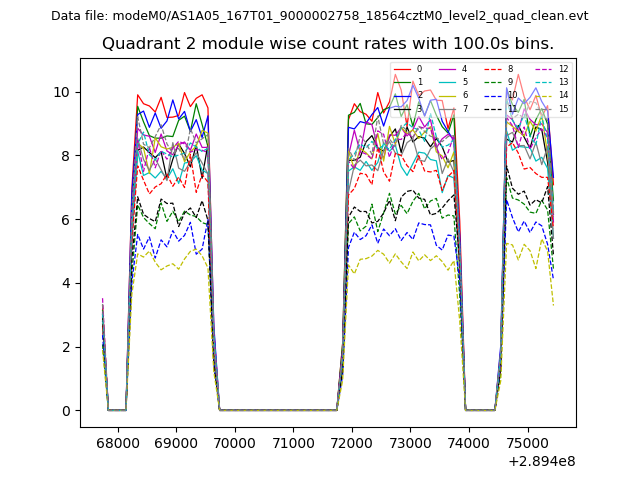
| Module-wise count rates for Quadrant B Data is divided into 100 sec bins |
 |
 |
| Module-wise count rates for Quadrant C Data is divided into 100 sec bins |
 |
 |
| Module-wise count rates for Quadrant D Data is divided into 100 sec bins |
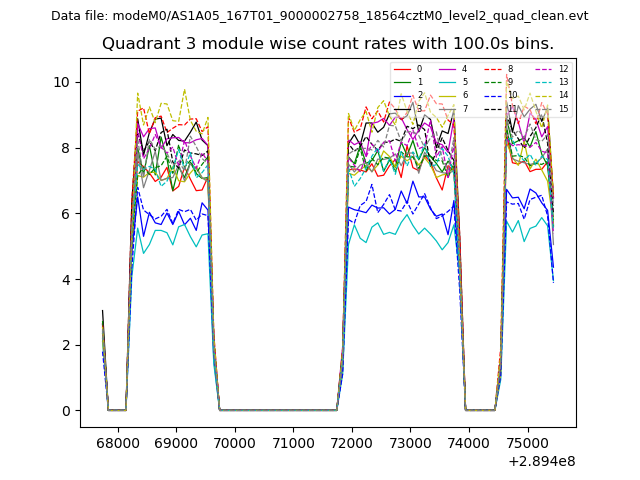 |
 |
| Parameter | Plot |
|---|---|
| CZT HV Monitor | 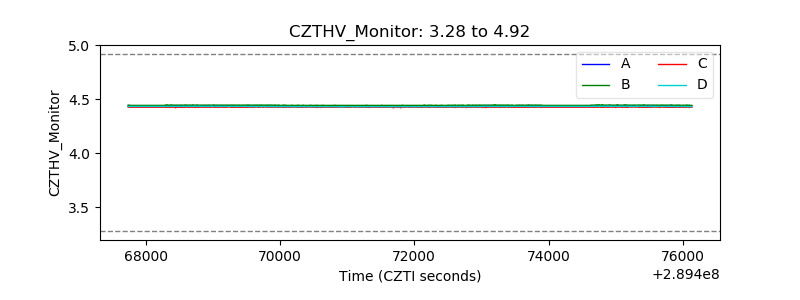 |
| D_VDD | 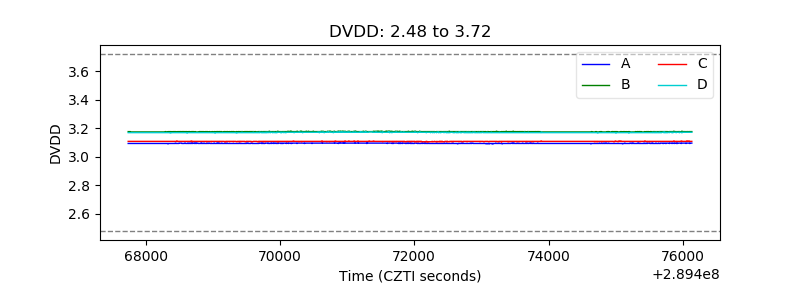 |
| Temperature 1 | 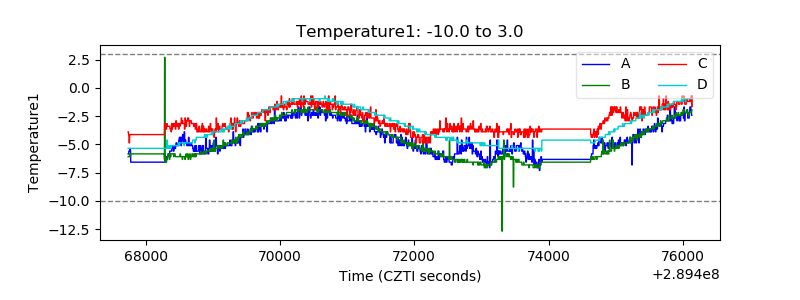 |
| Veto HV Monitor | 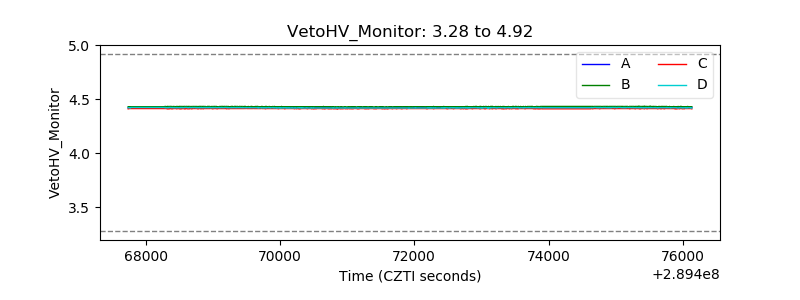 |
| Veto LLD | 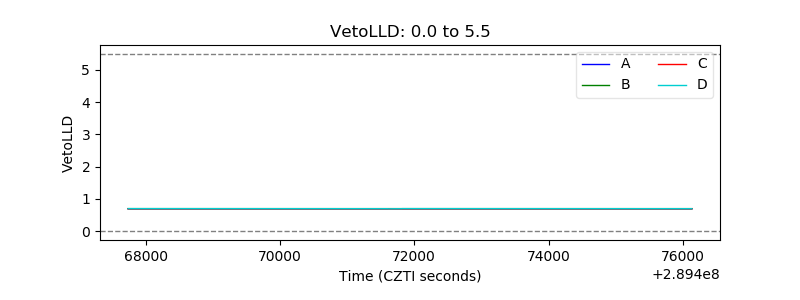 |
| Alpha Counter | 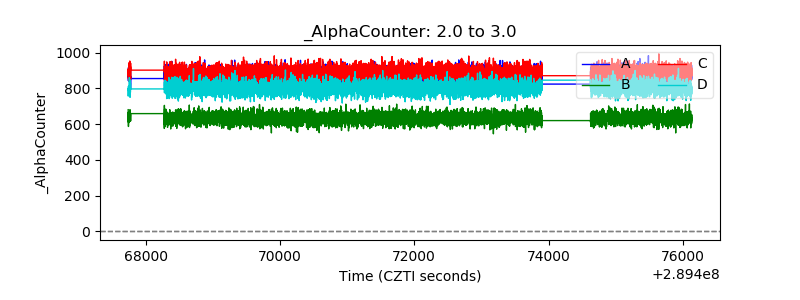 |
| _CPM_Rate | 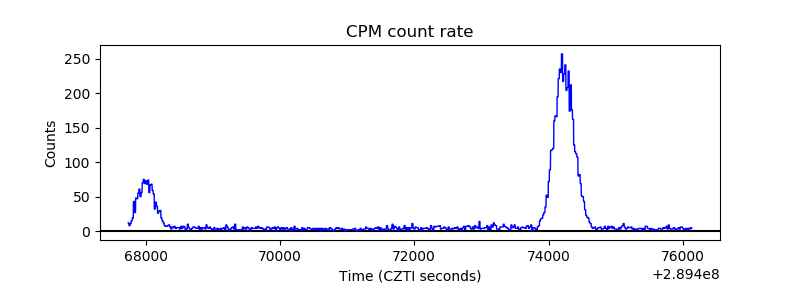 |
| CZT Counter | 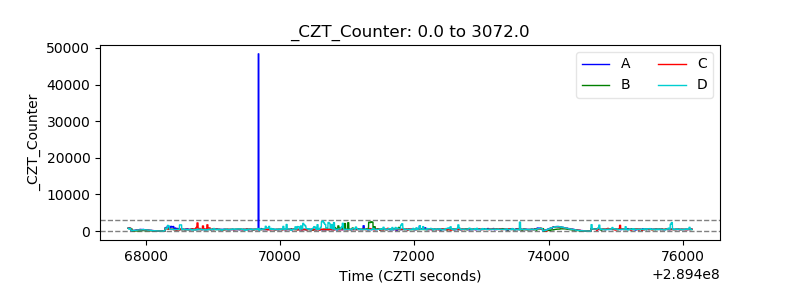 |
| +2.5 Volts monitor | 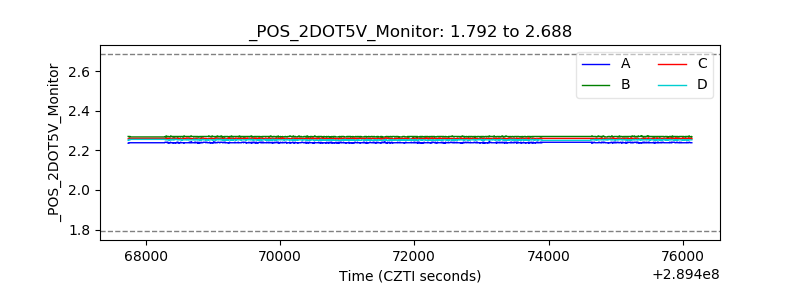 |
| +5 Volts monitor | 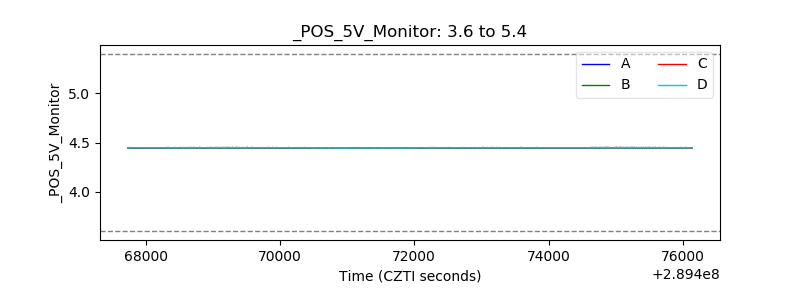 |
| _ROLL_ROT | 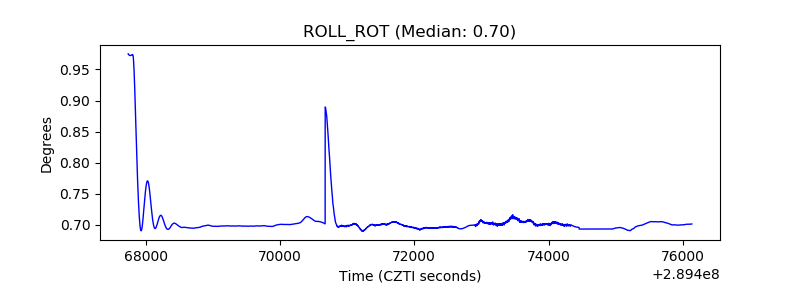 |
| _Roll_DEC |  |
| _Roll_RA | 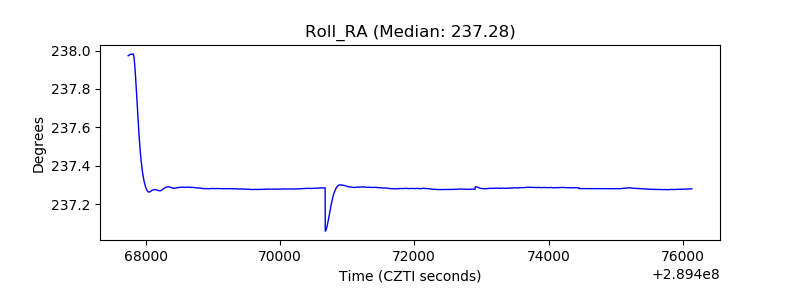 |
| Veto Counter | 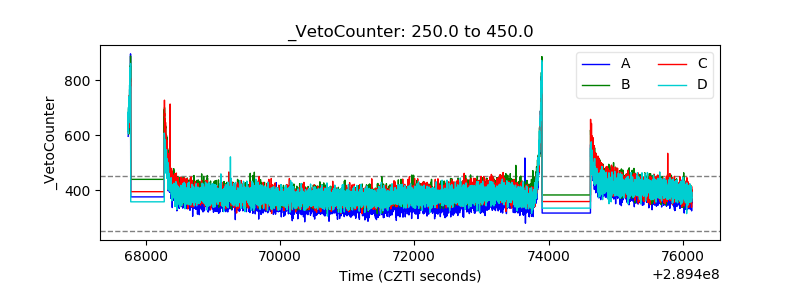 |