| Param | Original file | Final file |
|---|---|---|
| Filename | modeM0/AS1A05_167T01_9000002758_18566cztM0_level2.evt | modeM0/AS1A05_167T01_9000002758_18566cztM0_level2_quad_clean.evt |
| Size (bytes) | 500,823,360 | 66,528,000 |
| Size | 477.6 MB | 63.4 MB |
| Events in quadrant A | 3,332,941 | 390,099 |
| Events in quadrant B | 3,481,433 | 397,785 |
| Events in quadrant C | 3,376,977 | 384,927 |
| Events in quadrant D | 4,521,634 | 374,658 |
| Mode SS | |||
|---|---|---|---|
| Quadrant | BADHDUFLAG | Total packets | Discarded packets |
| A | 0 | 136 | 0 |
| B | 0 | 136 | 0 |
| C | 0 | 136 | 0 |
| D | 0 | 136 | 0 |
| Mode M0 | |||
|---|---|---|---|
| Quadrant | BADHDUFLAG | Total packets | Discarded packets |
| A | 0 | 14178 | 2 |
| B | 0 | 14503 | 2 |
| C | 0 | 14135 | 2 |
| D | 0 | 17978 | 2 |
| Mode M9 | |||
|---|---|---|---|
| Quadrant | BADHDUFLAG | Total packets | Discarded packets |
| A | 0 | 11 | 0 |
| B | 0 | 12 | 0 |
| C | 0 | 12 | 0 |
| D | 0 | 12 | 0 |
| Quadrant | Total seconds | Saturated seconds | Saturation percentage |
|---|---|---|---|
| A | 6698 | 54 | 0.806211% |
| B | 6698 | 90 | 1.343685% |
| C | 6697 | 68 | 1.015380% |
| D | 6697 | 244 | 3.643422% |
Noise dominated data is calculated using 1-second bins in cleaned event files. If a bin has >2000 counts, and if more than 50% of those come from <1% of pixels, then it is considered to be noise-dominated and hence unusable.
| Quadrant | # 1 sec bins | Bins with >0 counts | Bins with >2000 counts | High rate bins dominated by noise | Noise dominated (total time) | Noise dominated (detector-on time) | Marked lightcurve |
|---|---|---|---|---|---|---|---|
| A | 7768 | 6698 | 0 | 0 | 0.00% | 0.00% | 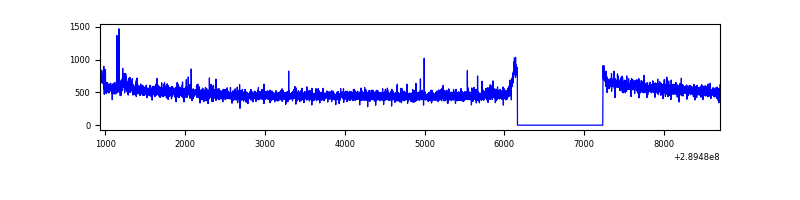 |
| B | 7768 | 6698 | 19 | 19 | 0.24% | 0.28% | 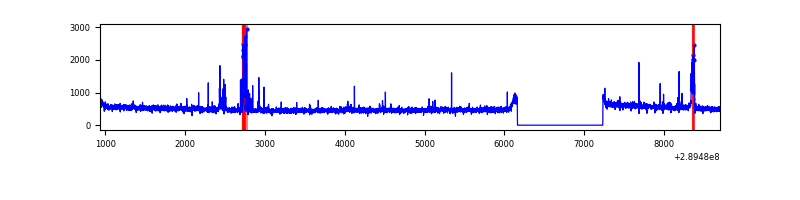 |
| C | 7767 | 6697 | 0 | 0 | 0.00% | 0.00% | 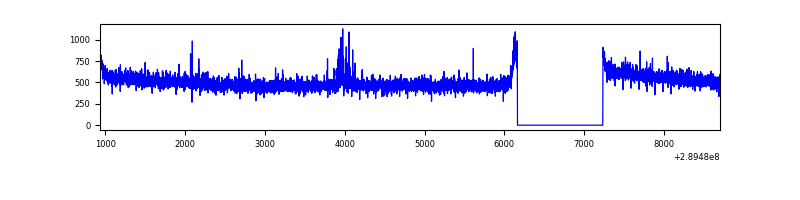 |
| D | 7767 | 6697 | 151 | 151 | 1.94% | 2.25% | 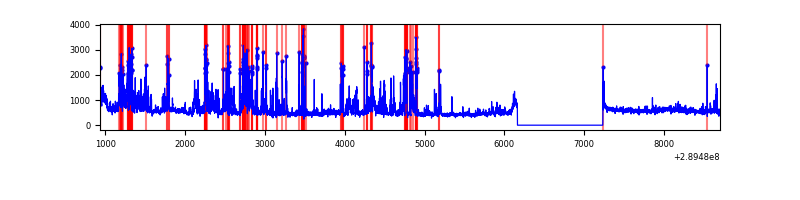 |
Top three noisy pixels from each quadrant. If the there are fewer than three noisy pixels in the level2.evt file, extra rows are filled as -1
| Pixel properties | Quadrant properties | ||||||
|---|---|---|---|---|---|---|---|
| Quadrant | DetID | PixID | Counts | Sigma | Mean | Median | Sigma |
| A | 6 | 16 | 26378 | 146.53 | 857 | 840 | 174.3 |
| A | 13 | 254 | 11387 | 60.52 | 857 | 840 | 174.3 |
| A | 0 | 226 | 7529 | 38.38 | 857 | 840 | 174.3 |
| B | 7 | 220 | 67895 | 410.7 | 851 | 829 | 163.3 |
| B | 0 | 190 | 56182 | 338.97 | 851 | 829 | 163.3 |
| B | 12 | 111 | 19160 | 112.26 | 851 | 829 | 163.3 |
| C | 14 | 238 | 128145 | 661.73 | 821 | 825 | 192.4 |
| C | 4 | 254 | 34571 | 175.39 | 821 | 825 | 192.4 |
| C | 13 | 61 | 5781 | 25.76 | 821 | 825 | 192.4 |
| D | 7 | 238 | 1056081 | 5239.48 | 826 | 803 | 201.4 |
| D | 1 | 52 | 310476 | 1537.53 | 826 | 803 | 201.4 |
| D | 2 | 234 | 28056 | 135.31 | 826 | 803 | 201.4 |
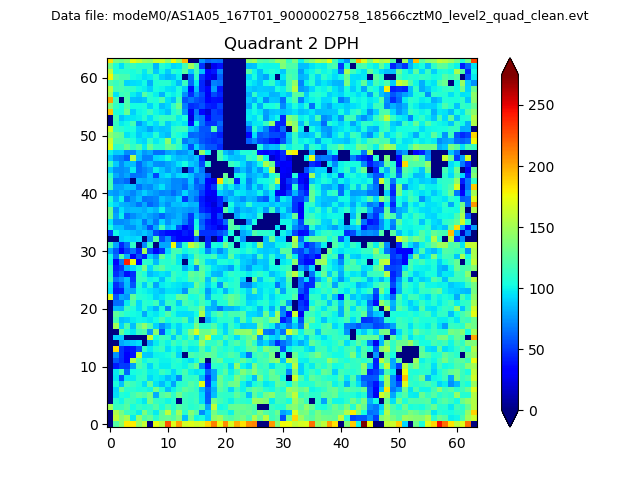
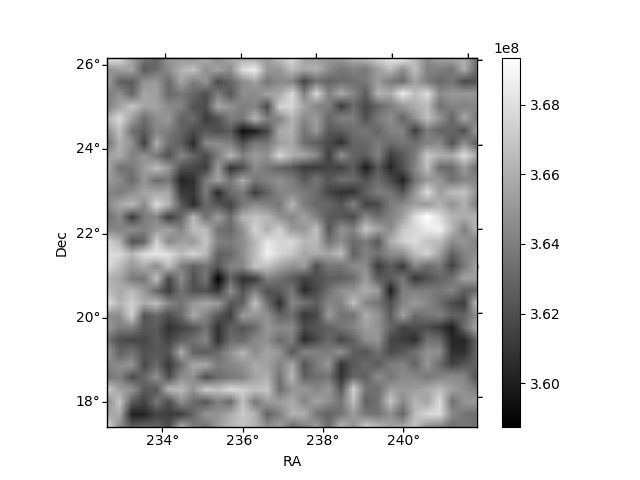
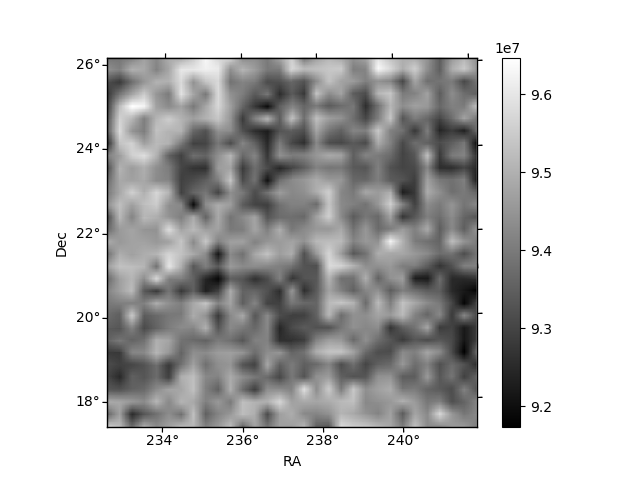
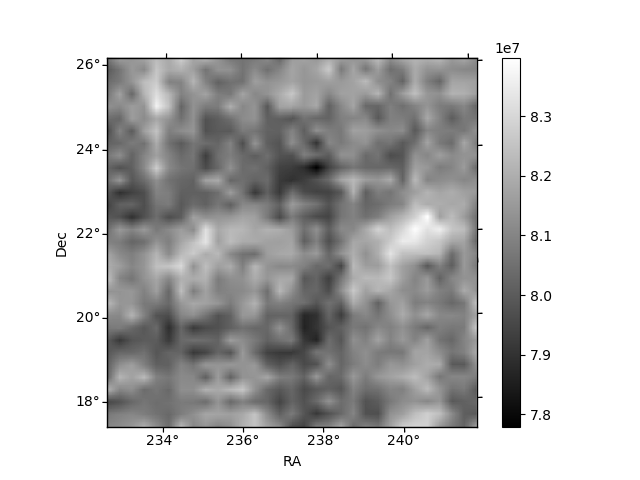
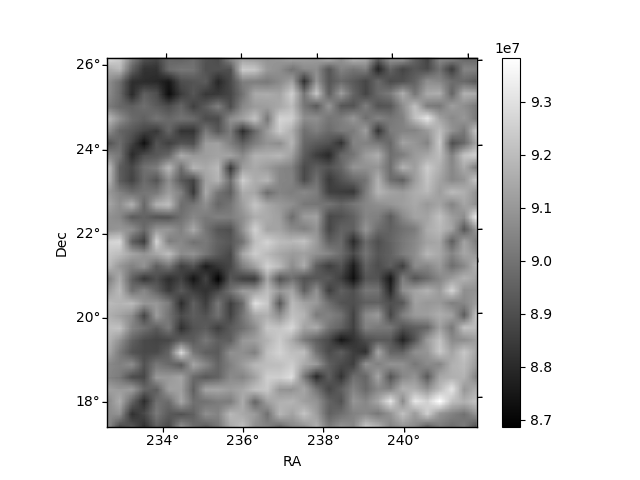
Histogram calculated using DETX and DETY for each event in the final _common_clean file
| Quadrant A | 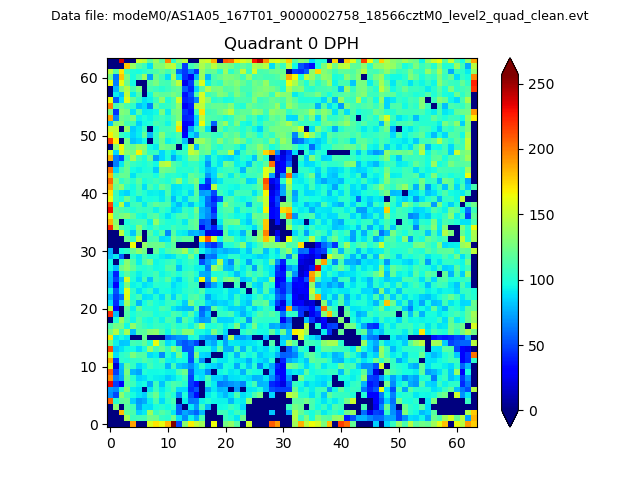 |
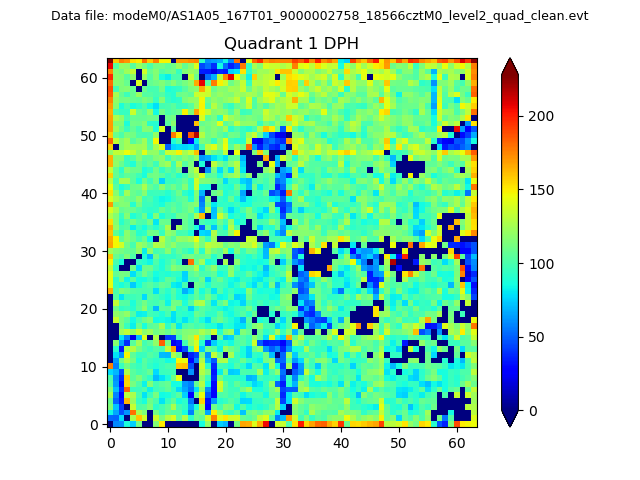 |
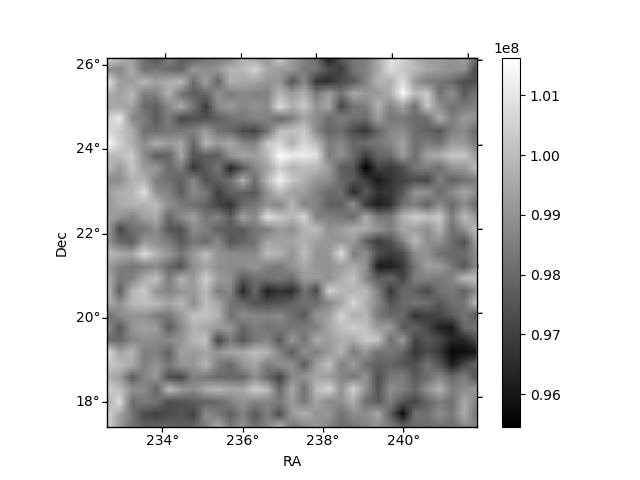
Quadrant B |
|---|---|---|---|
| Quadrant D | 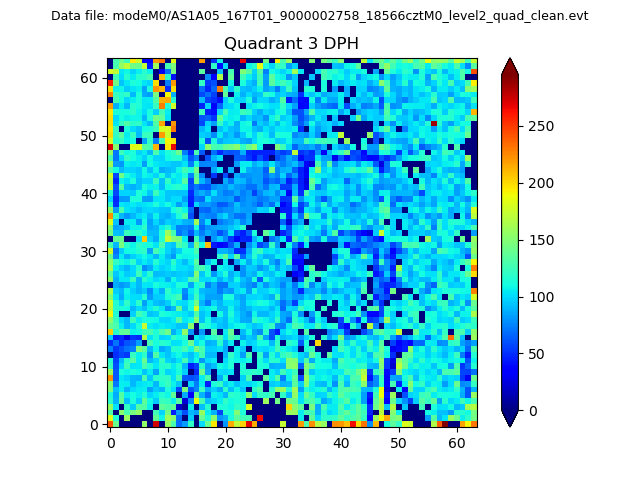 |
 |
Quadrant C |
| Plot type | Count rate plots | Images |
|---|---|---|
| Comparison with Poisson distribution Blue bars denote a histogram of data divided into 1 sec bins. Red curve is a Poisson curve with rate = median count rate of data. |
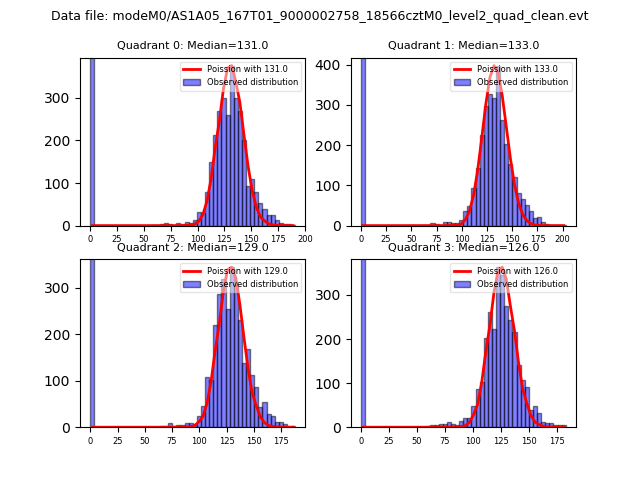 |
 |
| Quadrant-wise count rates Data is divided into 100 sec bins |
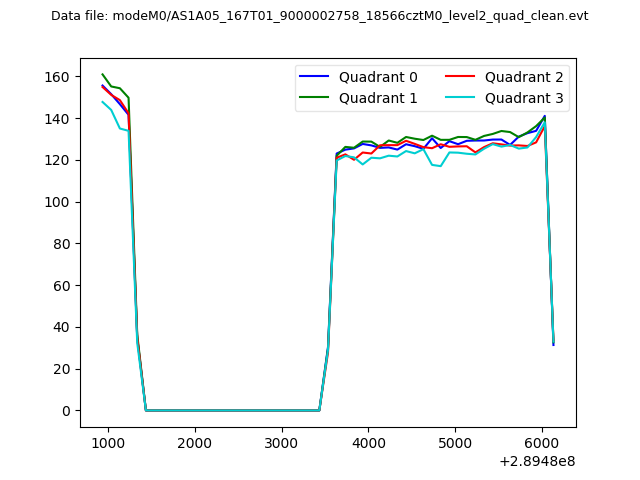 |
|
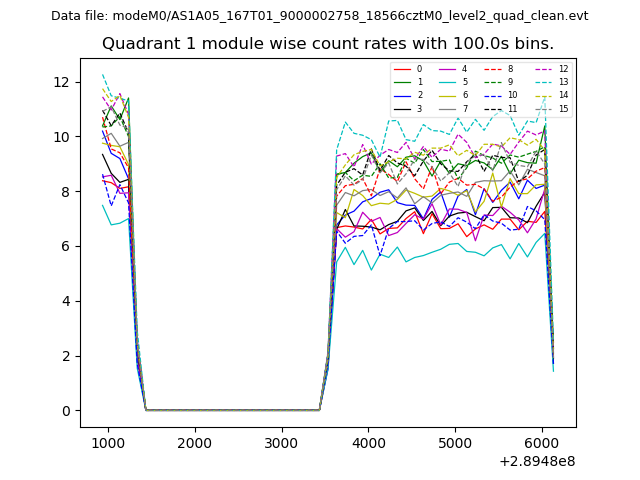
| Module-wise count rates for Quadrant A Data is divided into 100 sec bins |
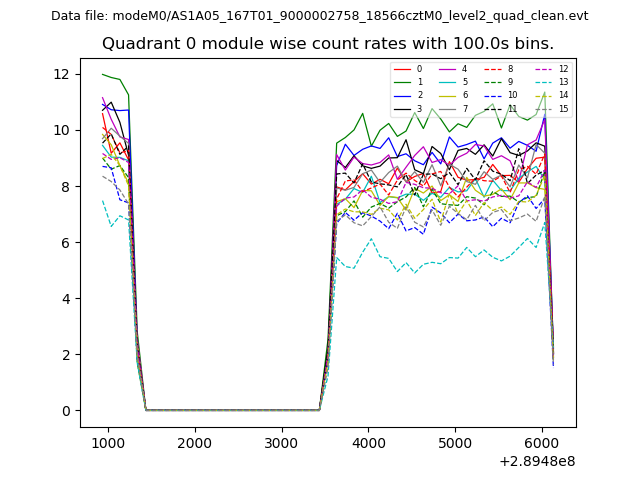 |
 |
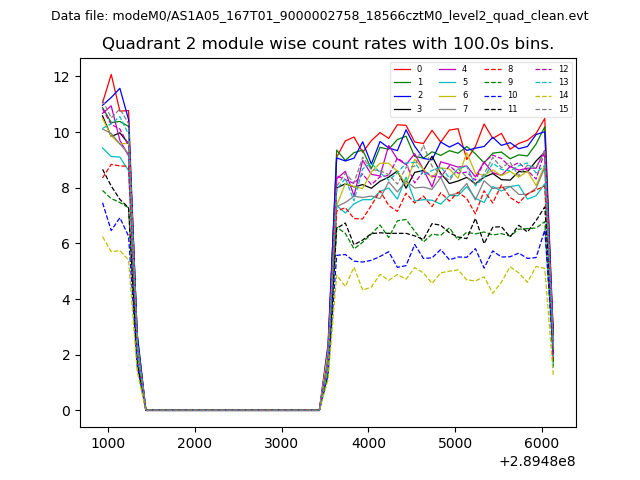
| Module-wise count rates for Quadrant B Data is divided into 100 sec bins |
 |
 |
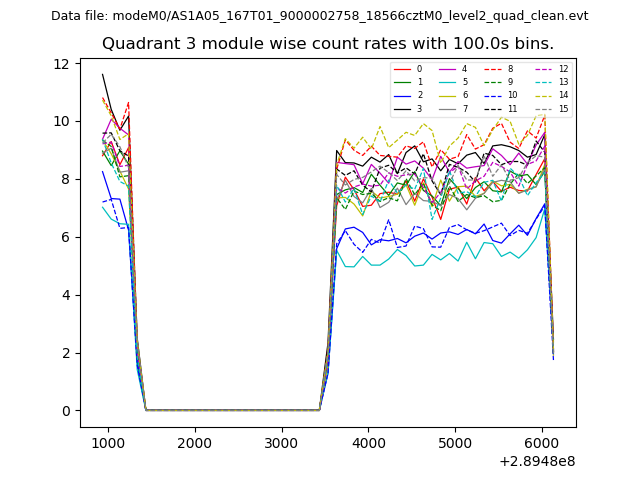
| Module-wise count rates for Quadrant C Data is divided into 100 sec bins |
 |
 |
| Module-wise count rates for Quadrant D Data is divided into 100 sec bins |
 |
 |
| Parameter | Plot |
|---|---|
| CZT HV Monitor | 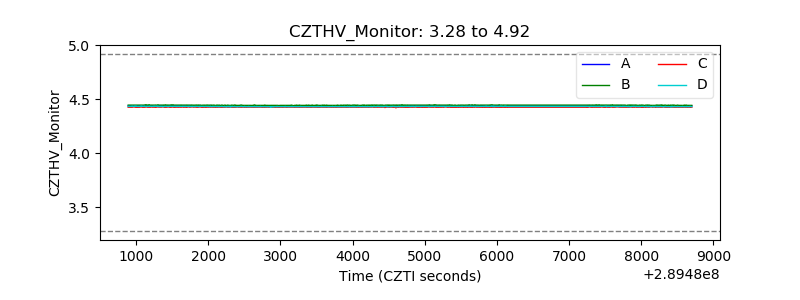 |
| D_VDD | 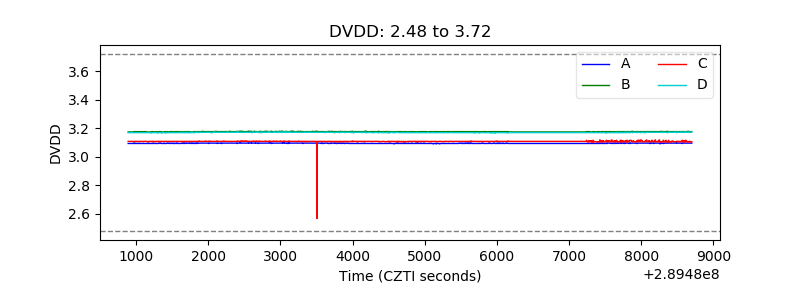 |
| Temperature 1 | 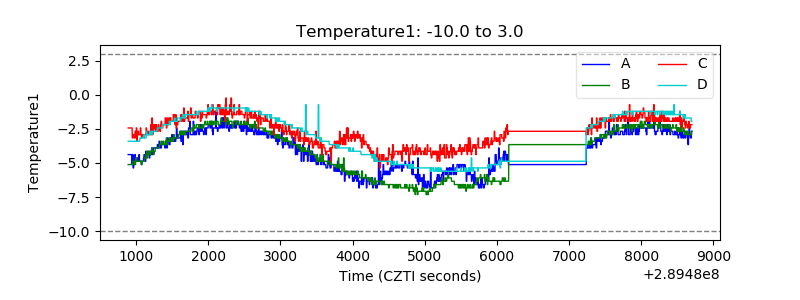 |
| Veto HV Monitor | 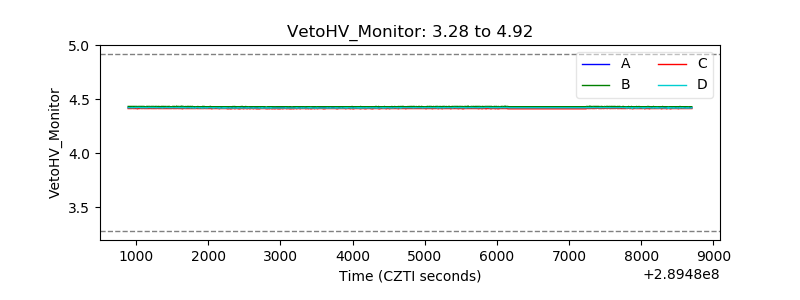 |
| Veto LLD | 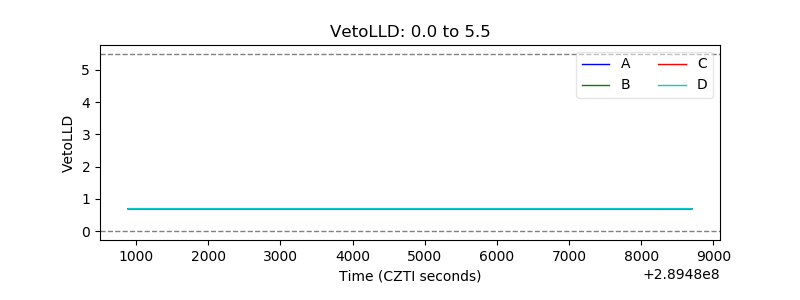 |
| Alpha Counter | 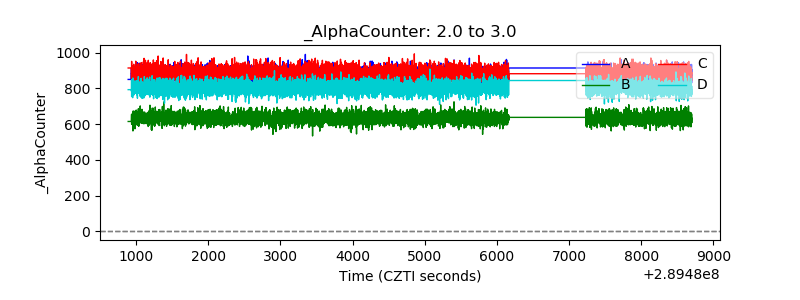 |
| _CPM_Rate | 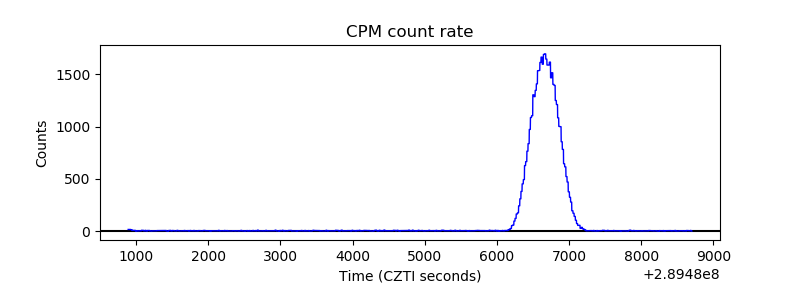 |
| CZT Counter | 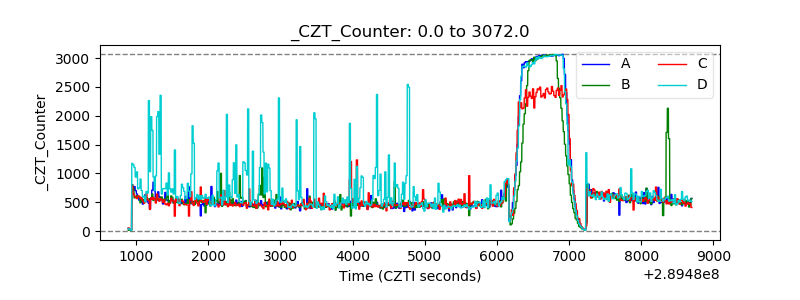 |
| +2.5 Volts monitor | 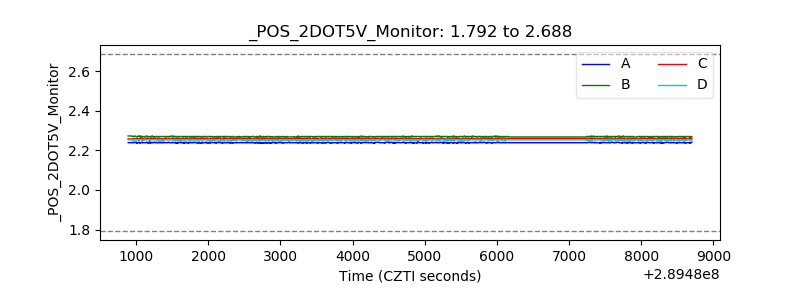 |
| +5 Volts monitor |  |
| _ROLL_ROT | 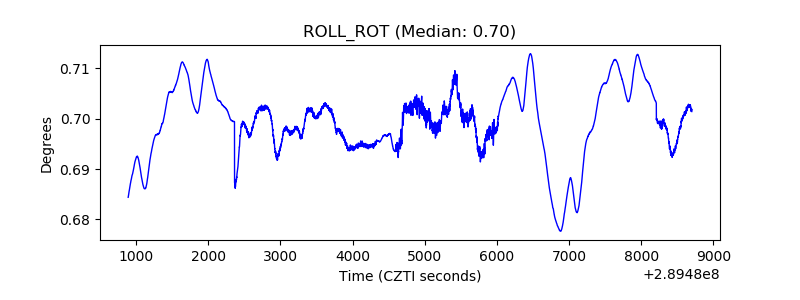 |
| _Roll_DEC | 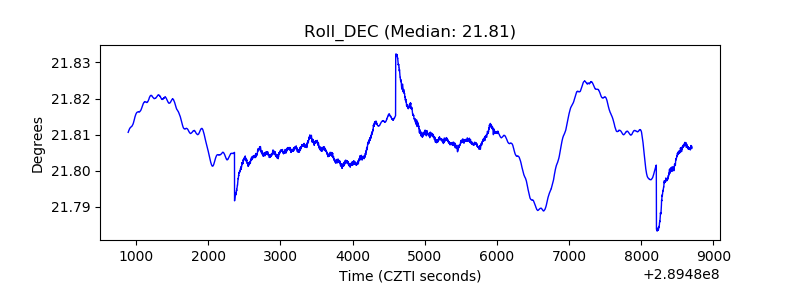 |
| _Roll_RA | 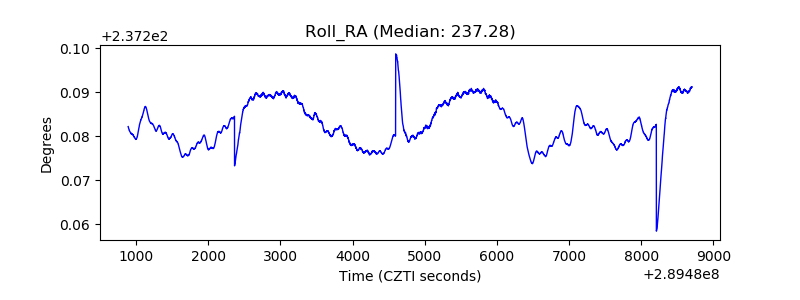 |
| Veto Counter |  |