| Param | Original file | Final file |
|---|---|---|
| Filename | modeM0/AS1A05_167T01_9000002758_18568cztM0_level2.evt | modeM0/AS1A05_167T01_9000002758_18568cztM0_level2_quad_clean.evt |
| Size (bytes) | 512,971,200 | 63,884,160 |
| Size | 489.2 MB | 60.9 MB |
| Events in quadrant A | 3,374,495 | 378,101 |
| Events in quadrant B | 3,505,381 | 385,156 |
| Events in quadrant C | 3,530,438 | 371,862 |
| Events in quadrant D | 4,686,506 | 347,785 |
| Mode SS | |||
|---|---|---|---|
| Quadrant | BADHDUFLAG | Total packets | Discarded packets |
| A | 0 | 132 | 0 |
| B | 0 | 132 | 0 |
| C | 0 | 132 | 0 |
| D | 0 | 132 | 0 |
| Mode M0 | |||
|---|---|---|---|
| Quadrant | BADHDUFLAG | Total packets | Discarded packets |
| A | 0 | 14301 | 2 |
| B | 0 | 14676 | 2 |
| C | 0 | 14626 | 2 |
| D | 0 | 18299 | 3 |
| Mode M9 | |||
|---|---|---|---|
| Quadrant | BADHDUFLAG | Total packets | Discarded packets |
| A | 0 | 11 | 0 |
| B | 0 | 12 | 0 |
| C | 0 | 12 | 0 |
| D | 0 | 12 | 0 |
| Quadrant | Total seconds | Saturated seconds | Saturation percentage |
|---|---|---|---|
| A | 6465 | 76 | 1.175561% |
| B | 6465 | 93 | 1.438515% |
| C | 6465 | 104 | 1.608662% |
| D | 6464 | 346 | 5.352723% |
Noise dominated data is calculated using 1-second bins in cleaned event files. If a bin has >2000 counts, and if more than 50% of those come from <1% of pixels, then it is considered to be noise-dominated and hence unusable.
| Quadrant | # 1 sec bins | Bins with >0 counts | Bins with >2000 counts | High rate bins dominated by noise | Noise dominated (total time) | Noise dominated (detector-on time) | Marked lightcurve |
|---|---|---|---|---|---|---|---|
| A | 7630 | 6465 | 2 | 2 | 0.03% | 0.03% | 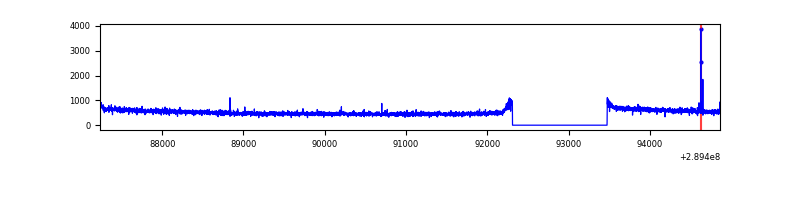 |
| B | 7630 | 6465 | 6 | 6 | 0.08% | 0.09% | 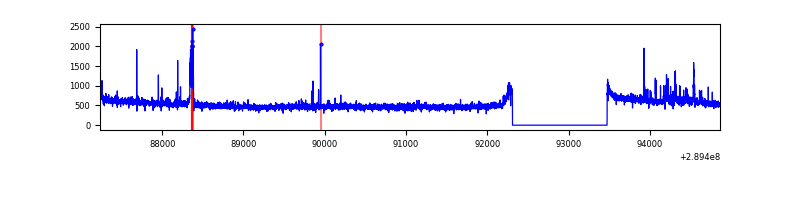 |
| C | 7630 | 6465 | 0 | 0 | 0.00% | 0.00% | 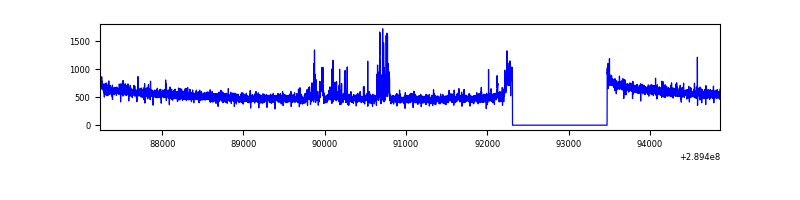 |
| D | 7629 | 6464 | 255 | 255 | 3.34% | 3.94% | 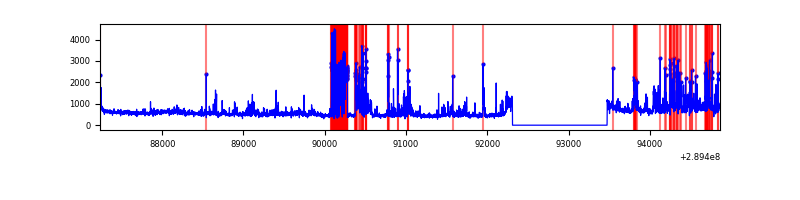 |
Top three noisy pixels from each quadrant. If the there are fewer than three noisy pixels in the level2.evt file, extra rows are filled as -1
| Pixel properties | Quadrant properties | ||||||
|---|---|---|---|---|---|---|---|
| Quadrant | DetID | PixID | Counts | Sigma | Mean | Median | Sigma |
| A | 14 | 111 | 11614 | 61.21 | 870 | 852 | 175.8 |
| A | 13 | 254 | 11385 | 59.91 | 870 | 852 | 175.8 |
| A | 6 | 16 | 9577 | 49.63 | 870 | 852 | 175.8 |
| B | 0 | 190 | 111741 | 673.34 | 865 | 844 | 164.7 |
| B | 12 | 111 | 18734 | 108.62 | 865 | 844 | 164.7 |
| B | 11 | 111 | 16717 | 96.38 | 865 | 844 | 164.7 |
| C | 14 | 238 | 131430 | 671.71 | 840 | 848 | 194.4 |
| C | 9 | 54 | 103015 | 525.55 | 840 | 848 | 194.4 |
| C | 8 | 128 | 8660 | 40.18 | 840 | 848 | 194.4 |
| D | 1 | 52 | 1054878 | 5226.24 | 835 | 815 | 201.7 |
| D | 7 | 238 | 367772 | 1819.44 | 835 | 815 | 201.7 |
| D | 7 | 38 | 47170 | 229.84 | 835 | 815 | 201.7 |
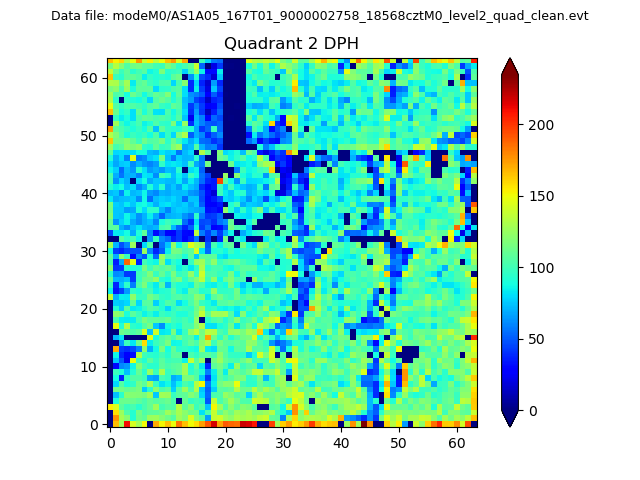
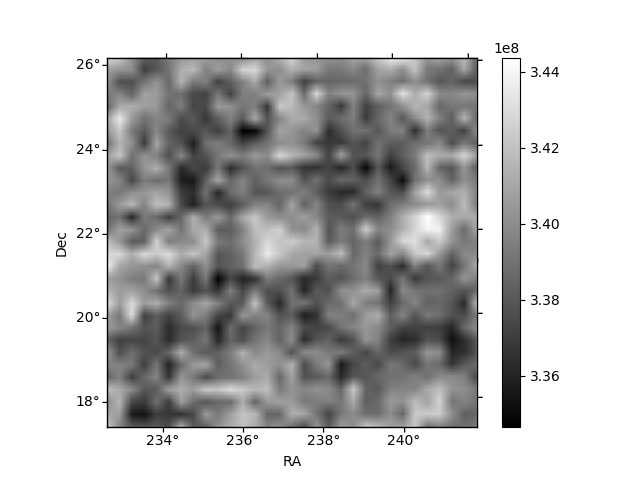
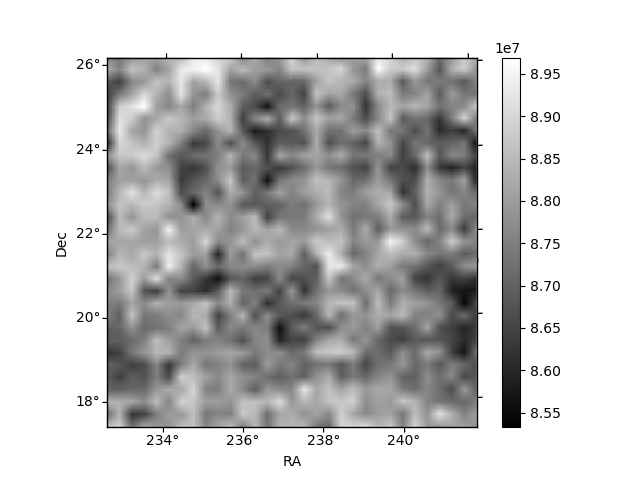
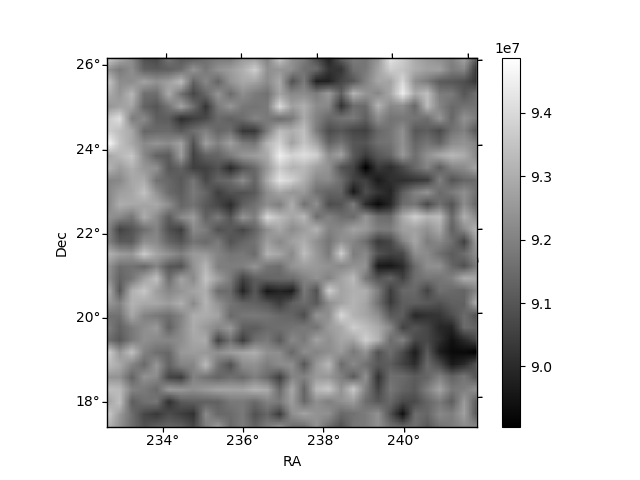
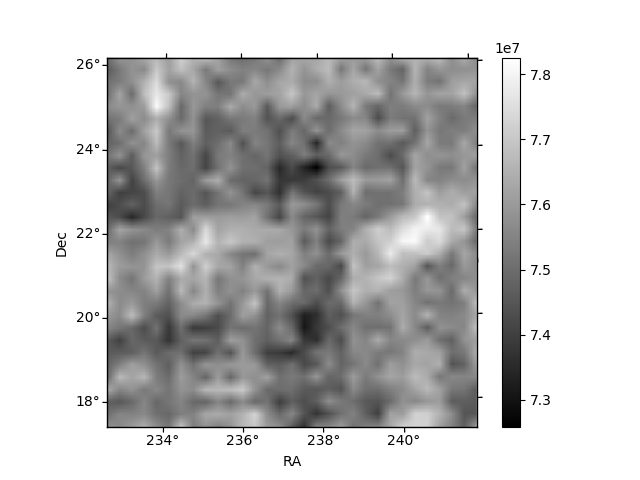
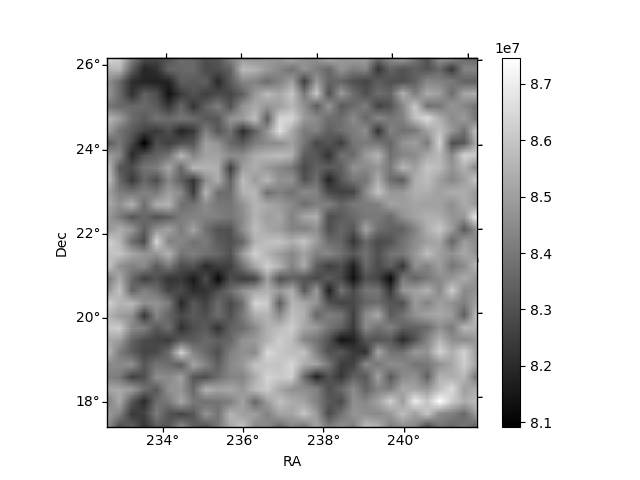
Histogram calculated using DETX and DETY for each event in the final _common_clean file
| Quadrant A | 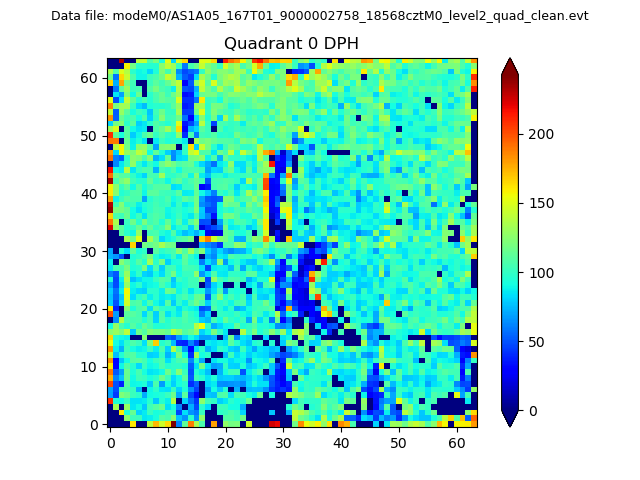 |
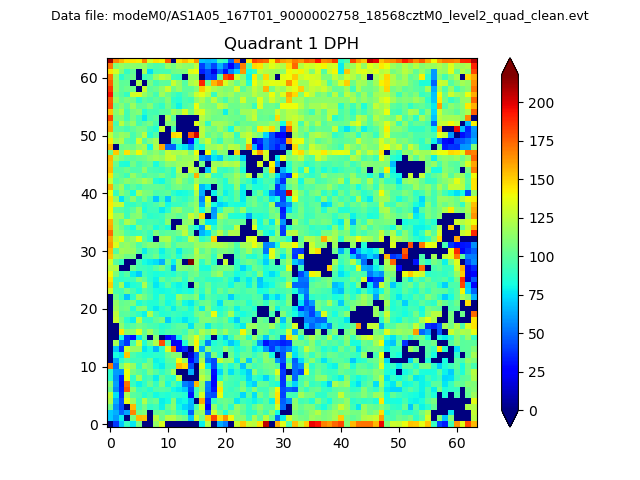 |
Quadrant B |
|---|---|---|---|
| Quadrant D | 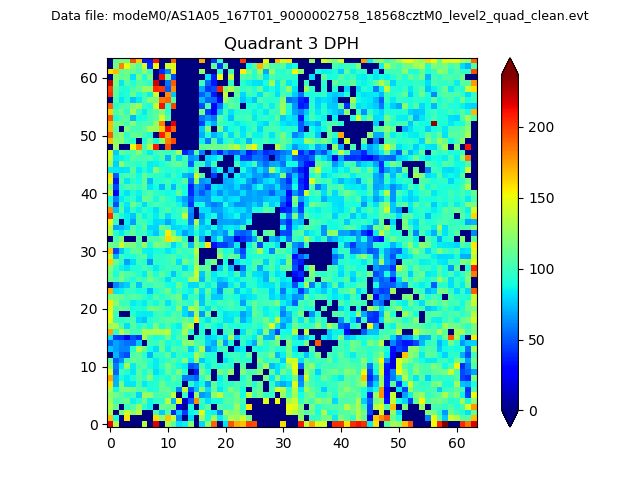 |
 |
Quadrant C |
| Plot type | Count rate plots | Images |
|---|---|---|
| Comparison with Poisson distribution Blue bars denote a histogram of data divided into 1 sec bins. Red curve is a Poisson curve with rate = median count rate of data. |
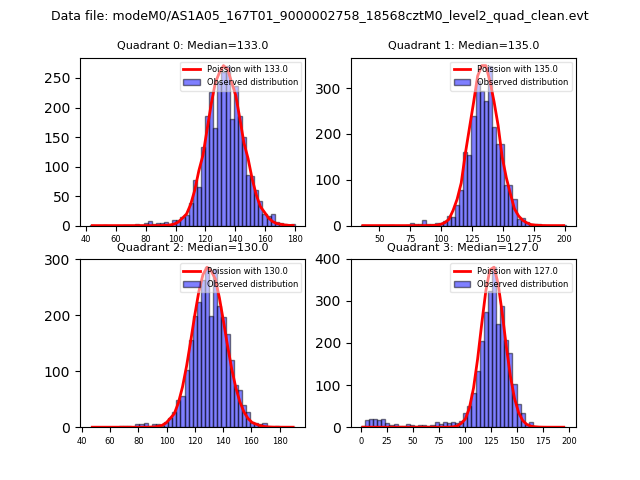 |
 |
| Quadrant-wise count rates Data is divided into 100 sec bins |
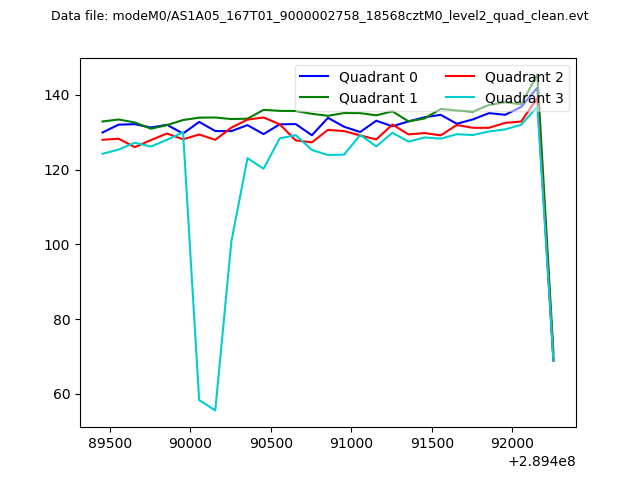 |
|
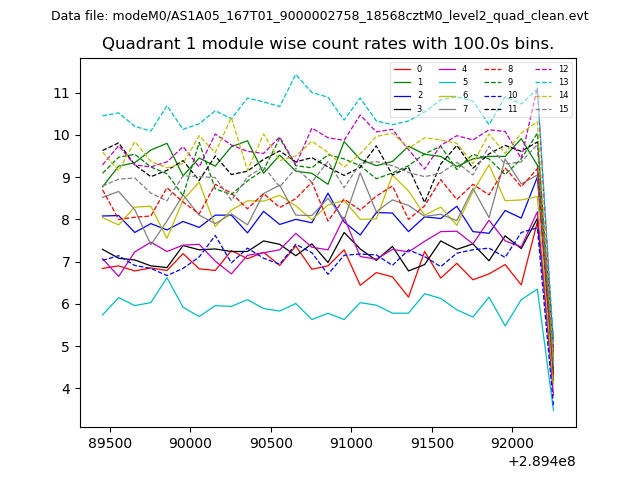
| Module-wise count rates for Quadrant A Data is divided into 100 sec bins |
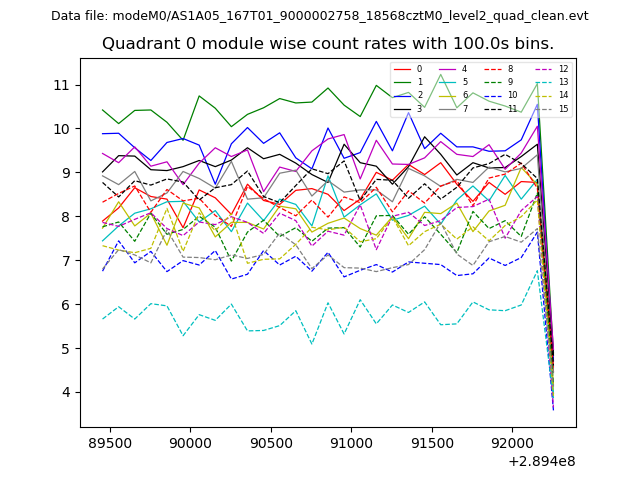 |
 |
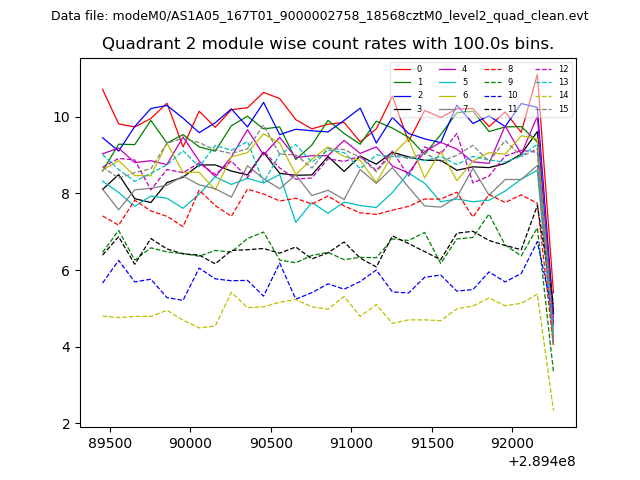
| Module-wise count rates for Quadrant B Data is divided into 100 sec bins |
 |
 |
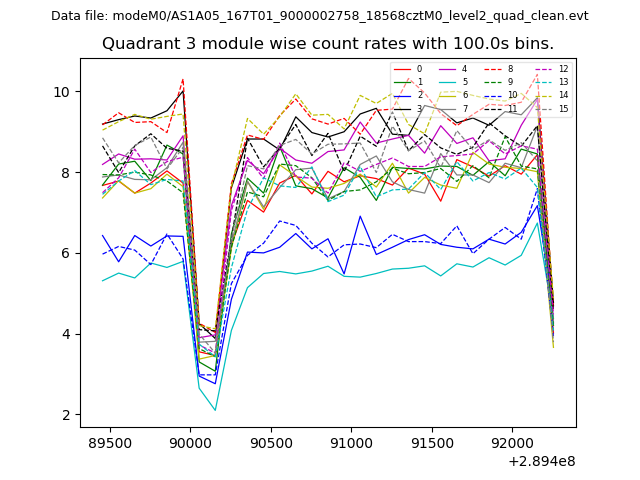
| Module-wise count rates for Quadrant C Data is divided into 100 sec bins |
 |
 |
| Module-wise count rates for Quadrant D Data is divided into 100 sec bins |
 |
 |
| Parameter | Plot |
|---|---|
| CZT HV Monitor | 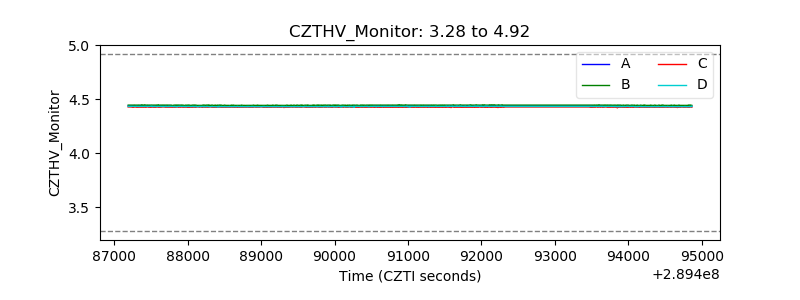 |
| D_VDD | 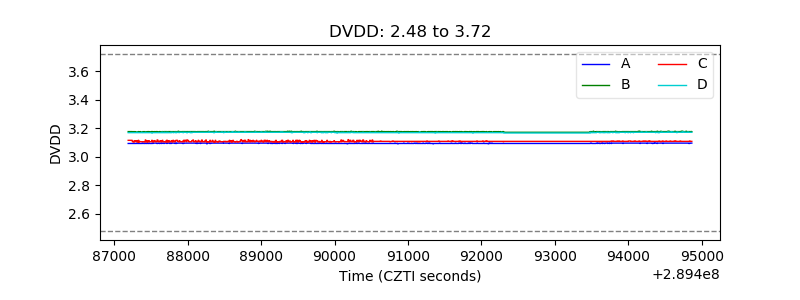 |
| Temperature 1 | 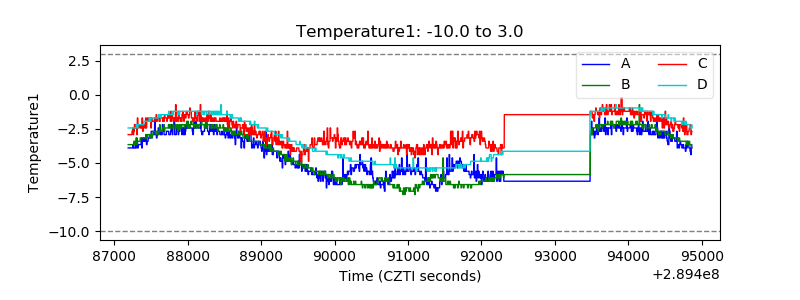 |
| Veto HV Monitor | 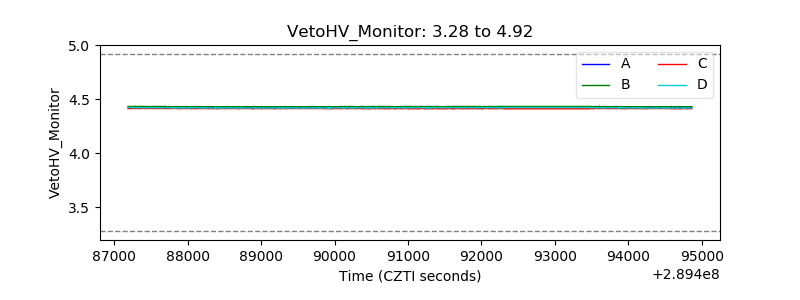 |
| Veto LLD | 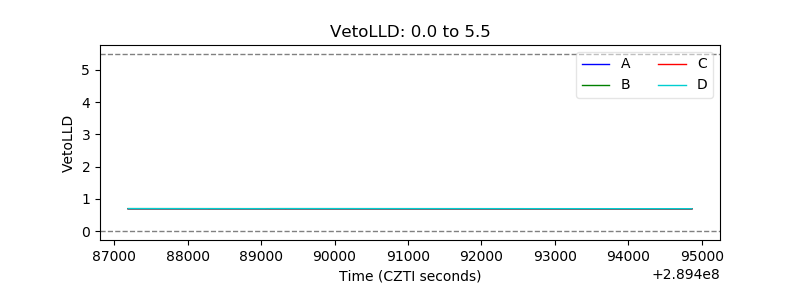 |
| Alpha Counter | 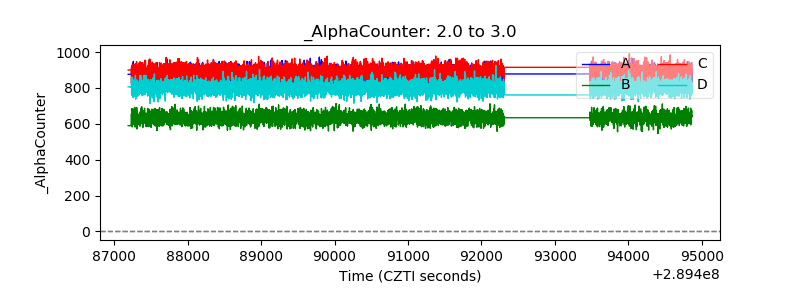 |
| _CPM_Rate | 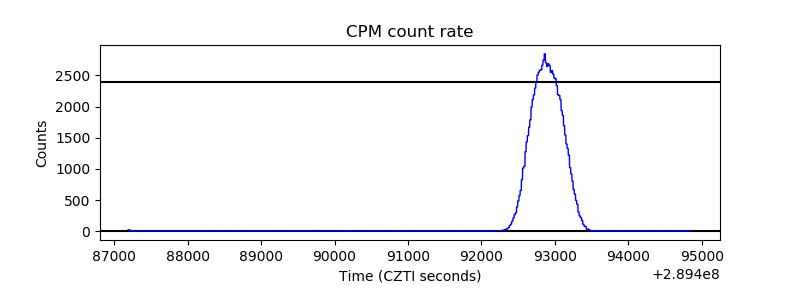 |
| CZT Counter | 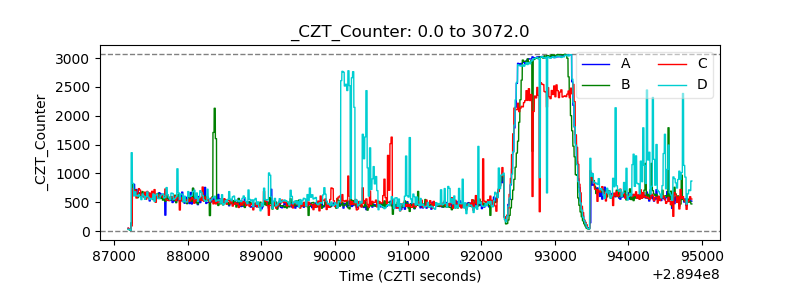 |
| +2.5 Volts monitor |  |
| +5 Volts monitor |  |
| _ROLL_ROT | 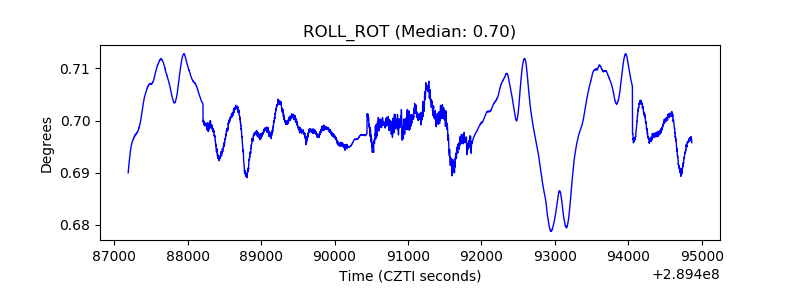 |
| _Roll_DEC | 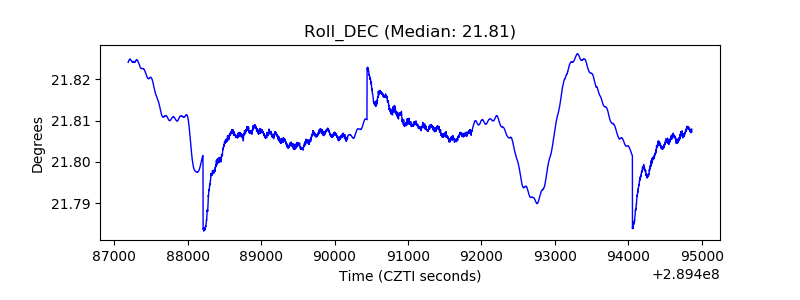 |
| _Roll_RA | 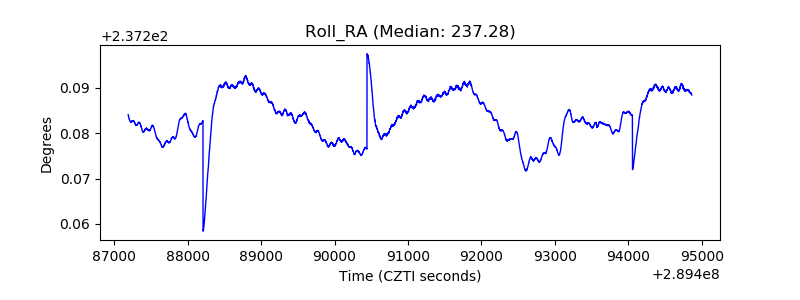 |
| Veto Counter |  |