| Param | Original file | Final file |
|---|---|---|
| Filename | modeM0/AS1A05_167T01_9000002758_18569cztM0_level2.evt | modeM0/AS1A05_167T01_9000002758_18569cztM0_level2_quad_clean.evt |
| Size (bytes) | 560,966,400 | 69,747,840 |
| Size | 535.0 MB | 66.5 MB |
| Events in quadrant A | 3,311,252 | 433,567 |
| Events in quadrant B | 3,268,259 | 449,739 |
| Events in quadrant C | 3,264,493 | 438,610 |
| Events in quadrant D | 6,749,293 | 381,360 |
| Mode SS | |||
|---|---|---|---|
| Quadrant | BADHDUFLAG | Total packets | Discarded packets |
| A | 0 | 120 | 0 |
| B | 0 | 120 | 0 |
| C | 0 | 120 | 0 |
| D | 0 | 120 | 0 |
| Mode M0 | |||
|---|---|---|---|
| Quadrant | BADHDUFLAG | Total packets | Discarded packets |
| A | 0 | 13638 | 1 |
| B | 0 | 13538 | 1 |
| C | 0 | 13473 | 1 |
| D | 0 | 24193 | 1 |
| Mode M9 | |||
|---|---|---|---|
| Quadrant | BADHDUFLAG | Total packets | Discarded packets |
| A | 0 | 13 | 0 |
| B | 0 | 13 | 0 |
| C | 0 | 13 | 0 |
| D | 0 | 13 | 0 |
| Quadrant | Total seconds | Saturated seconds | Saturation percentage |
|---|---|---|---|
| A | 5838 | 138 | 2.363823% |
| B | 5838 | 86 | 1.473107% |
| C | 5839 | 96 | 1.644117% |
| D | 5839 | 1059 | 18.136667% |
Noise dominated data is calculated using 1-second bins in cleaned event files. If a bin has >2000 counts, and if more than 50% of those come from <1% of pixels, then it is considered to be noise-dominated and hence unusable.
| Quadrant | # 1 sec bins | Bins with >0 counts | Bins with >2000 counts | High rate bins dominated by noise | Noise dominated (total time) | Noise dominated (detector-on time) | Marked lightcurve |
|---|---|---|---|---|---|---|---|
| A | 7148 | 5838 | 46 | 46 | 0.64% | 0.79% | 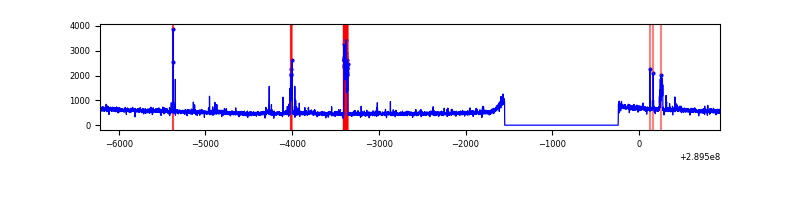 |
| B | 7148 | 5838 | 17 | 17 | 0.24% | 0.29% | 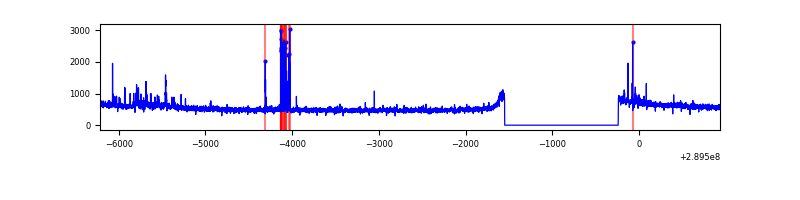 |
| C | 7149 | 5839 | 2 | 2 | 0.03% | 0.03% | 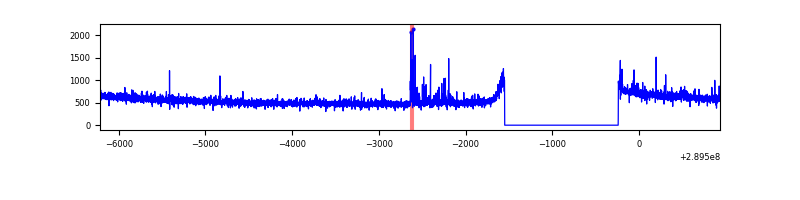 |
| D | 7149 | 5839 | 951 | 951 | 13.30% | 16.29% | 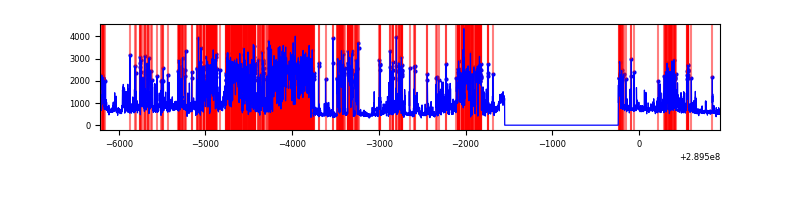 |
Top three noisy pixels from each quadrant. If the there are fewer than three noisy pixels in the level2.evt file, extra rows are filled as -1
| Pixel properties | Quadrant properties | ||||||
|---|---|---|---|---|---|---|---|
| Quadrant | DetID | PixID | Counts | Sigma | Mean | Median | Sigma |
| A | 14 | 111 | 192755 | 1197.29 | 797 | 783 | 160.3 |
| A | 5 | 98 | 35581 | 217.03 | 797 | 783 | 160.3 |
| A | 13 | 254 | 10377 | 59.84 | 797 | 783 | 160.3 |
| B | 0 | 190 | 82294 | 549.2 | 798 | 779 | 148.4 |
| B | 0 | 244 | 63844 | 424.9 | 798 | 779 | 148.4 |
| B | 12 | 111 | 16936 | 108.85 | 798 | 779 | 148.4 |
| C | 14 | 238 | 124540 | 683.41 | 781 | 791 | 181.1 |
| C | 4 | 254 | 83012 | 454.07 | 781 | 791 | 181.1 |
| C | 9 | 54 | 8581 | 43.02 | 781 | 791 | 181.1 |
| D | 7 | 238 | 2233188 | 12490.71 | 748 | 731 | 178.7 |
| D | 1 | 52 | 1565291 | 8753.79 | 748 | 731 | 178.7 |
| D | 14 | 34 | 59375 | 328.12 | 748 | 731 | 178.7 |
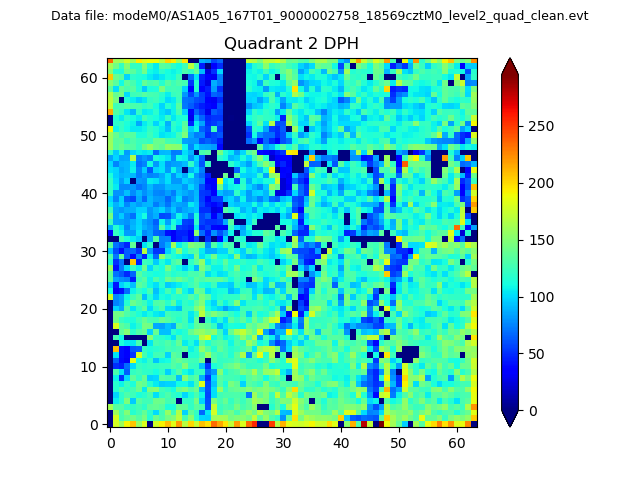
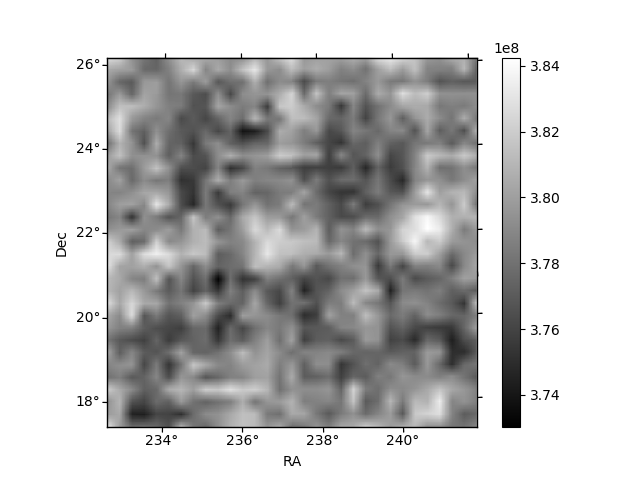
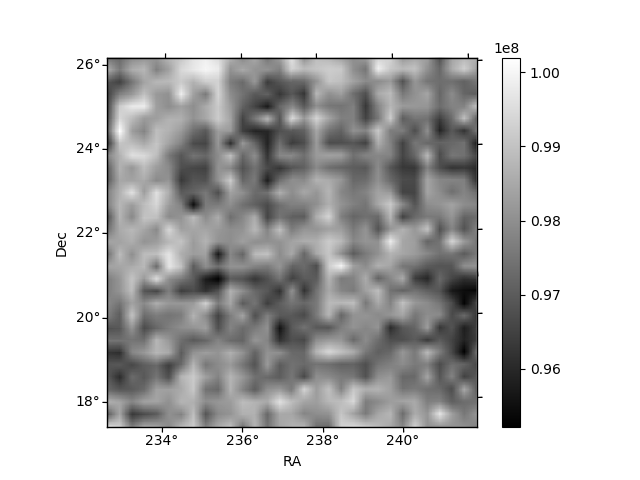
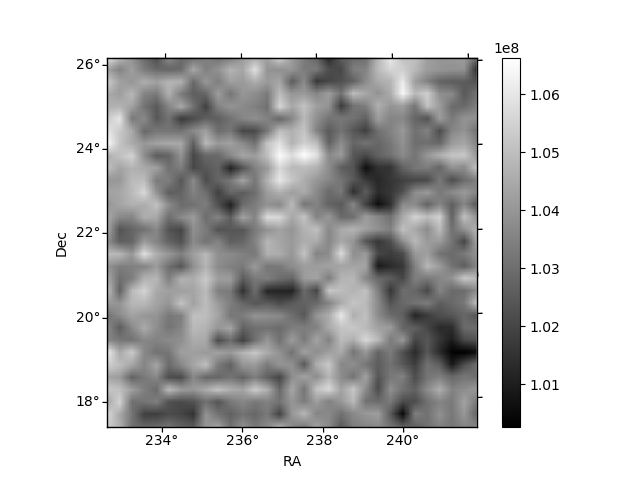
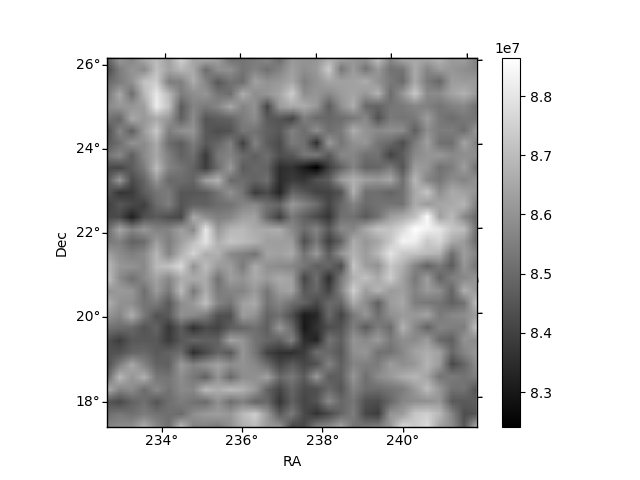
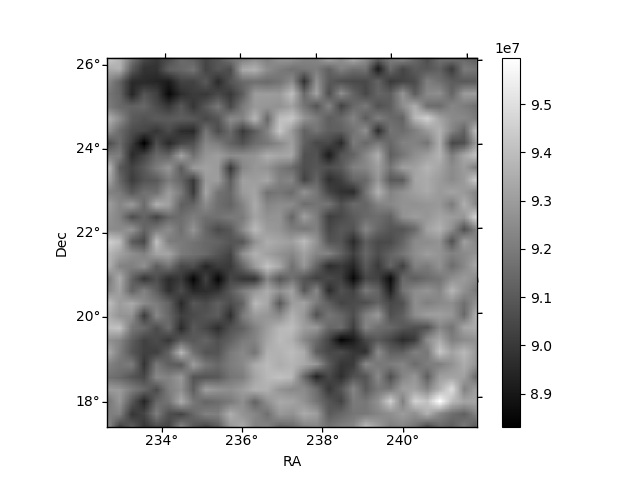
Histogram calculated using DETX and DETY for each event in the final _common_clean file
| Quadrant A | 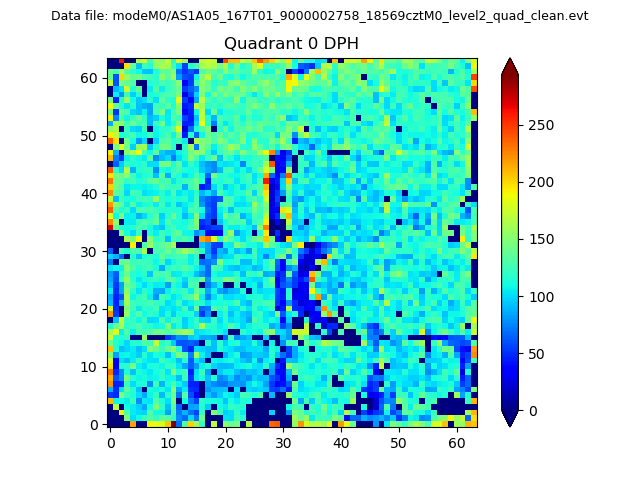 |
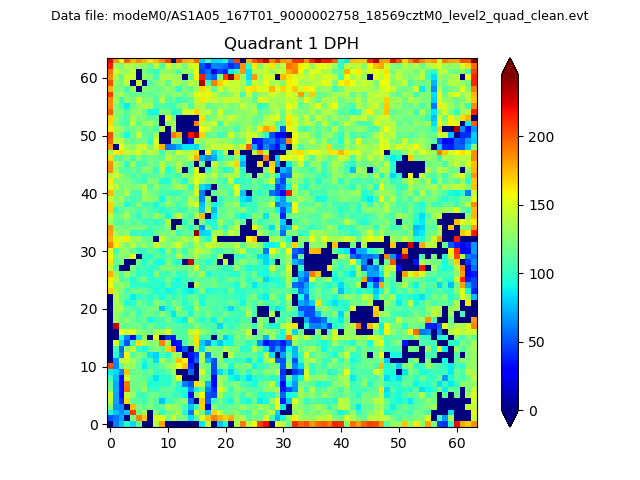 |
Quadrant B |
|---|---|---|---|
| Quadrant D | 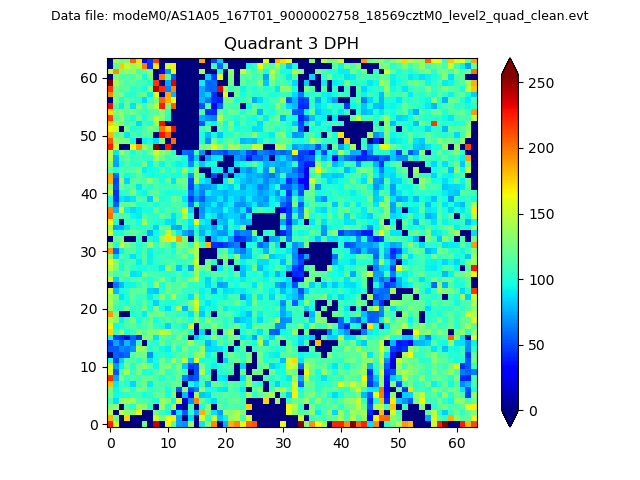 |
 |
Quadrant C |
| Plot type | Count rate plots | Images |
|---|---|---|
| Comparison with Poisson distribution Blue bars denote a histogram of data divided into 1 sec bins. Red curve is a Poisson curve with rate = median count rate of data. |
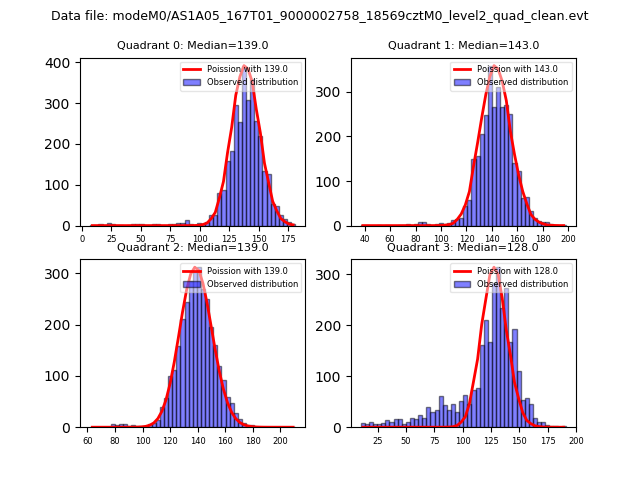 |
 |
| Quadrant-wise count rates Data is divided into 100 sec bins |
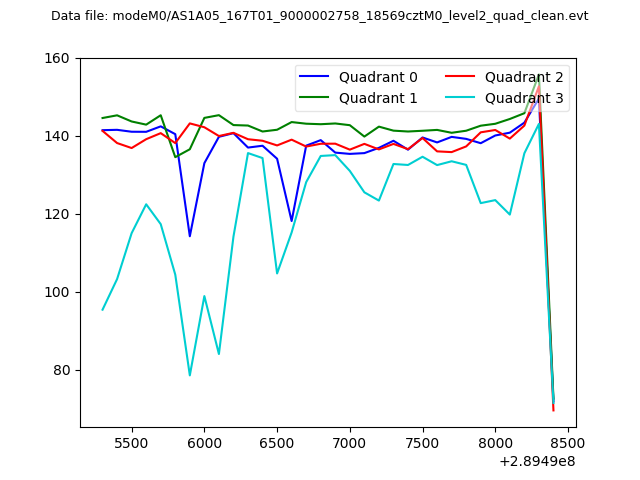 |
|
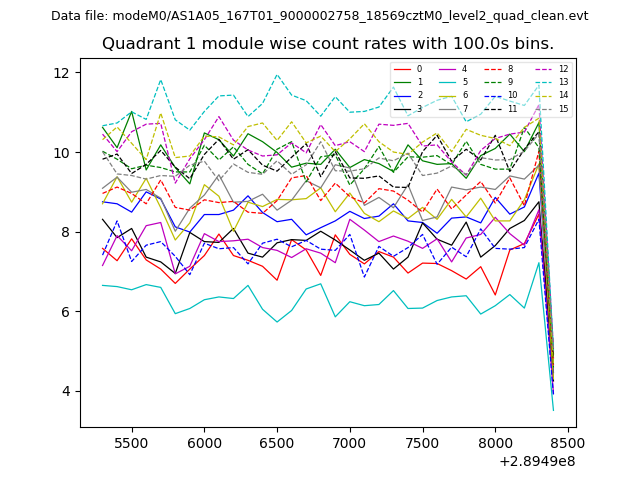
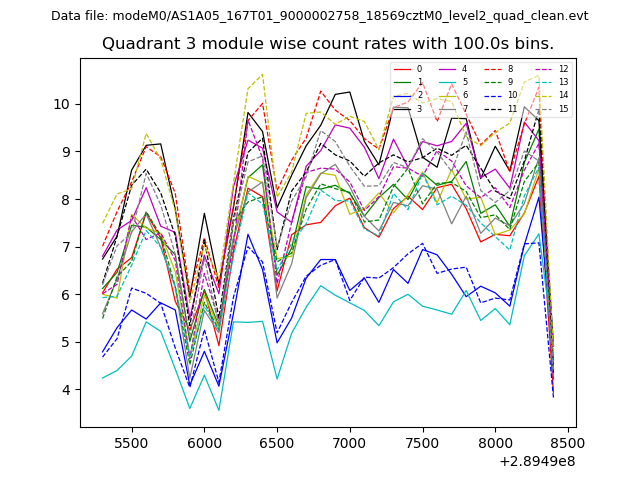
| Module-wise count rates for Quadrant A Data is divided into 100 sec bins |
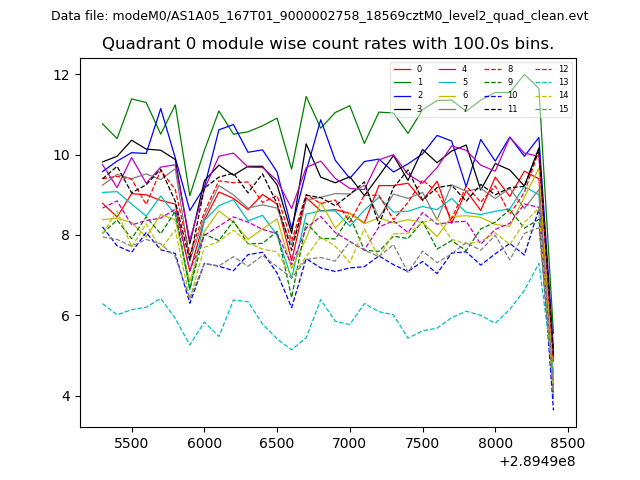 |
 |
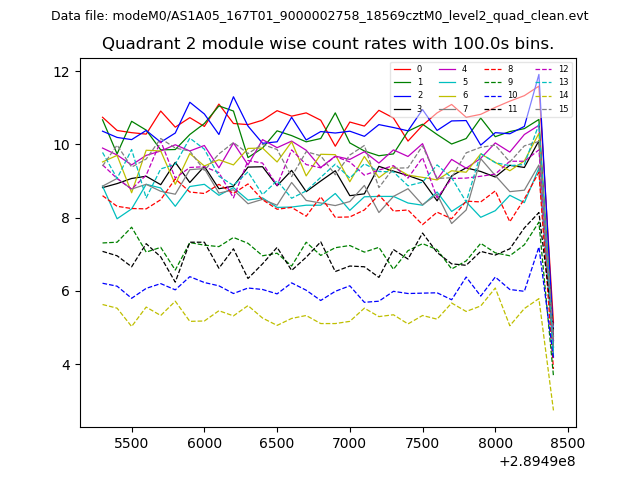
| Module-wise count rates for Quadrant B Data is divided into 100 sec bins |
 |
 |
| Module-wise count rates for Quadrant C Data is divided into 100 sec bins |
 |
 |
| Module-wise count rates for Quadrant D Data is divided into 100 sec bins |
 |
 |
| Parameter | Plot |
|---|---|
| CZT HV Monitor | 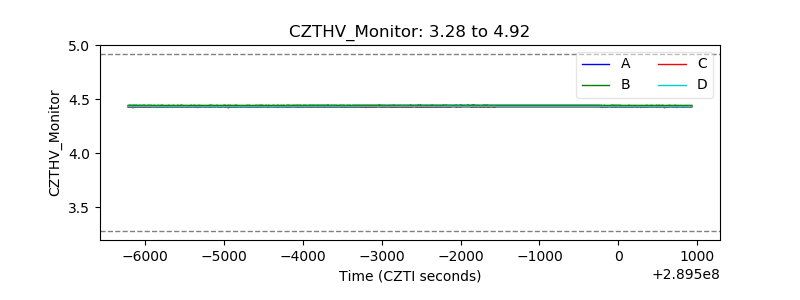 |
| D_VDD | 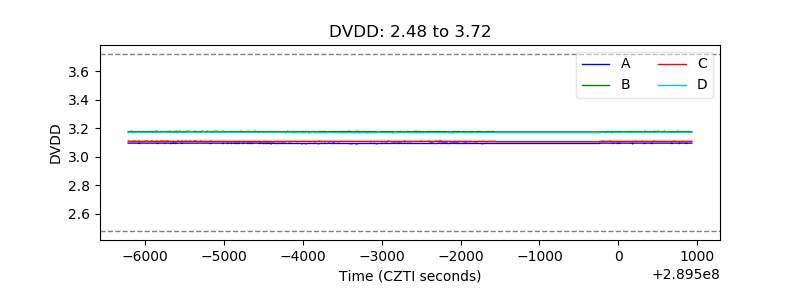 |
| Temperature 1 | 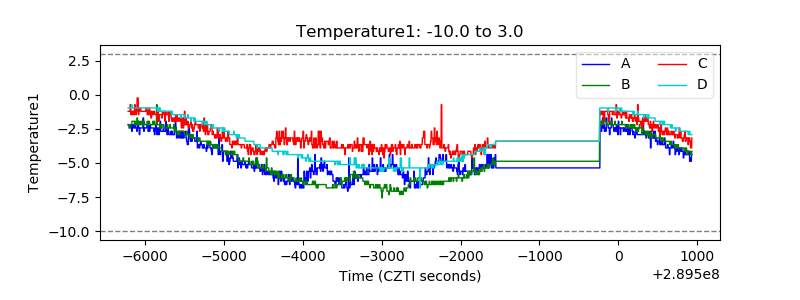 |
| Veto HV Monitor | 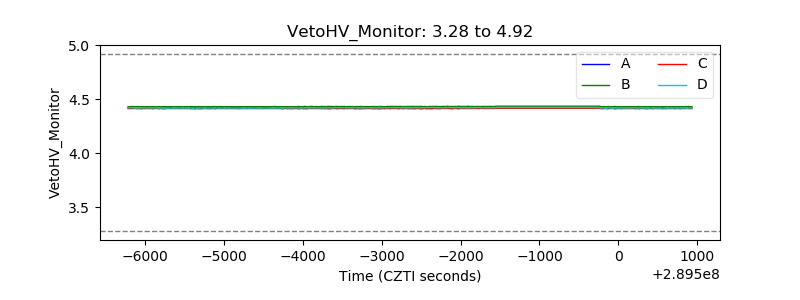 |
| Veto LLD | 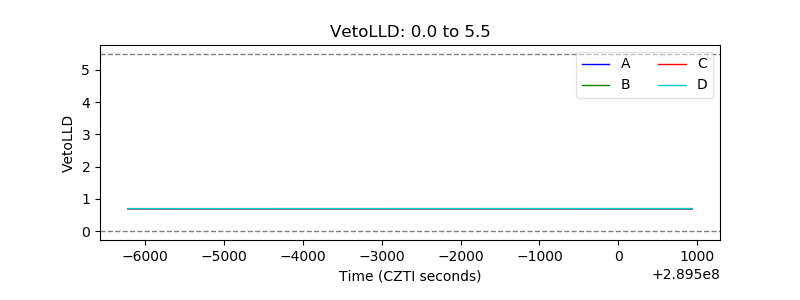 |
| Alpha Counter | 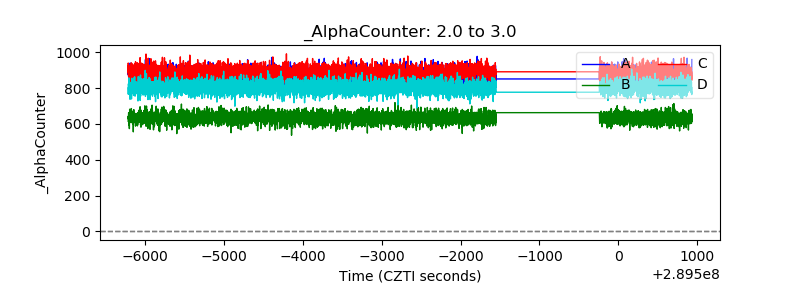 |
| _CPM_Rate | 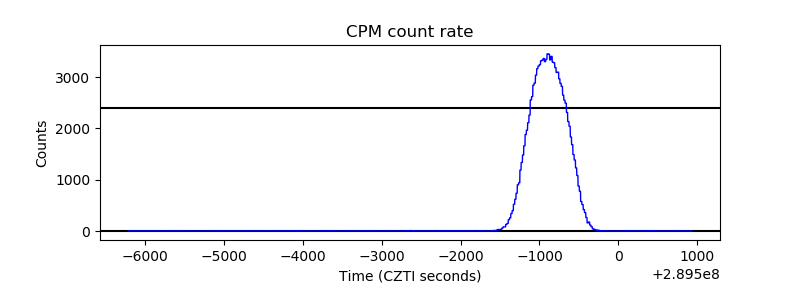 |
| CZT Counter | 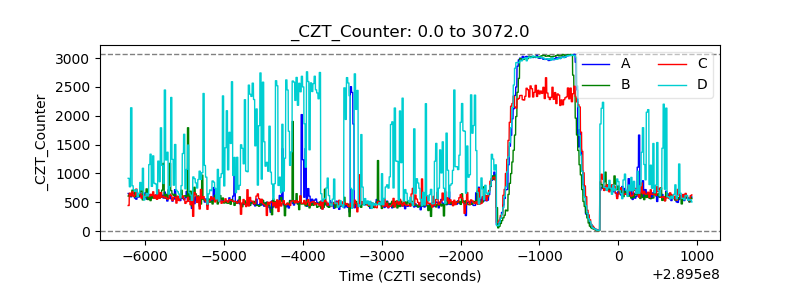 |
| +2.5 Volts monitor | 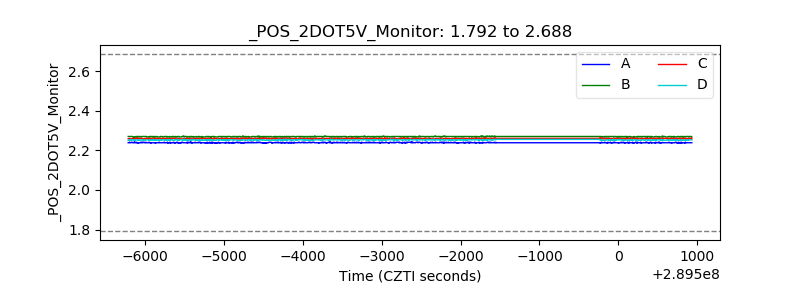 |
| +5 Volts monitor |  |
| _ROLL_ROT | 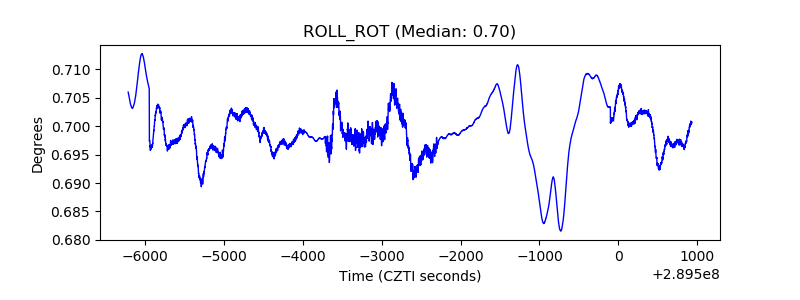 |
| _Roll_DEC | 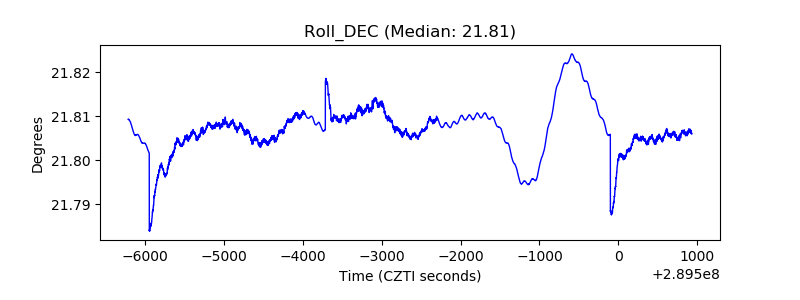 |
| _Roll_RA | 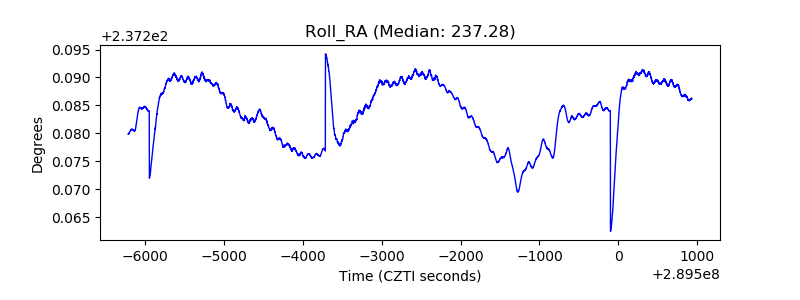 |
| Veto Counter |  |