| Param | Original file | Final file |
|---|---|---|
| Filename | modeM0/AS1A05_167T01_9000002758_18570cztM0_level2.evt | modeM0/AS1A05_167T01_9000002758_18570cztM0_level2_quad_clean.evt |
| Size (bytes) | 540,385,920 | 89,003,520 |
| Size | 515.4 MB | 84.9 MB |
| Events in quadrant A | 3,486,734 | 565,166 |
| Events in quadrant B | 3,531,123 | 582,170 |
| Events in quadrant C | 3,738,305 | 565,291 |
| Events in quadrant D | 5,184,677 | 545,373 |
| Mode SS | |||
|---|---|---|---|
| Quadrant | BADHDUFLAG | Total packets | Discarded packets |
| A | 0 | 132 | 0 |
| B | 0 | 132 | 0 |
| C | 0 | 132 | 0 |
| D | 0 | 132 | 0 |
| Mode M0 | |||
|---|---|---|---|
| Quadrant | BADHDUFLAG | Total packets | Discarded packets |
| A | 0 | 14422 | 2 |
| B | 0 | 14512 | 3 |
| C | 0 | 15248 | 2 |
| D | 0 | 19576 | 2 |
| Mode M9 | |||
|---|---|---|---|
| Quadrant | BADHDUFLAG | Total packets | Discarded packets |
| A | 0 | 26 | 0 |
| B | 0 | 26 | 0 |
| C | 0 | 26 | 0 |
| D | 0 | 26 | 0 |
| Quadrant | Total seconds | Saturated seconds | Saturation percentage |
|---|---|---|---|
| A | 6255 | 117 | 1.870504% |
| B | 6255 | 129 | 2.062350% |
| C | 6255 | 198 | 3.165468% |
| D | 6255 | 663 | 10.599520% |
Noise dominated data is calculated using 1-second bins in cleaned event files. If a bin has >2000 counts, and if more than 50% of those come from <1% of pixels, then it is considered to be noise-dominated and hence unusable.
| Quadrant | # 1 sec bins | Bins with >0 counts | Bins with >2000 counts | High rate bins dominated by noise | Noise dominated (total time) | Noise dominated (detector-on time) | Marked lightcurve |
|---|---|---|---|---|---|---|---|
| A | 8930 | 6256 | 3 | 3 | 0.03% | 0.05% | 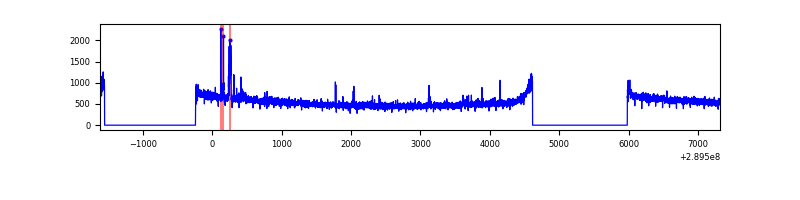 |
| B | 8930 | 6256 | 3 | 3 | 0.03% | 0.05% | 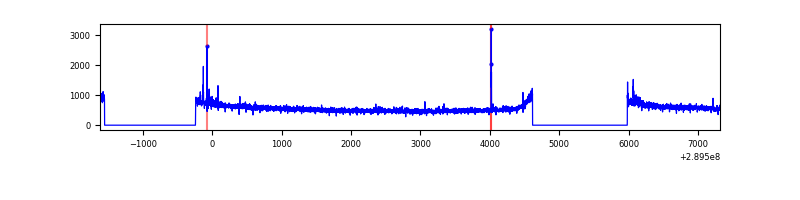 |
| C | 8930 | 6256 | 19 | 19 | 0.21% | 0.30% | 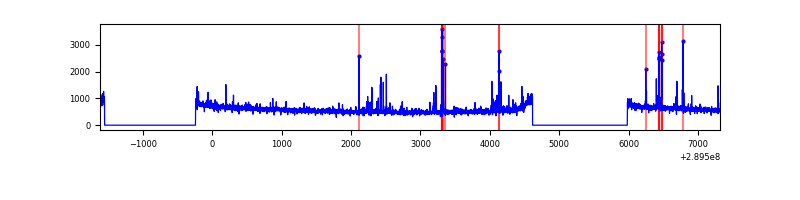 |
| D | 8930 | 6256 | 445 | 445 | 4.98% | 7.11% | 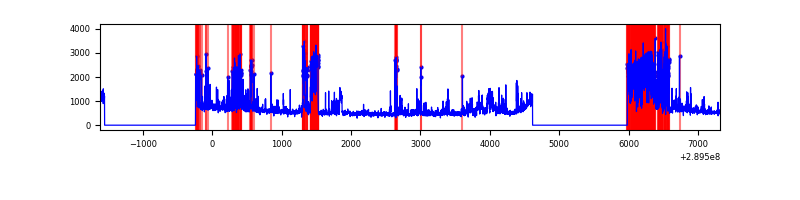 |
Top three noisy pixels from each quadrant. If the there are fewer than three noisy pixels in the level2.evt file, extra rows are filled as -1
| Pixel properties | Quadrant properties | ||||||
|---|---|---|---|---|---|---|---|
| Quadrant | DetID | PixID | Counts | Sigma | Mean | Median | Sigma |
| A | 5 | 98 | 36381 | 200.52 | 887 | 870 | 177.1 |
| A | 14 | 111 | 23888 | 129.98 | 887 | 870 | 177.1 |
| A | 13 | 254 | 11556 | 60.34 | 887 | 870 | 177.1 |
| B | 0 | 190 | 21174 | 121.15 | 892 | 872 | 167.6 |
| B | 4 | 216 | 20216 | 115.43 | 892 | 872 | 167.6 |
| B | 12 | 111 | 18897 | 107.56 | 892 | 872 | 167.6 |
| C | 4 | 254 | 171620 | 852.28 | 871 | 884 | 200.3 |
| C | 14 | 238 | 136866 | 678.79 | 871 | 884 | 200.3 |
| C | 9 | 54 | 35228 | 171.44 | 871 | 884 | 200.3 |
| D | 7 | 238 | 1567042 | 7687.13 | 850 | 830 | 203.7 |
| D | 1 | 52 | 351422 | 1720.74 | 850 | 830 | 203.7 |
| D | 14 | 34 | 41012 | 197.22 | 850 | 830 | 203.7 |
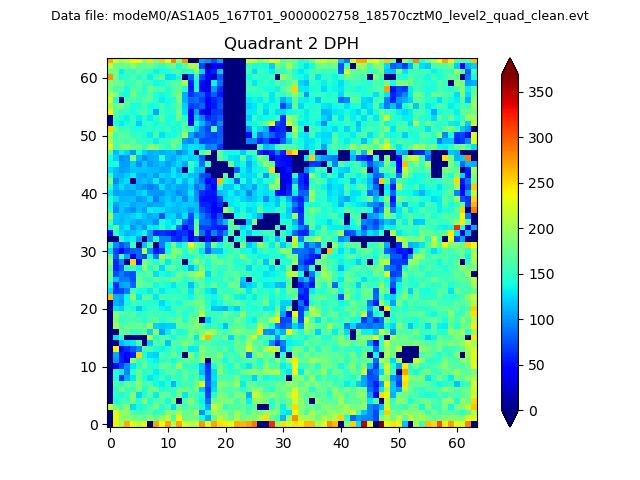
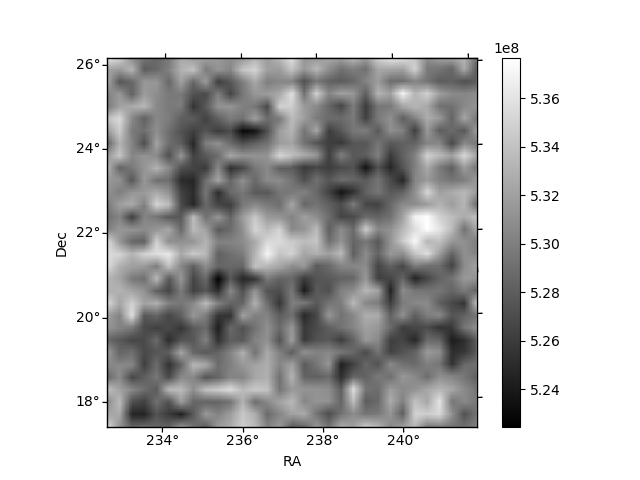
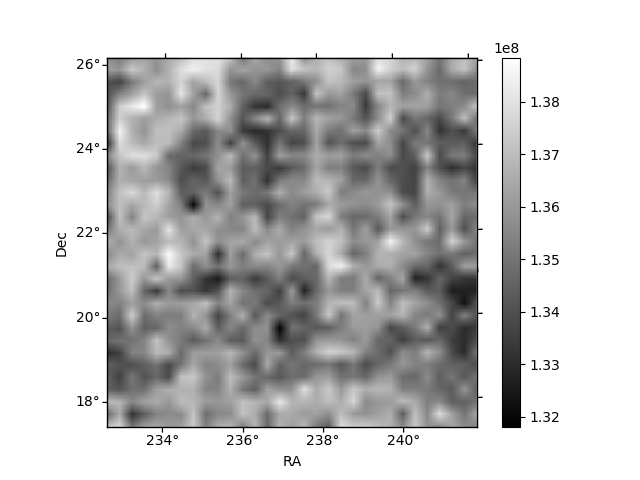
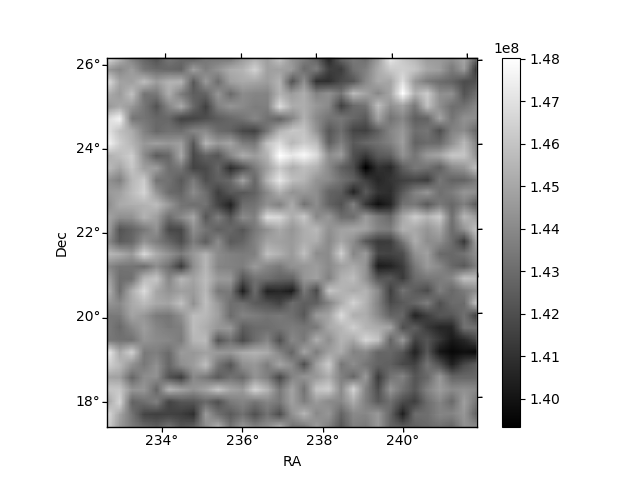
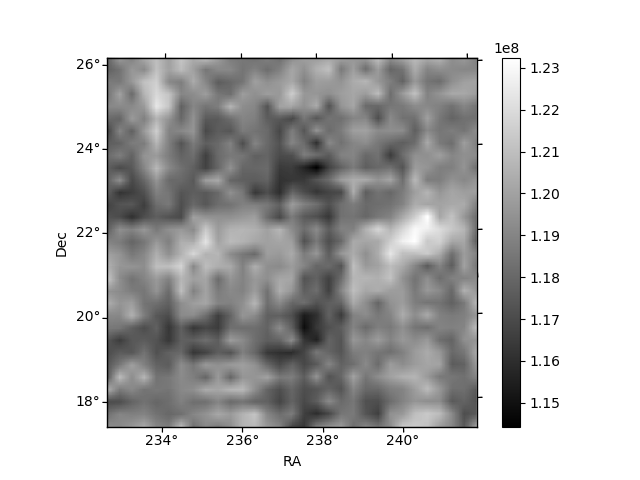
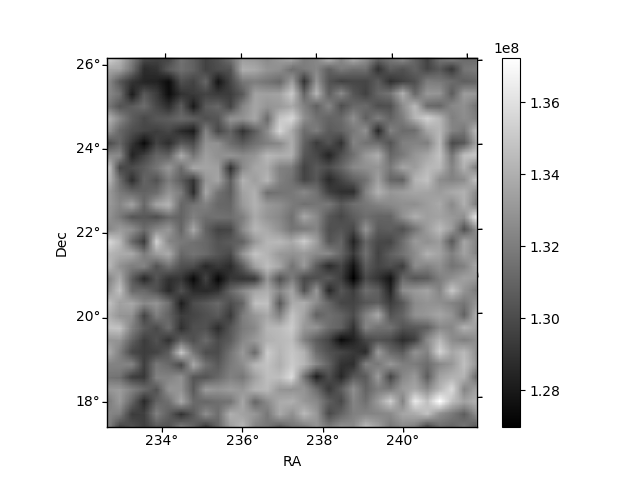
Histogram calculated using DETX and DETY for each event in the final _common_clean file
| Quadrant A | 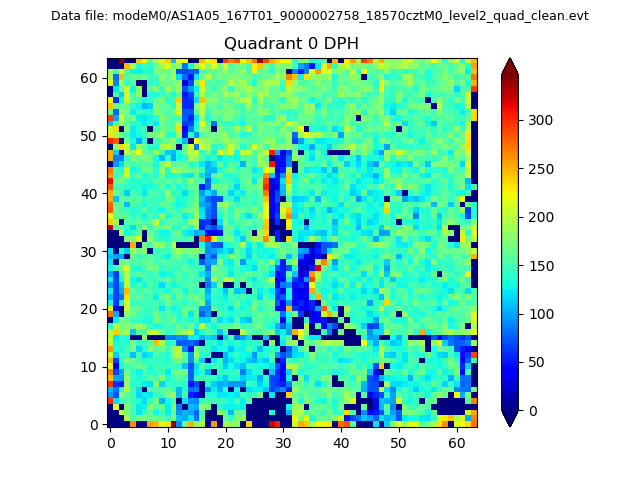 |
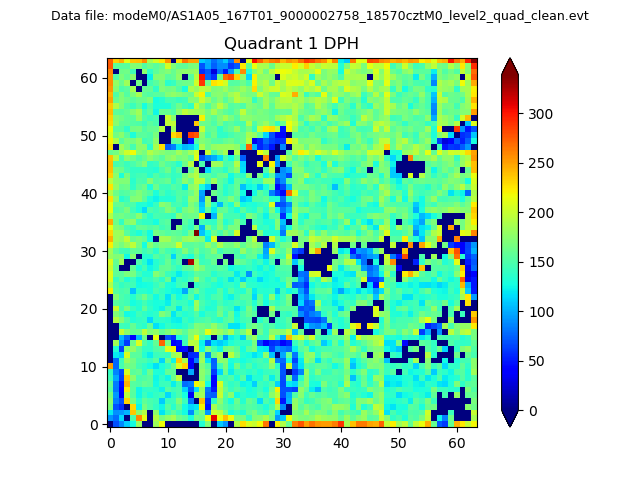 |
Quadrant B |
|---|---|---|---|
| Quadrant D | 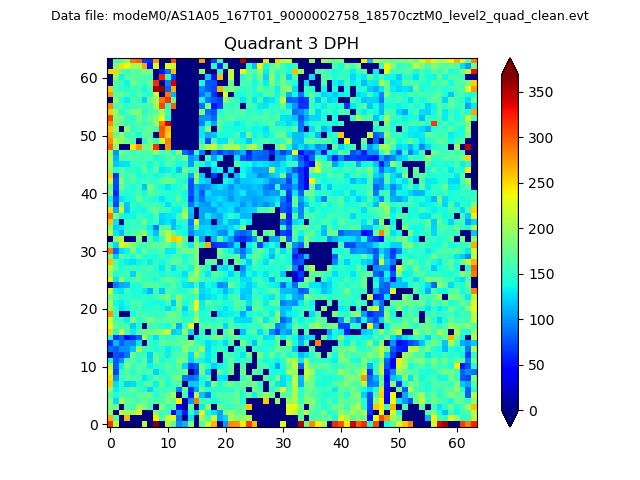 |
 |
Quadrant C |
| Plot type | Count rate plots | Images |
|---|---|---|
| Comparison with Poisson distribution Blue bars denote a histogram of data divided into 1 sec bins. Red curve is a Poisson curve with rate = median count rate of data. |
 |
 |
| Quadrant-wise count rates Data is divided into 100 sec bins |
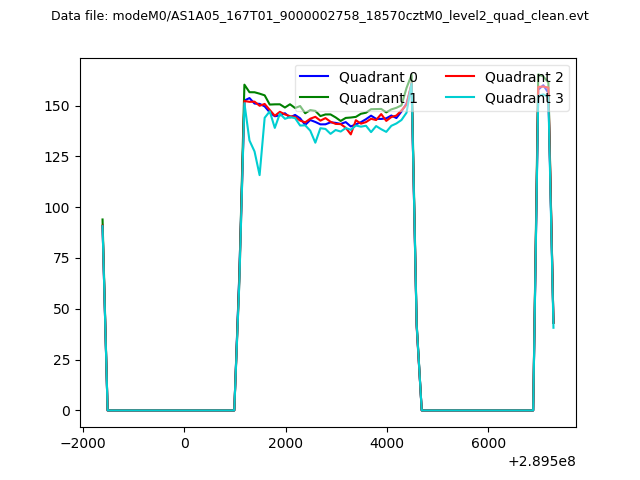 |
|
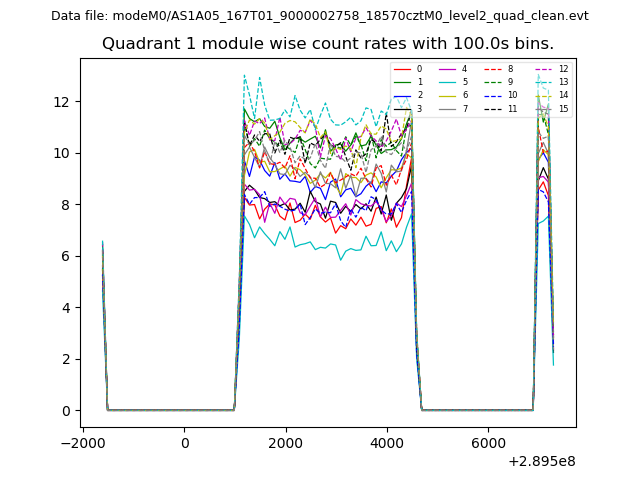
| Module-wise count rates for Quadrant A Data is divided into 100 sec bins |
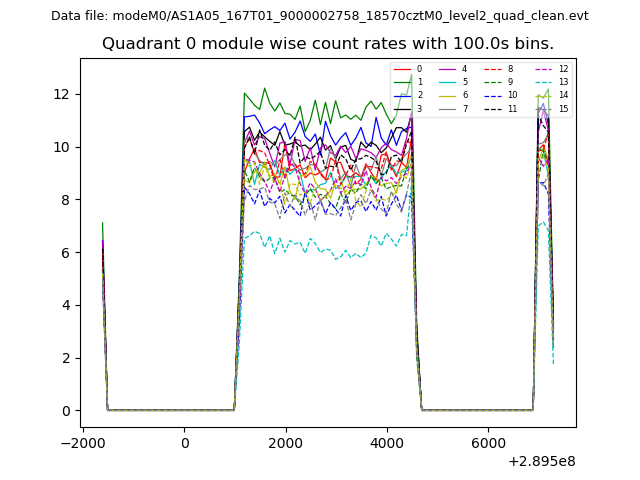 |
 |
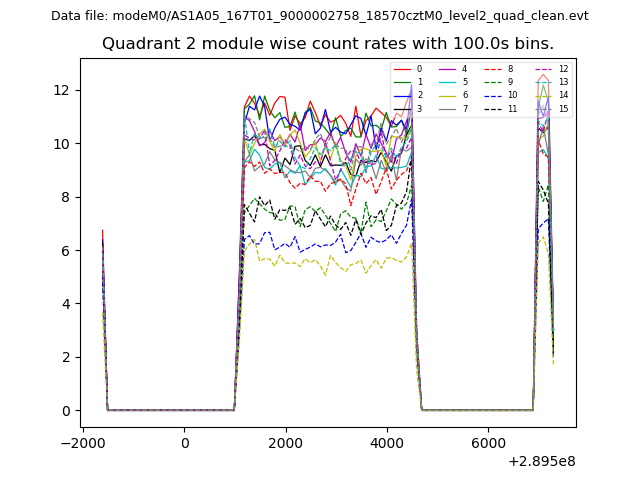
| Module-wise count rates for Quadrant B Data is divided into 100 sec bins |
 |
 |
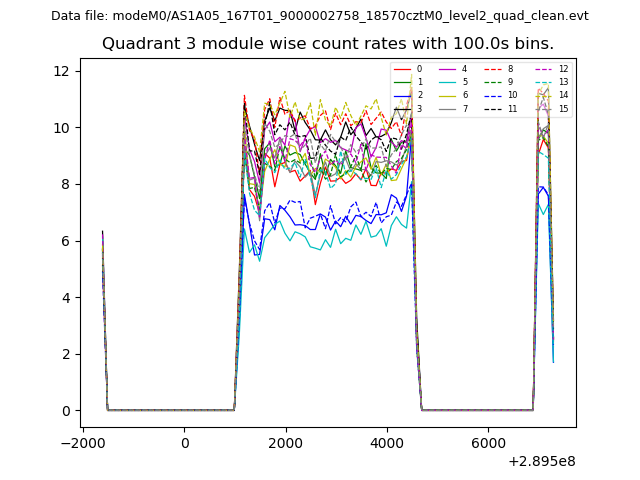
| Module-wise count rates for Quadrant C Data is divided into 100 sec bins |
 |
 |
| Module-wise count rates for Quadrant D Data is divided into 100 sec bins |
 |
 |
| Parameter | Plot |
|---|---|
| CZT HV Monitor | 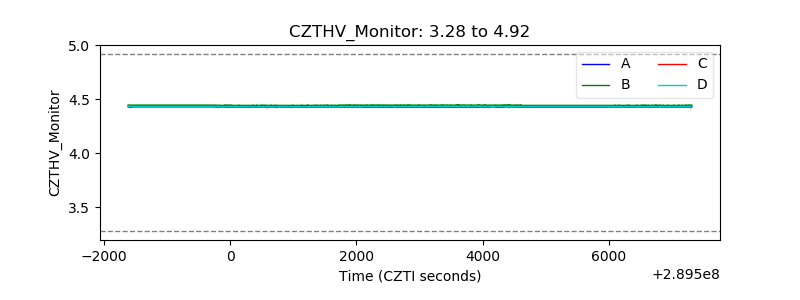 |
| D_VDD | 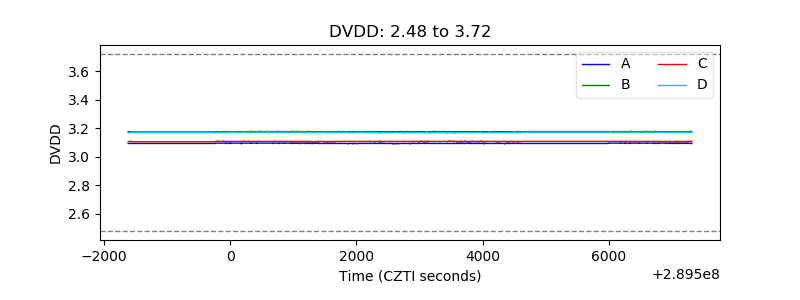 |
| Temperature 1 | 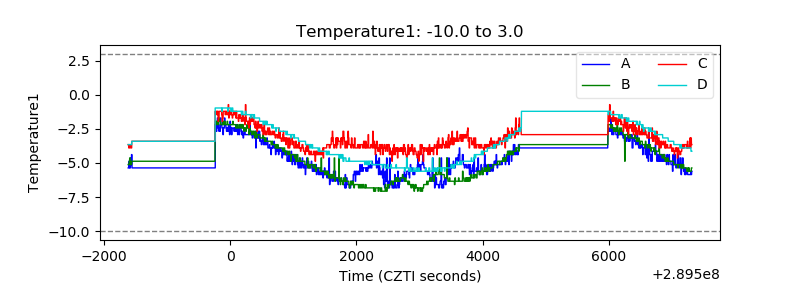 |
| Veto HV Monitor | 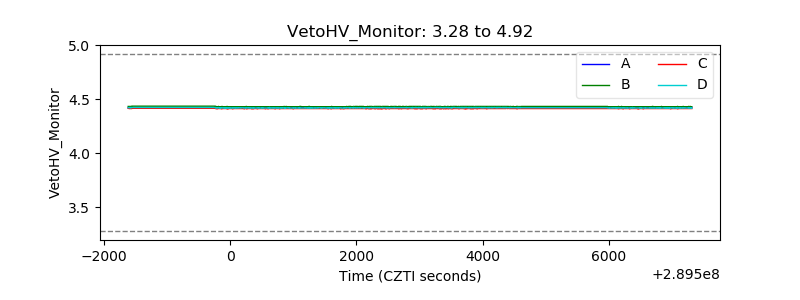 |
| Veto LLD | 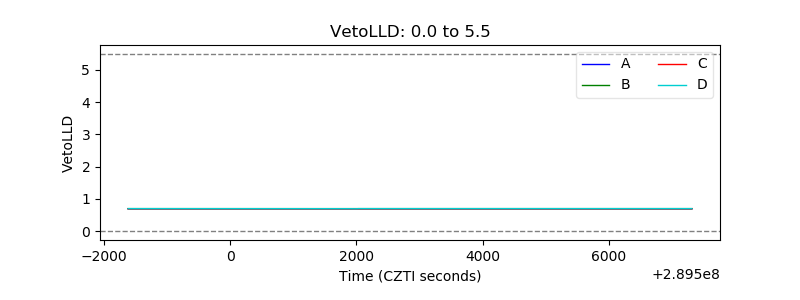 |
| Alpha Counter | 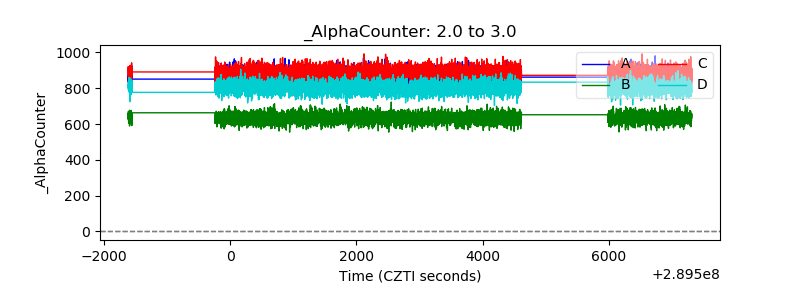 |
| _CPM_Rate | 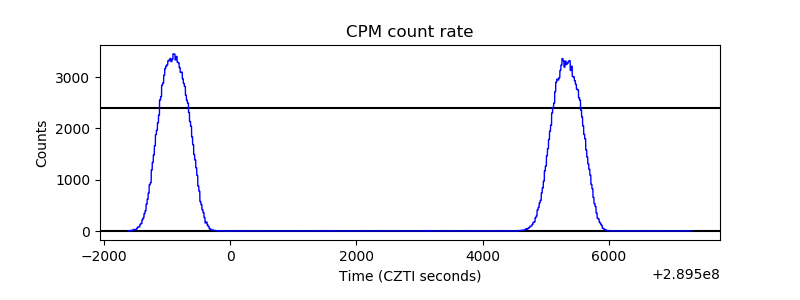 |
| CZT Counter | 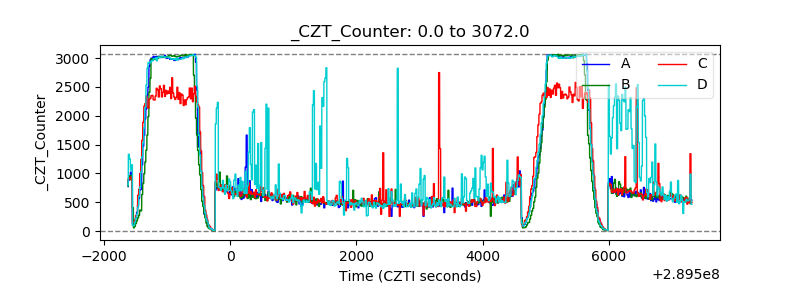 |
| +2.5 Volts monitor | 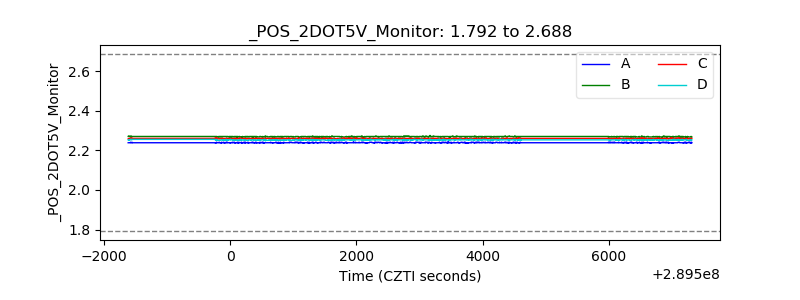 |
| +5 Volts monitor |  |
| _ROLL_ROT | 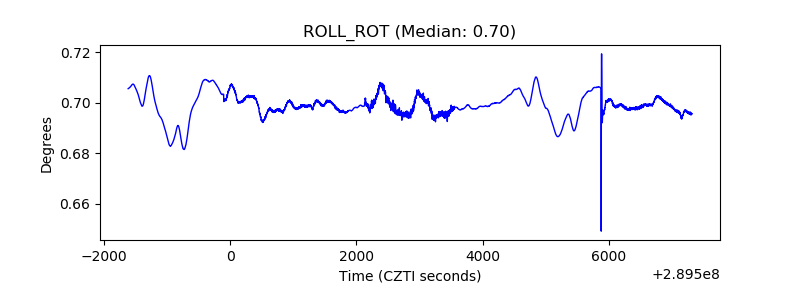 |
| _Roll_DEC |  |
| _Roll_RA | 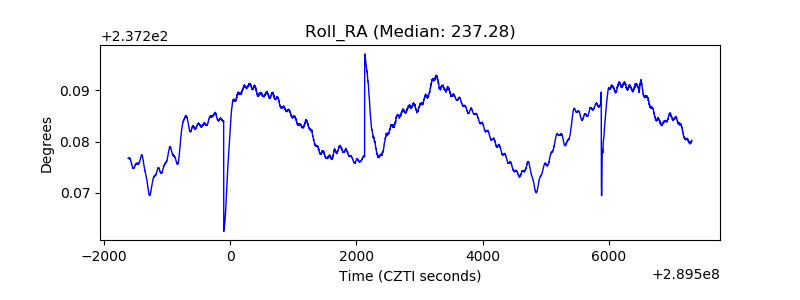 |
| Veto Counter | 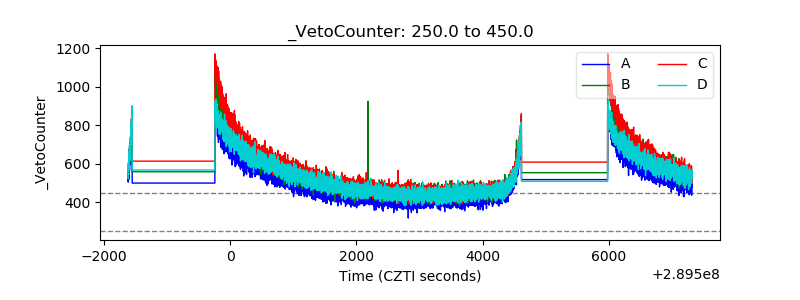 |