| Param | Original file | Final file |
|---|---|---|
| Filename | modeM0/AS1A05_167T01_9000002758_18571cztM0_level2.evt | modeM0/AS1A05_167T01_9000002758_18571cztM0_level2_quad_clean.evt |
| Size (bytes) | 507,038,400 | 98,939,520 |
| Size | 483.5 MB | 94.4 MB |
| Events in quadrant A | 3,381,728 | 634,405 |
| Events in quadrant B | 3,401,425 | 660,609 |
| Events in quadrant C | 3,642,487 | 643,234 |
| Events in quadrant D | 4,506,793 | 622,663 |
| Mode SS | |||
|---|---|---|---|
| Quadrant | BADHDUFLAG | Total packets | Discarded packets |
| A | 0 | 128 | 0 |
| B | 0 | 128 | 0 |
| C | 0 | 128 | 0 |
| D | 0 | 128 | 0 |
| Mode M0 | |||
|---|---|---|---|
| Quadrant | BADHDUFLAG | Total packets | Discarded packets |
| A | 0 | 13963 | 2 |
| B | 0 | 14047 | 2 |
| C | 0 | 14844 | 4 |
| D | 0 | 17480 | 2 |
| Mode M9 | |||
|---|---|---|---|
| Quadrant | BADHDUFLAG | Total packets | Discarded packets |
| A | 0 | 27 | 0 |
| B | 0 | 27 | 0 |
| C | 0 | 27 | 0 |
| D | 0 | 27 | 0 |
| Quadrant | Total seconds | Saturated seconds | Saturation percentage |
|---|---|---|---|
| A | 6242 | 88 | 1.409805% |
| B | 6243 | 108 | 1.729938% |
| C | 6242 | 186 | 2.979814% |
| D | 6242 | 526 | 8.426786% |
Noise dominated data is calculated using 1-second bins in cleaned event files. If a bin has >2000 counts, and if more than 50% of those come from <1% of pixels, then it is considered to be noise-dominated and hence unusable.
| Quadrant | # 1 sec bins | Bins with >0 counts | Bins with >2000 counts | High rate bins dominated by noise | Noise dominated (total time) | Noise dominated (detector-on time) | Marked lightcurve |
|---|---|---|---|---|---|---|---|
| A | 8987 | 6244 | 0 | 0 | 0.00% | 0.00% | 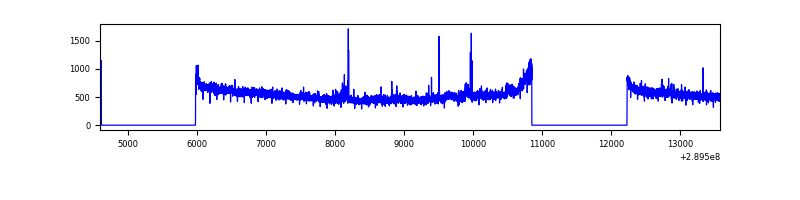 |
| B | 8988 | 6245 | 0 | 0 | 0.00% | 0.00% | 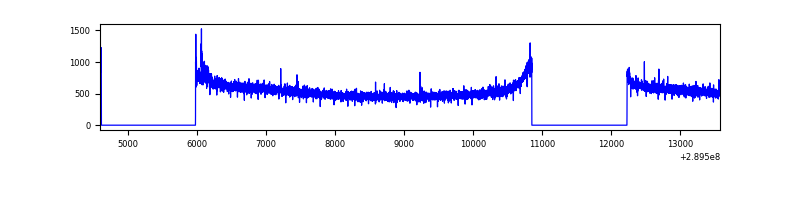 |
| C | 8987 | 6243 | 28 | 28 | 0.31% | 0.45% | 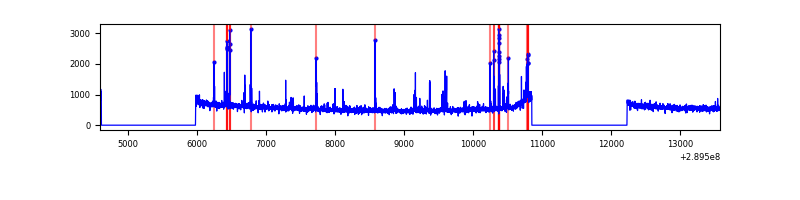 |
| D | 8987 | 6244 | 345 | 345 | 3.84% | 5.53% | 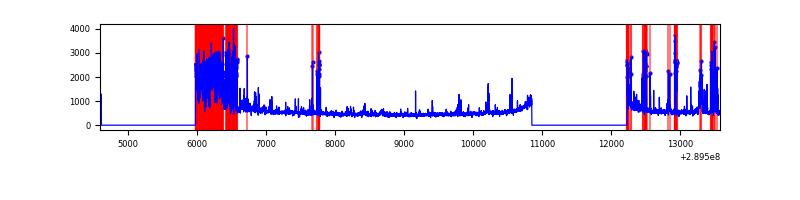 |
Top three noisy pixels from each quadrant. If the there are fewer than three noisy pixels in the level2.evt file, extra rows are filled as -1
| Pixel properties | Quadrant properties | ||||||
|---|---|---|---|---|---|---|---|
| Quadrant | DetID | PixID | Counts | Sigma | Mean | Median | Sigma |
| A | 14 | 111 | 43753 | 250.34 | 857 | 842 | 171.4 |
| A | 15 | 191 | 21626 | 121.25 | 857 | 842 | 171.4 |
| A | 4 | 2 | 12335 | 67.05 | 857 | 842 | 171.4 |
| B | 4 | 216 | 19690 | 116.32 | 866 | 845 | 162.0 |
| B | 12 | 111 | 18434 | 108.57 | 866 | 845 | 162.0 |
| B | 11 | 111 | 16286 | 95.31 | 866 | 845 | 162.0 |
| C | 4 | 254 | 146552 | 749.71 | 842 | 851 | 194.3 |
| C | 14 | 238 | 131325 | 671.36 | 842 | 851 | 194.3 |
| C | 9 | 54 | 82402 | 419.62 | 842 | 851 | 194.3 |
| D | 7 | 238 | 849783 | 4285.49 | 824 | 802 | 198.1 |
| D | 1 | 52 | 307274 | 1547.01 | 824 | 802 | 198.1 |
| D | 9 | 1 | 150385 | 755.07 | 824 | 802 | 198.1 |
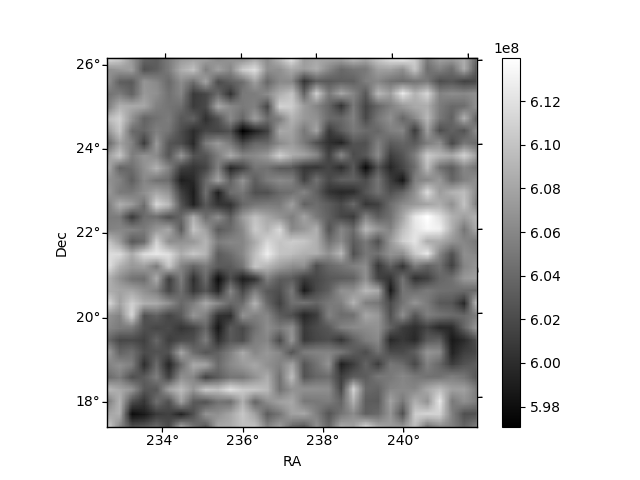
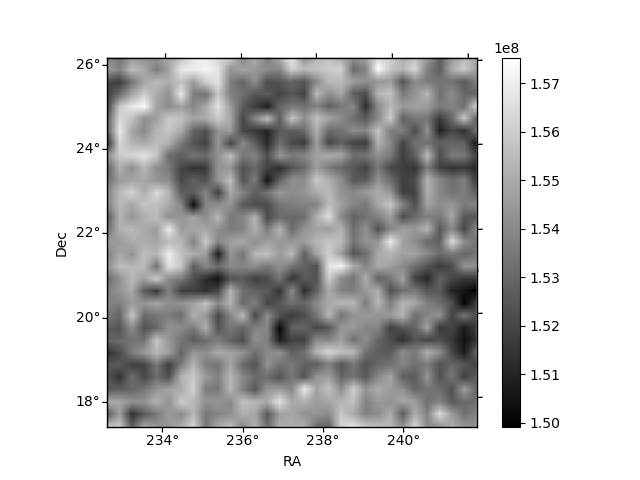
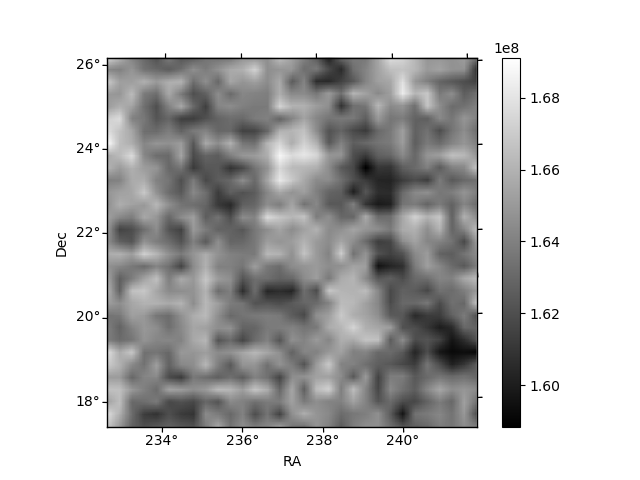
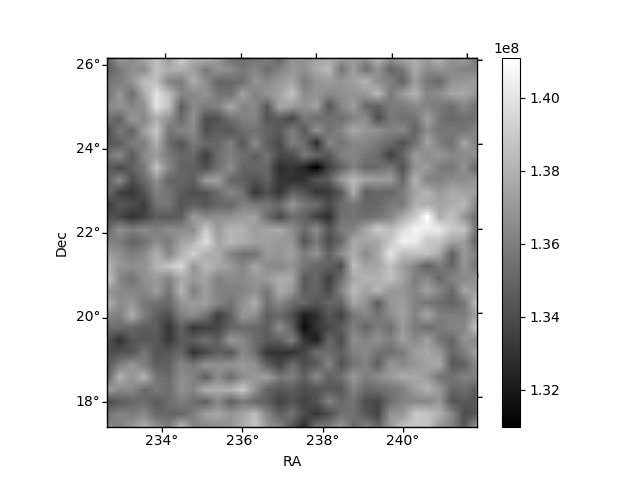
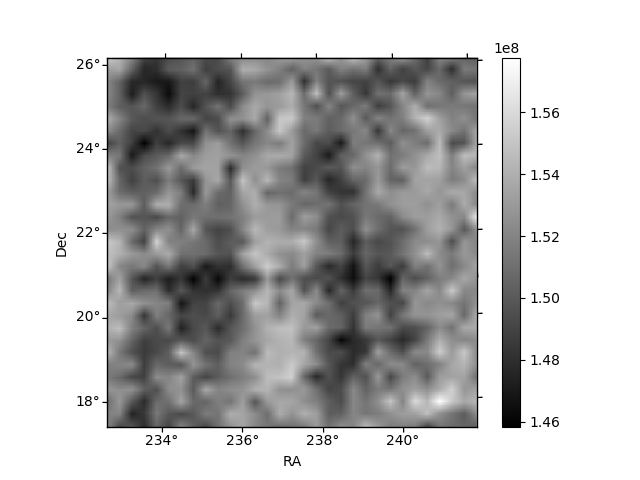
Histogram calculated using DETX and DETY for each event in the final _common_clean file
| Quadrant A | 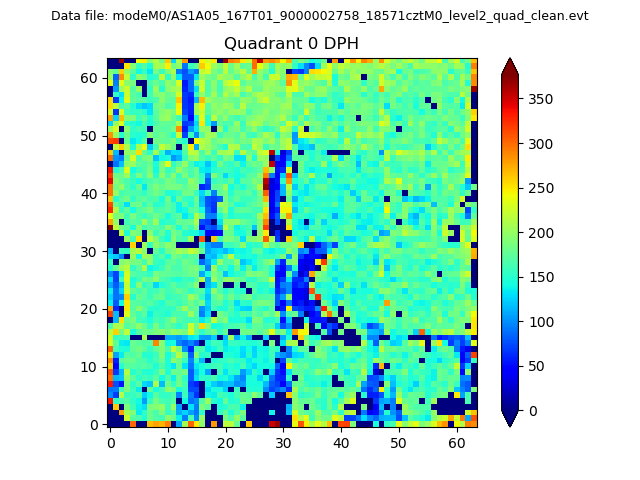 |
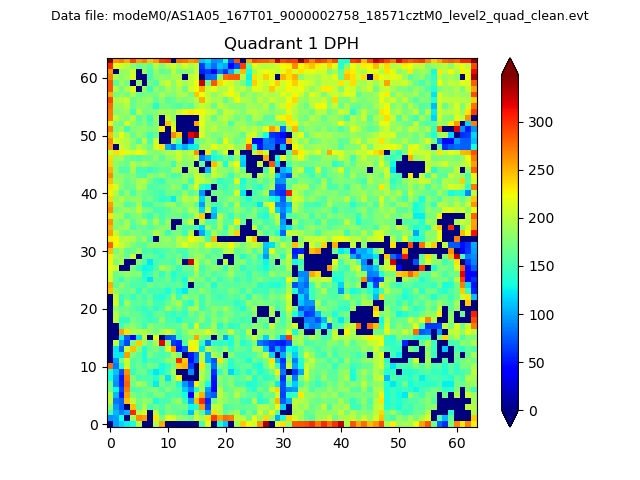 |
Quadrant B |
|---|---|---|---|
| Quadrant D | 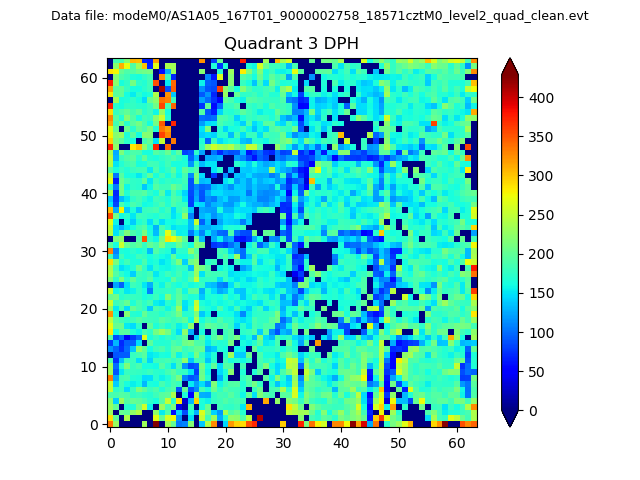 |
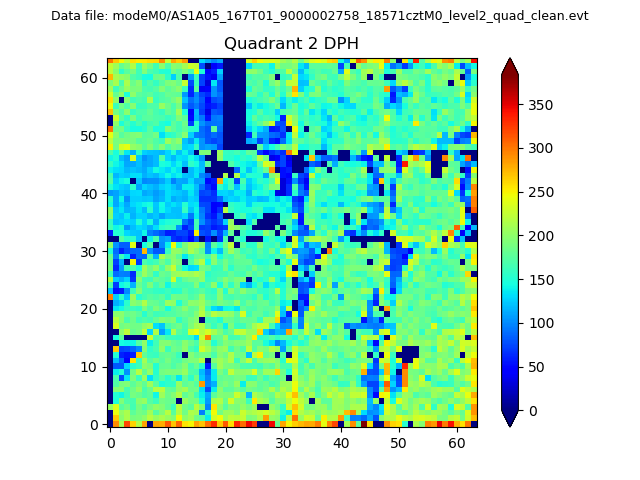 |
Quadrant C |
| Plot type | Count rate plots | Images |
|---|---|---|
| Comparison with Poisson distribution Blue bars denote a histogram of data divided into 1 sec bins. Red curve is a Poisson curve with rate = median count rate of data. |
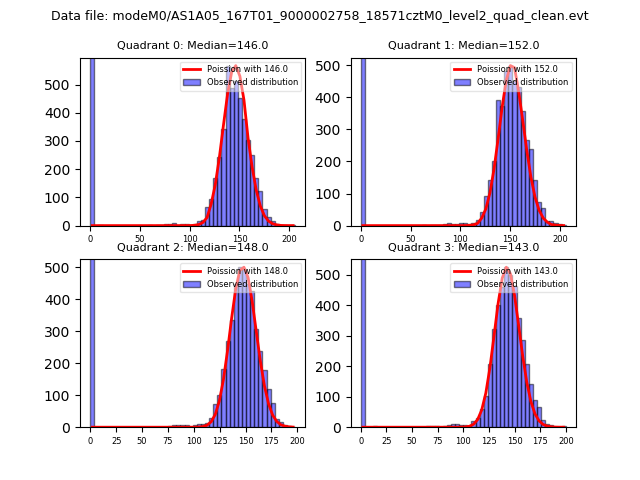 |
 |
| Quadrant-wise count rates Data is divided into 100 sec bins |
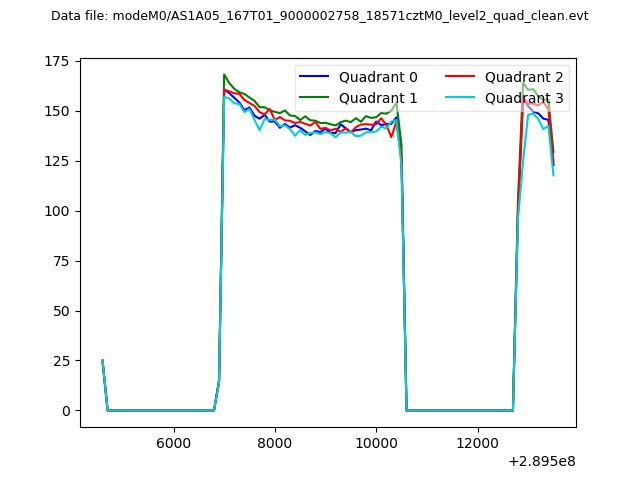 |
|
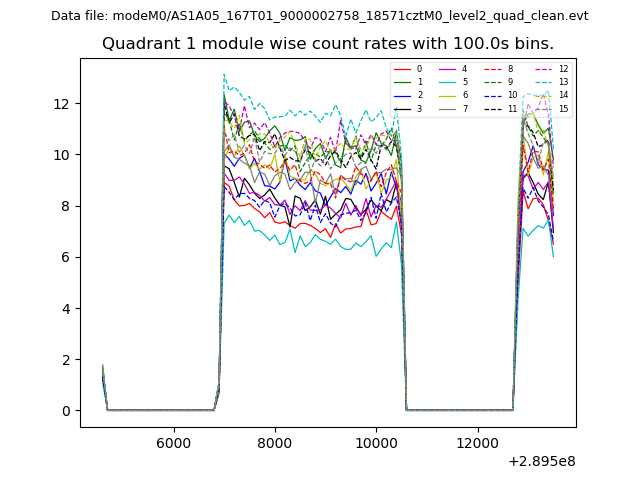
| Module-wise count rates for Quadrant A Data is divided into 100 sec bins |
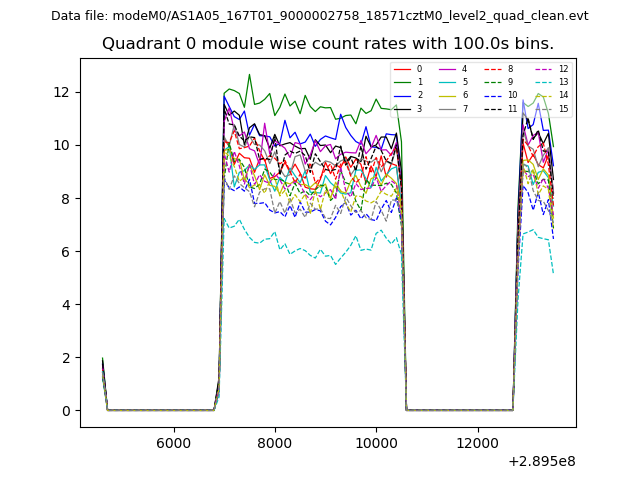 |
 |
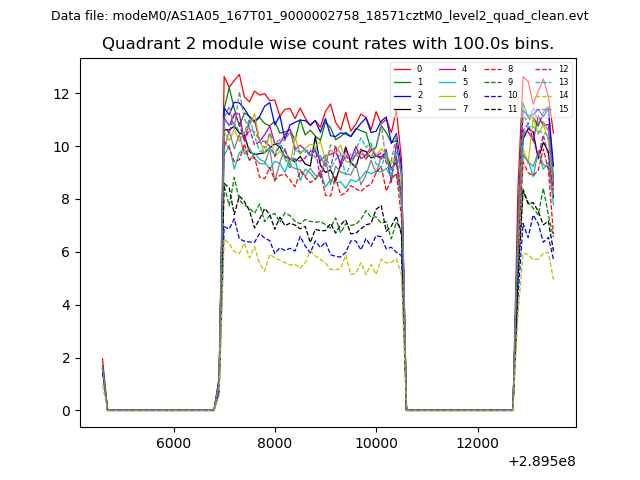
| Module-wise count rates for Quadrant B Data is divided into 100 sec bins |
 |
 |
| Module-wise count rates for Quadrant C Data is divided into 100 sec bins |
 |
 |
| Module-wise count rates for Quadrant D Data is divided into 100 sec bins |
 |
 |
| Parameter | Plot |
|---|---|
| CZT HV Monitor | 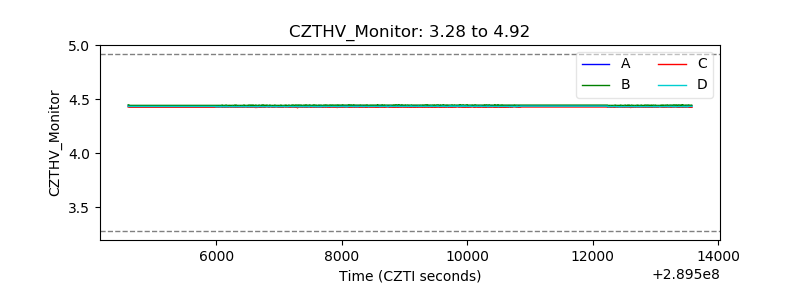 |
| D_VDD | 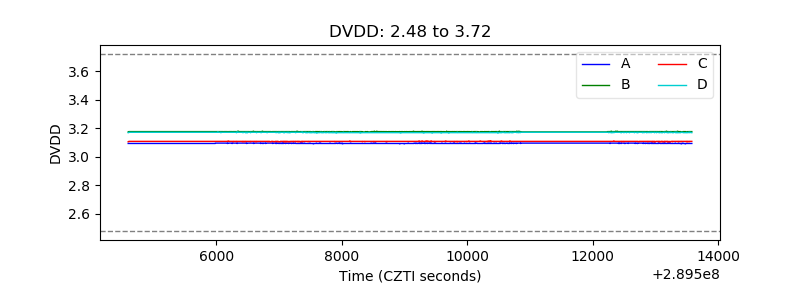 |
| Temperature 1 | 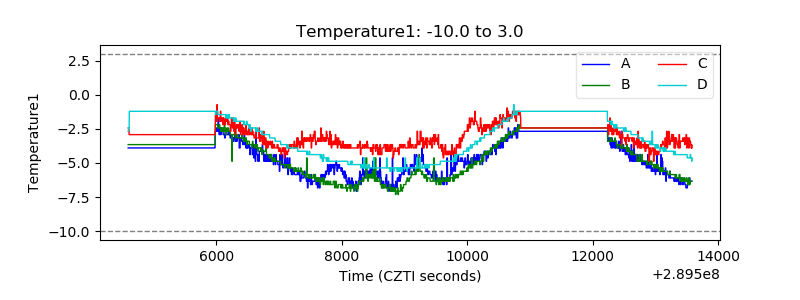 |
| Veto HV Monitor | 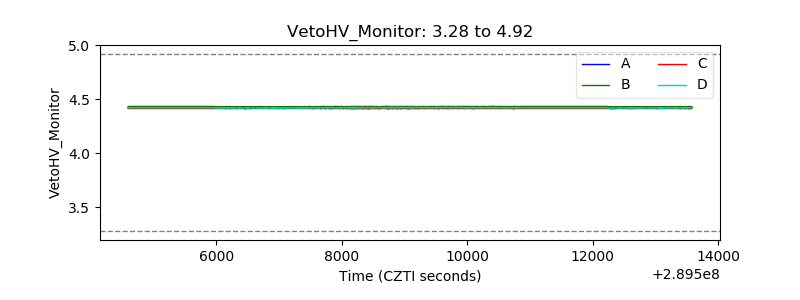 |
| Veto LLD | 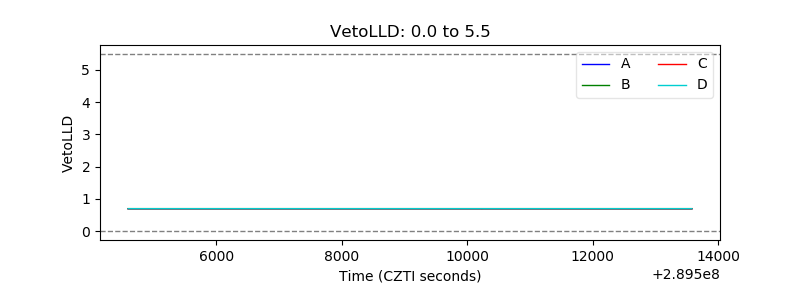 |
| Alpha Counter | 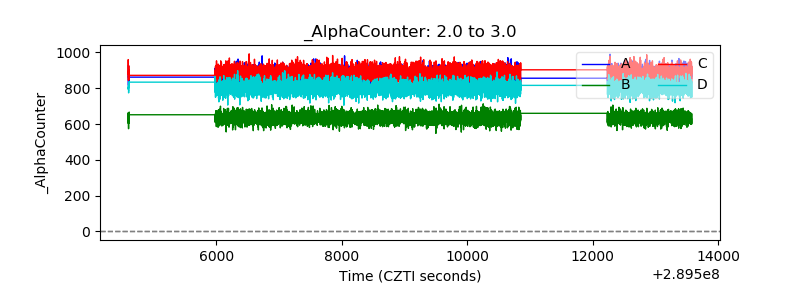 |
| _CPM_Rate | 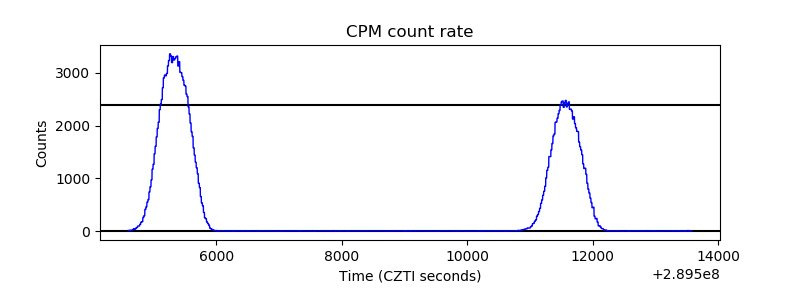 |
| CZT Counter | 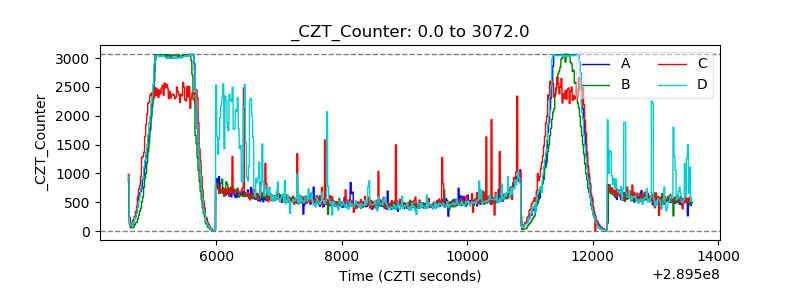 |
| +2.5 Volts monitor |  |
| +5 Volts monitor |  |
| _ROLL_ROT | 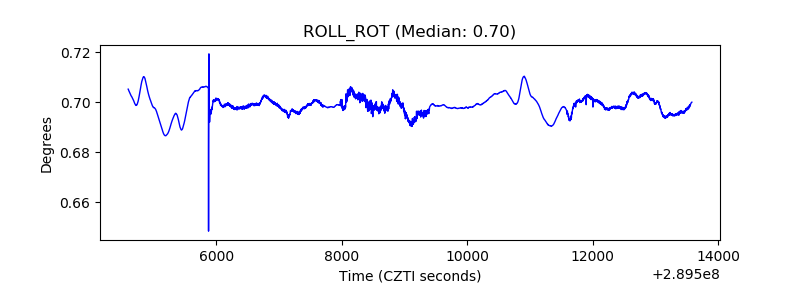 |
| _Roll_DEC | 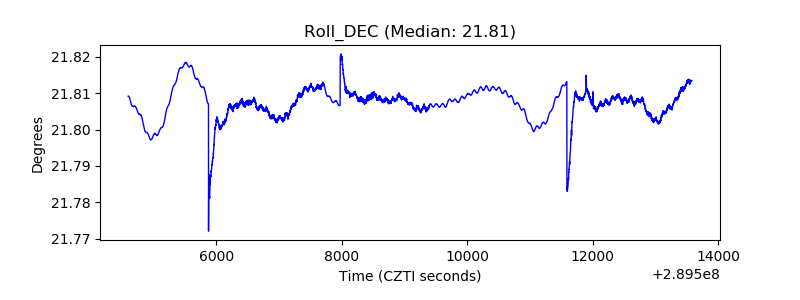 |
| _Roll_RA | 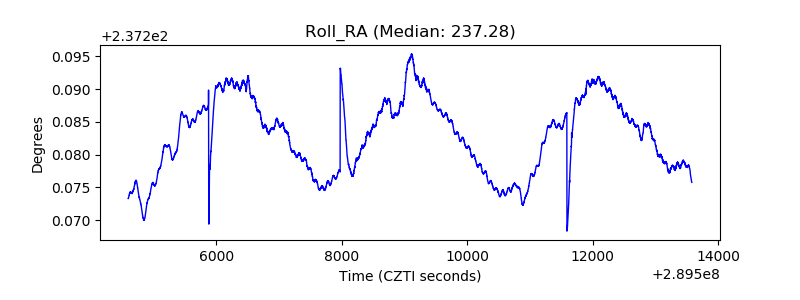 |
| Veto Counter | 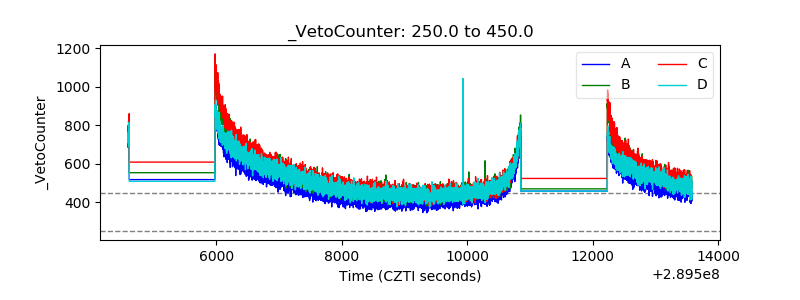 |