| Param | Original file | Final file |
|---|---|---|
| Filename | modeM0/AS1A05_167T01_9000002758_18572cztM0_level2.evt | modeM0/AS1A05_167T01_9000002758_18572cztM0_level2_quad_clean.evt |
| Size (bytes) | 488,586,240 | 99,040,320 |
| Size | 466.0 MB | 94.5 MB |
| Events in quadrant A | 3,182,341 | 641,939 |
| Events in quadrant B | 3,181,870 | 667,283 |
| Events in quadrant C | 3,391,963 | 648,386 |
| Events in quadrant D | 4,625,284 | 614,307 |
| Mode SS | |||
|---|---|---|---|
| Quadrant | BADHDUFLAG | Total packets | Discarded packets |
| A | 0 | 124 | 0 |
| B | 0 | 124 | 0 |
| C | 0 | 124 | 0 |
| D | 0 | 124 | 0 |
| Mode M0 | |||
|---|---|---|---|
| Quadrant | BADHDUFLAG | Total packets | Discarded packets |
| A | 0 | 13339 | 2 |
| B | 0 | 13271 | 2 |
| C | 0 | 13866 | 2 |
| D | 0 | 17859 | 2 |
| Mode M9 | |||
|---|---|---|---|
| Quadrant | BADHDUFLAG | Total packets | Discarded packets |
| A | 0 | 24 | 0 |
| B | 0 | 25 | 0 |
| C | 0 | 25 | 0 |
| D | 0 | 25 | 0 |
| Quadrant | Total seconds | Saturated seconds | Saturation percentage |
|---|---|---|---|
| A | 6125 | 50 | 0.816327% |
| B | 6125 | 37 | 0.604082% |
| C | 6125 | 117 | 1.910204% |
| D | 6125 | 276 | 4.506122% |
Noise dominated data is calculated using 1-second bins in cleaned event files. If a bin has >2000 counts, and if more than 50% of those come from <1% of pixels, then it is considered to be noise-dominated and hence unusable.
| Quadrant | # 1 sec bins | Bins with >0 counts | Bins with >2000 counts | High rate bins dominated by noise | Noise dominated (total time) | Noise dominated (detector-on time) | Marked lightcurve |
|---|---|---|---|---|---|---|---|
| A | 7445 | 6126 | 12 | 12 | 0.16% | 0.20% | 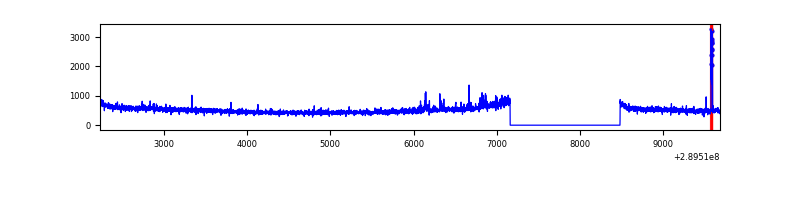 |
| B | 7445 | 6126 | 5 | 5 | 0.07% | 0.08% | 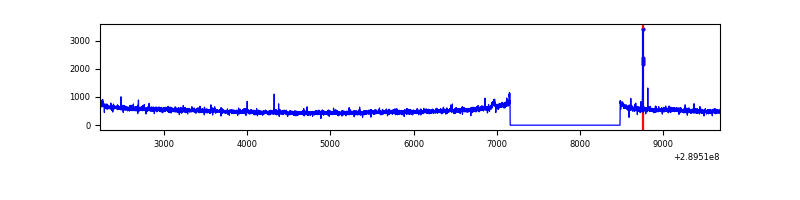 |
| C | 7445 | 6126 | 28 | 28 | 0.38% | 0.46% | 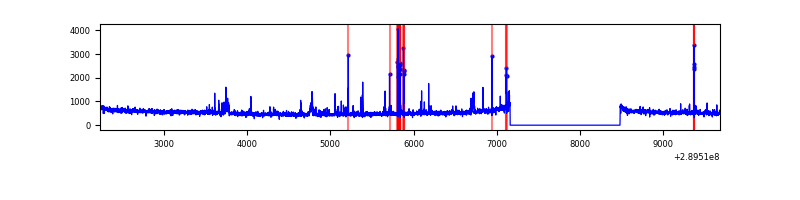 |
| D | 7445 | 6126 | 207 | 207 | 2.78% | 3.38% | 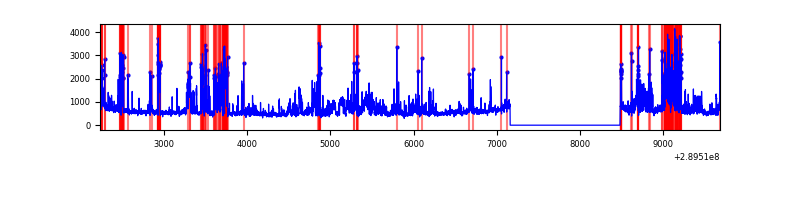 |
Top three noisy pixels from each quadrant. If the there are fewer than three noisy pixels in the level2.evt file, extra rows are filled as -1
| Pixel properties | Quadrant properties | ||||||
|---|---|---|---|---|---|---|---|
| Quadrant | DetID | PixID | Counts | Sigma | Mean | Median | Sigma |
| A | 14 | 111 | 80847 | 503.78 | 795 | 782 | 158.9 |
| A | 4 | 2 | 36504 | 224.77 | 795 | 782 | 158.9 |
| A | 13 | 254 | 10251 | 59.58 | 795 | 782 | 158.9 |
| B | 12 | 111 | 17710 | 110.97 | 806 | 789 | 152.5 |
| B | 6 | 36 | 16968 | 106.1 | 806 | 789 | 152.5 |
| B | 0 | 198 | 15964 | 99.52 | 806 | 789 | 152.5 |
| C | 14 | 238 | 122431 | 669.86 | 781 | 789 | 181.6 |
| C | 4 | 254 | 108947 | 595.6 | 781 | 789 | 181.6 |
| C | 9 | 54 | 69312 | 377.34 | 781 | 789 | 181.6 |
| D | 1 | 52 | 869130 | 4645.74 | 770 | 751 | 186.9 |
| D | 7 | 238 | 540329 | 2886.69 | 770 | 751 | 186.9 |
| D | 9 | 1 | 200521 | 1068.75 | 770 | 751 | 186.9 |
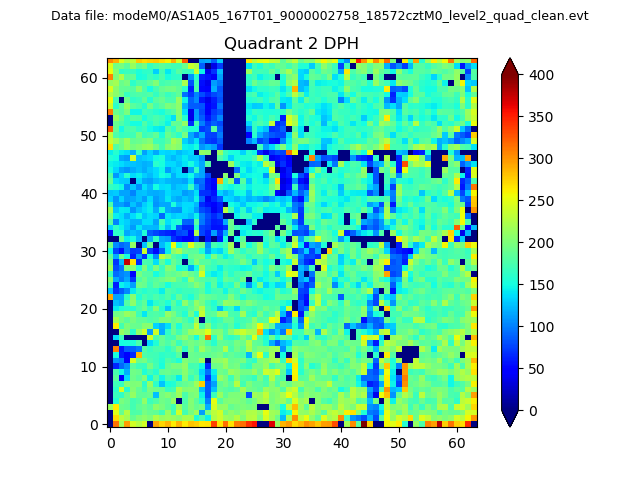
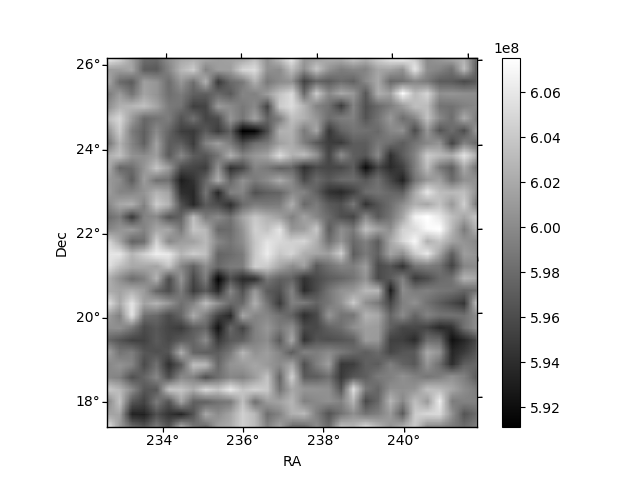
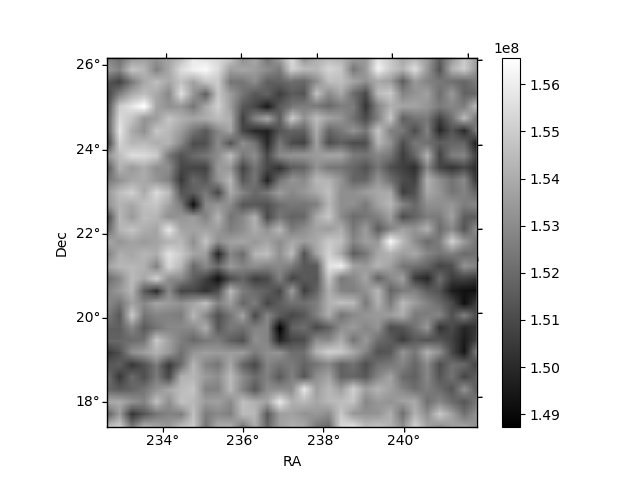
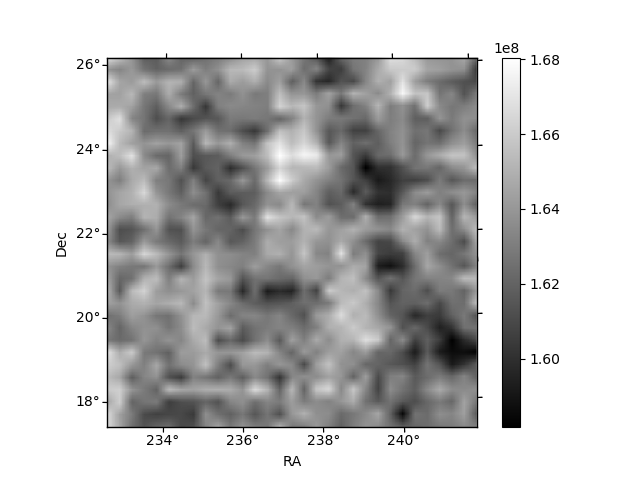
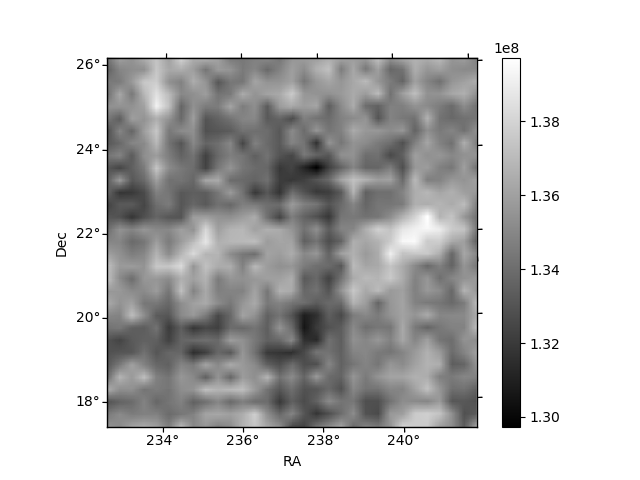
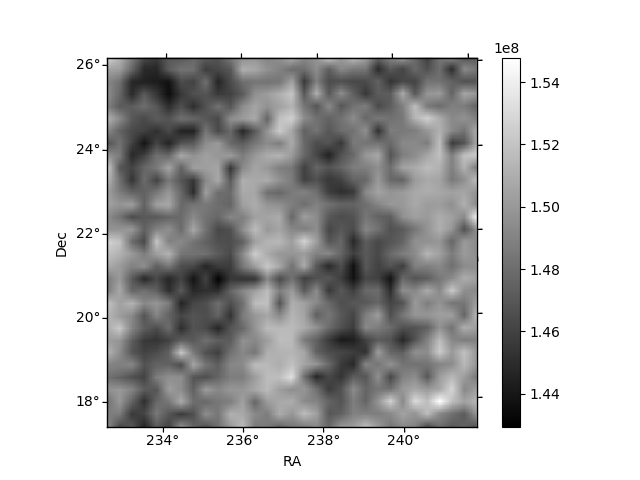
Histogram calculated using DETX and DETY for each event in the final _common_clean file
| Quadrant A | 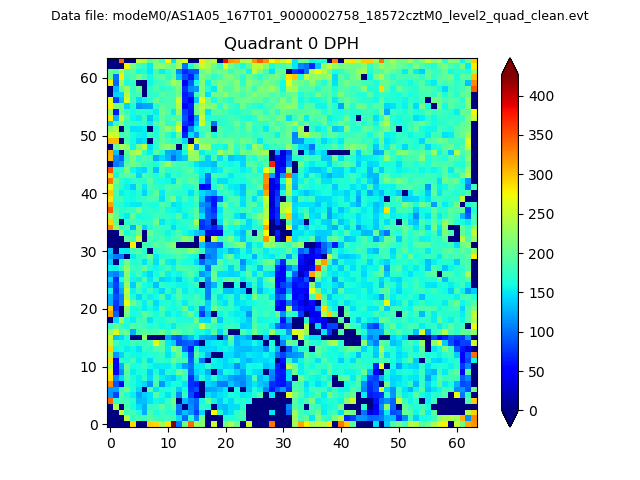 |
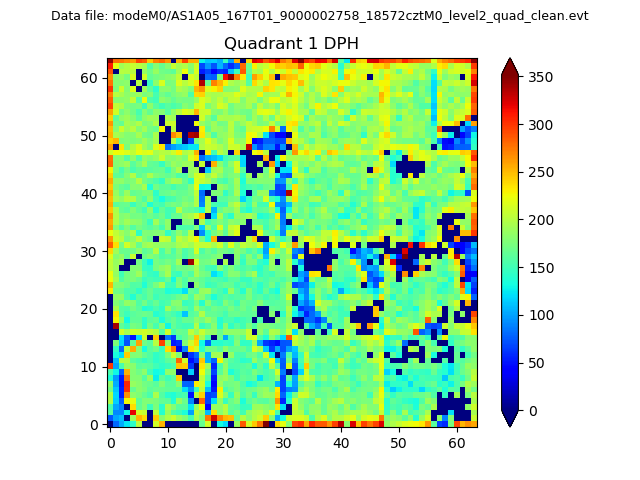 |
Quadrant B |
|---|---|---|---|
| Quadrant D | 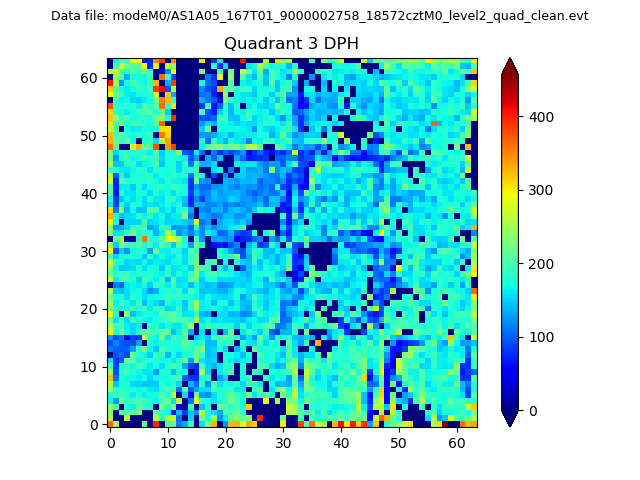 |
 |
Quadrant C |
| Plot type | Count rate plots | Images |
|---|---|---|
| Comparison with Poisson distribution Blue bars denote a histogram of data divided into 1 sec bins. Red curve is a Poisson curve with rate = median count rate of data. |
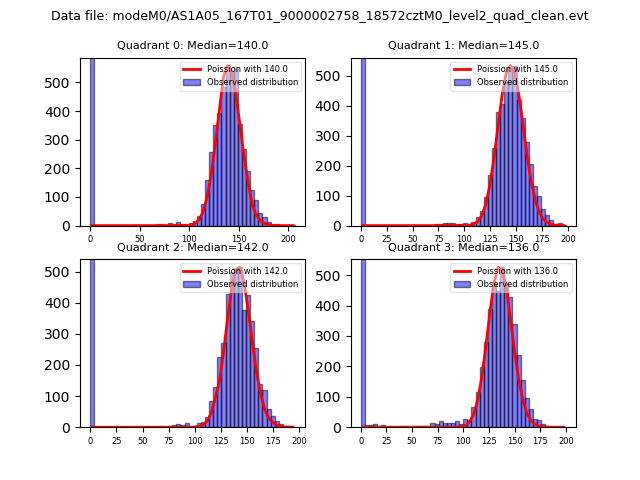 |
 |
| Quadrant-wise count rates Data is divided into 100 sec bins |
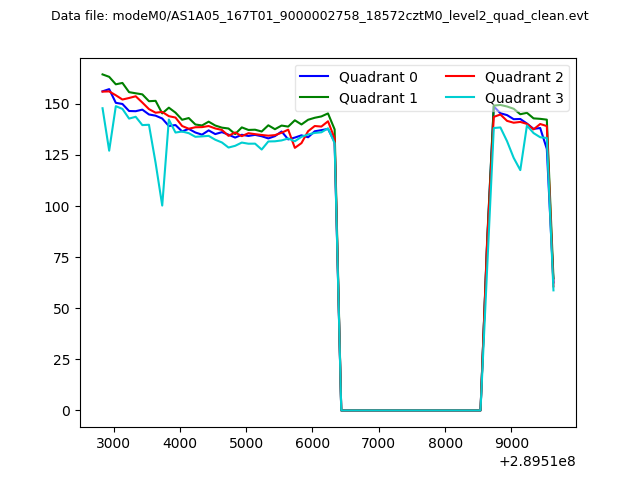 |
|
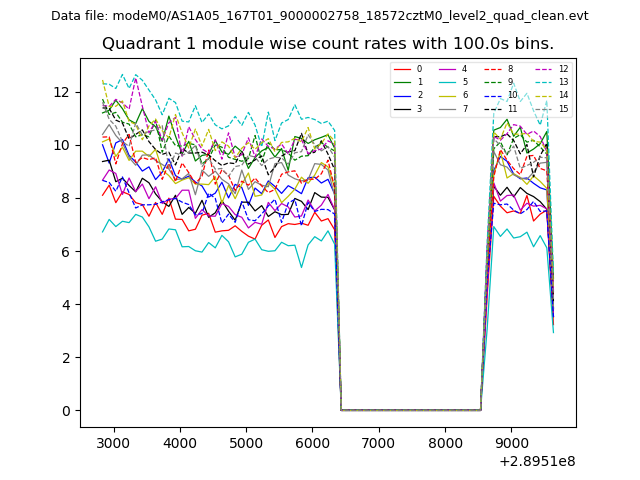
| Module-wise count rates for Quadrant A Data is divided into 100 sec bins |
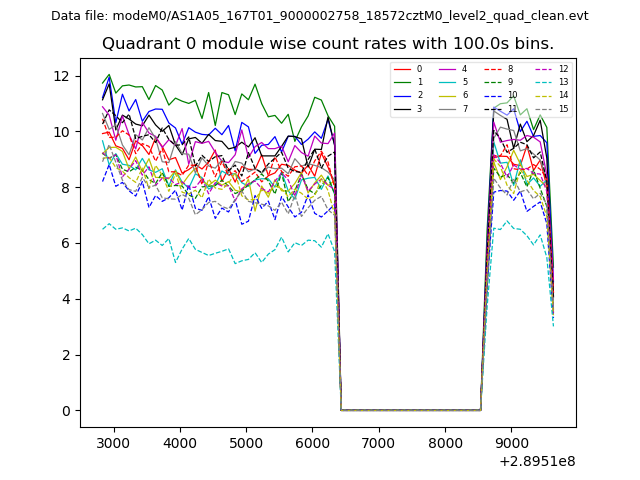 |
 |
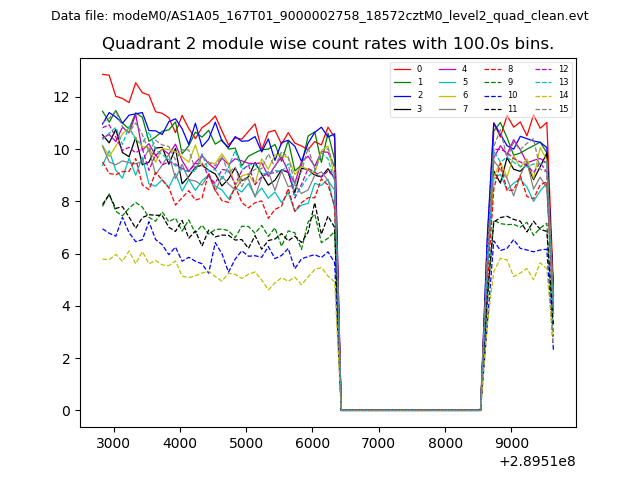
| Module-wise count rates for Quadrant B Data is divided into 100 sec bins |
 |
 |
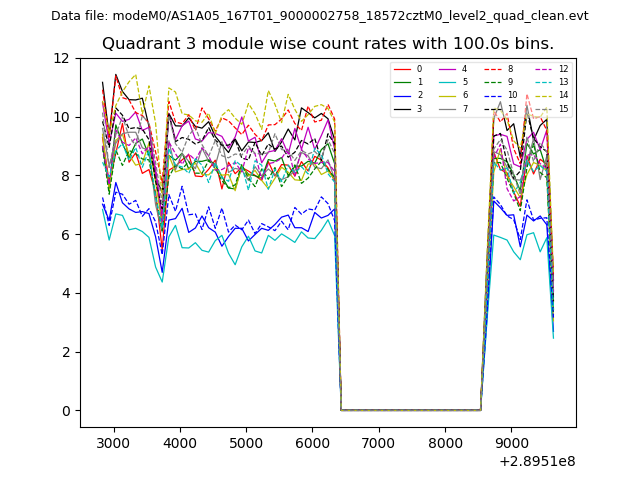
| Module-wise count rates for Quadrant C Data is divided into 100 sec bins |
 |
 |
| Module-wise count rates for Quadrant D Data is divided into 100 sec bins |
 |
 |
| Parameter | Plot |
|---|---|
| CZT HV Monitor | 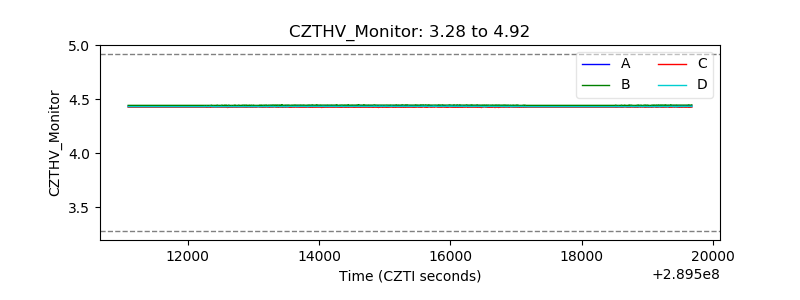 |
| D_VDD | 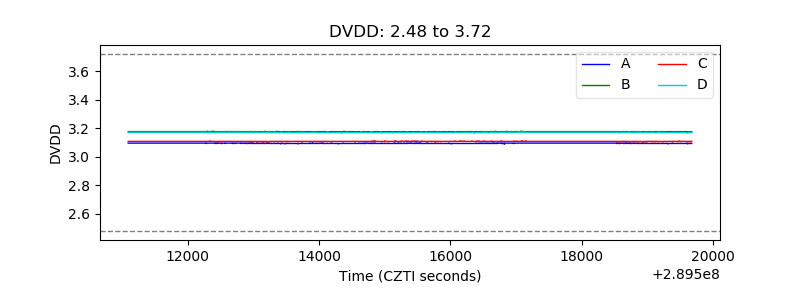 |
| Temperature 1 | 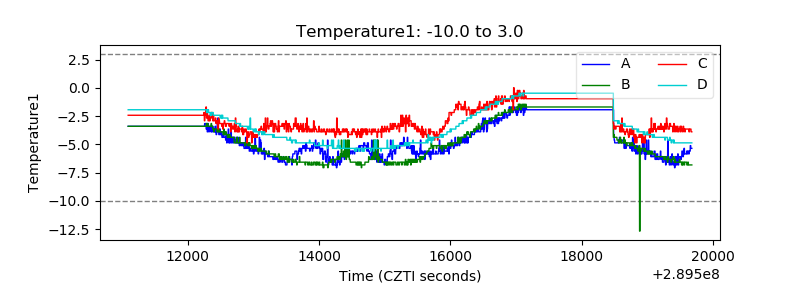 |
| Veto HV Monitor | 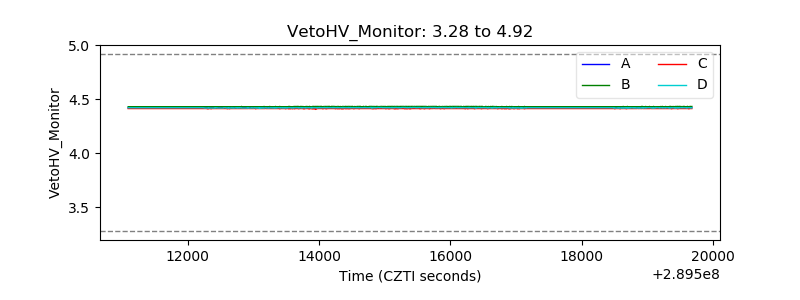 |
| Veto LLD | 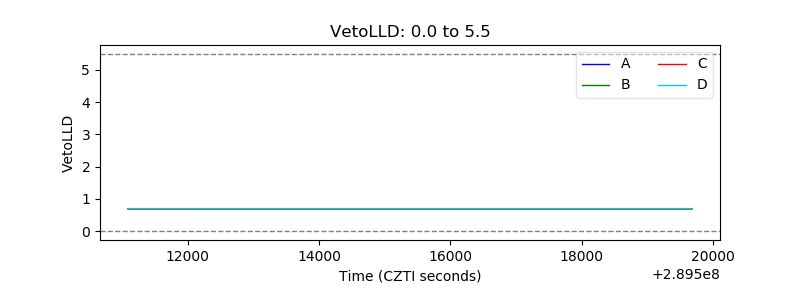 |
| Alpha Counter | 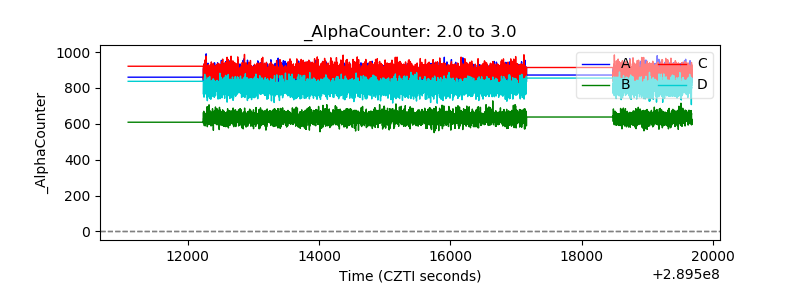 |
| _CPM_Rate | 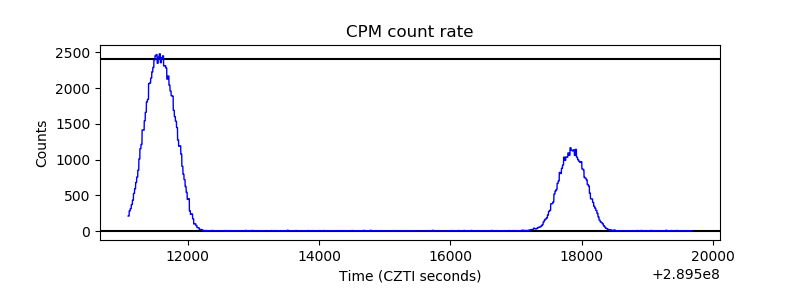 |
| CZT Counter | 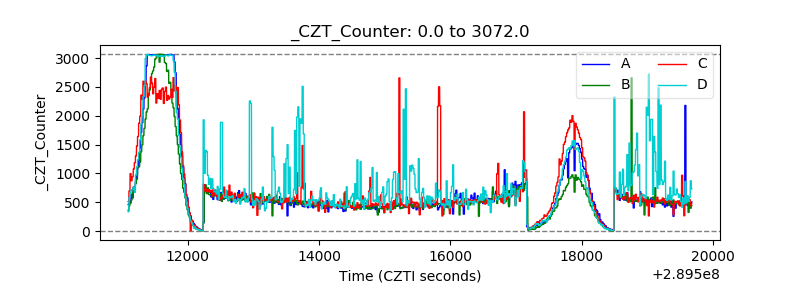 |
| +2.5 Volts monitor |  |
| +5 Volts monitor | 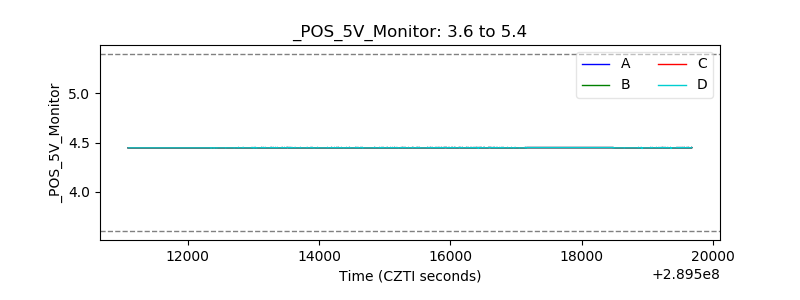 |
| _ROLL_ROT |  |
| _Roll_DEC | 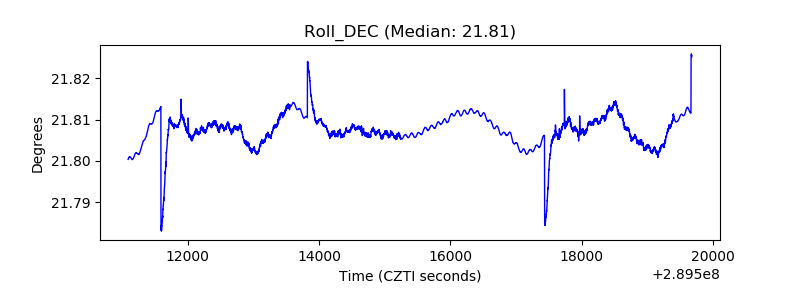 |
| _Roll_RA | 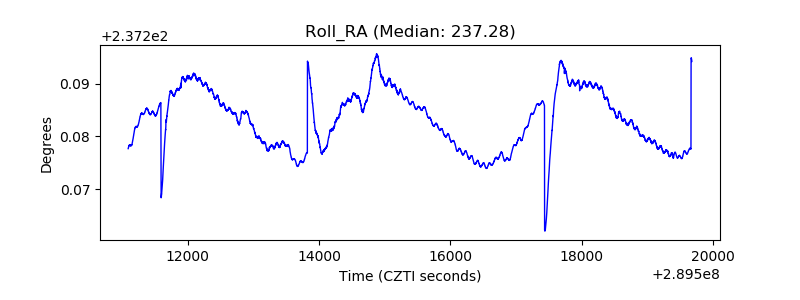 |
| Veto Counter | 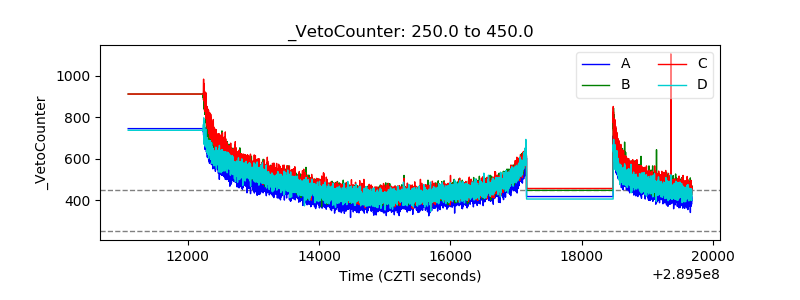 |