| Param | Original file | Final file |
|---|---|---|
| Filename | modeM0/AS1A05_167T01_9000002758_18573cztM0_level2.evt | modeM0/AS1A05_167T01_9000002758_18573cztM0_level2_quad_clean.evt |
| Size (bytes) | 133,306,560 | 29,937,600 |
| Size | 127.1 MB | 28.6 MB |
| Events in quadrant A | 846,901 | 197,841 |
| Events in quadrant B | 855,300 | 204,329 |
| Events in quadrant C | 876,499 | 197,486 |
| Events in quadrant D | 1,345,471 | 186,783 |
| Mode SS | |||
|---|---|---|---|
| Quadrant | BADHDUFLAG | Total packets | Discarded packets |
| A | 0 | 34 | 0 |
| B | 0 | 34 | 0 |
| C | 0 | 34 | 0 |
| D | 0 | 34 | 0 |
| Mode M0 | |||
|---|---|---|---|
| Quadrant | BADHDUFLAG | Total packets | Discarded packets |
| A | 0 | 3479 | 1 |
| B | 0 | 3500 | 1 |
| C | 0 | 3541 | 1 |
| D | 0 | 5131 | 1 |
| Mode M9 | |||
|---|---|---|---|
| Quadrant | BADHDUFLAG | Total packets | Discarded packets |
| A | 0 | 4 | 0 |
| B | 0 | 5 | 0 |
| C | 0 | 5 | 0 |
| D | 0 | 5 | 0 |
| Quadrant | Total seconds | Saturated seconds | Saturation percentage |
|---|---|---|---|
| A | 1621 | 18 | 1.110426% |
| B | 1621 | 14 | 0.863664% |
| C | 1621 | 27 | 1.665638% |
| D | 1621 | 108 | 6.662554% |
Noise dominated data is calculated using 1-second bins in cleaned event files. If a bin has >2000 counts, and if more than 50% of those come from <1% of pixels, then it is considered to be noise-dominated and hence unusable.
| Quadrant | # 1 sec bins | Bins with >0 counts | Bins with >2000 counts | High rate bins dominated by noise | Noise dominated (total time) | Noise dominated (detector-on time) | Marked lightcurve |
|---|---|---|---|---|---|---|---|
| A | 1621 | 1621 | 12 | 12 | 0.74% | 0.74% | 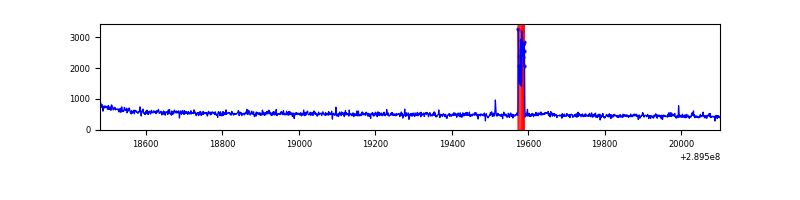 |
| B | 1621 | 1621 | 5 | 5 | 0.31% | 0.31% | 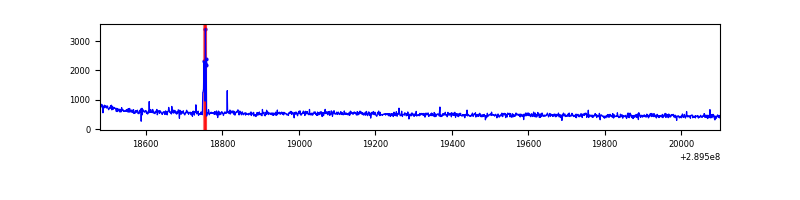 |
| C | 1621 | 1621 | 4 | 4 | 0.25% | 0.25% | 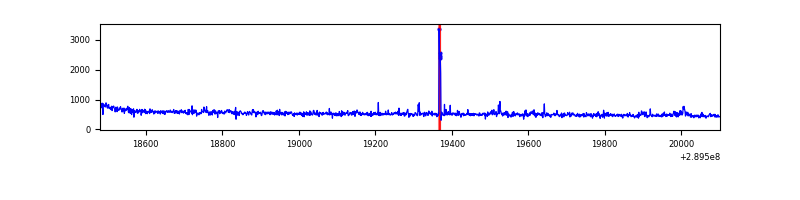 |
| D | 1621 | 1621 | 82 | 82 | 5.06% | 5.06% | 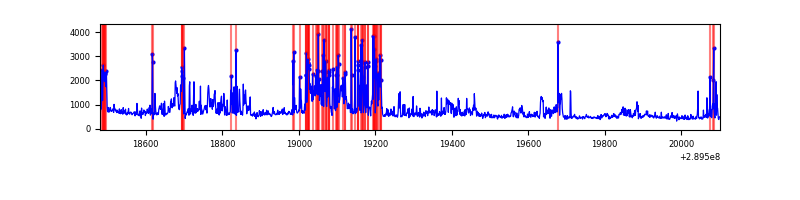 |
Top three noisy pixels from each quadrant. If the there are fewer than three noisy pixels in the level2.evt file, extra rows are filled as -1
| Pixel properties | Quadrant properties | ||||||
|---|---|---|---|---|---|---|---|
| Quadrant | DetID | PixID | Counts | Sigma | Mean | Median | Sigma |
| A | 4 | 2 | 35865 | 810.91 | 208 | 204 | 44.0 |
| A | 14 | 111 | 9190 | 204.34 | 208 | 204 | 44.0 |
| A | 13 | 254 | 3112 | 66.13 | 208 | 204 | 44.0 |
| B | 6 | 36 | 14829 | 343.68 | 213 | 208 | 42.5 |
| B | 0 | 198 | 6275 | 142.6 | 213 | 208 | 42.5 |
| B | 12 | 111 | 4873 | 109.65 | 213 | 208 | 42.5 |
| C | 14 | 238 | 32636 | 644.24 | 207 | 207 | 50.3 |
| C | 3 | 233 | 12563 | 245.47 | 207 | 207 | 50.3 |
| C | 4 | 254 | 10541 | 205.3 | 207 | 207 | 50.3 |
| D | 1 | 52 | 275002 | 5342.67 | 201 | 195 | 51.4 |
| D | 7 | 238 | 173257 | 3364.59 | 201 | 195 | 51.4 |
| D | 9 | 1 | 63012 | 1221.26 | 201 | 195 | 51.4 |
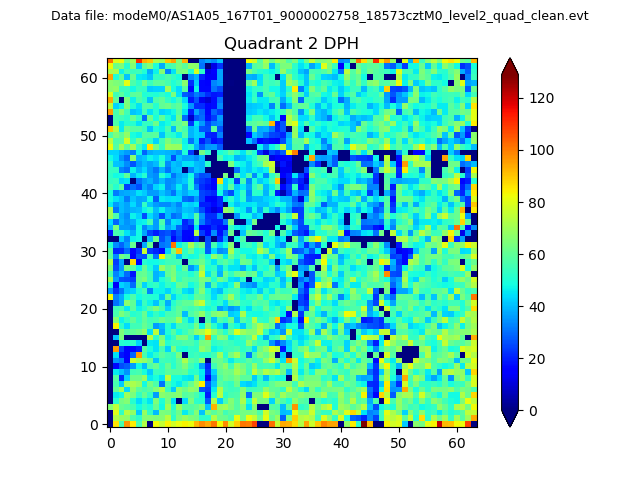
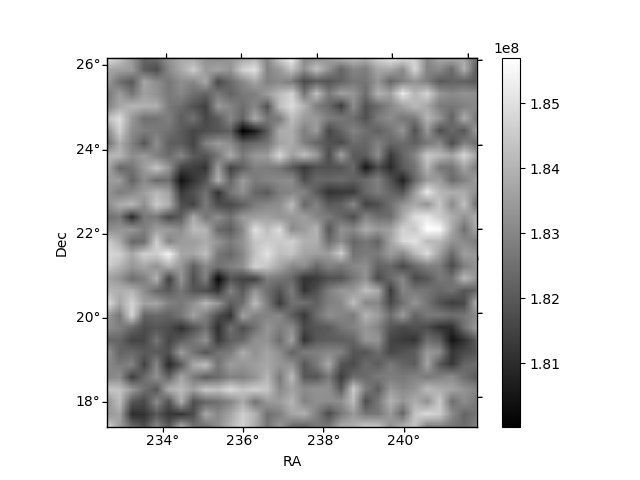
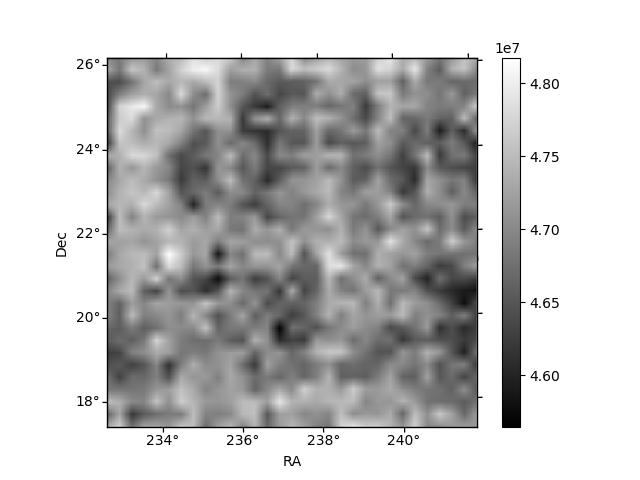
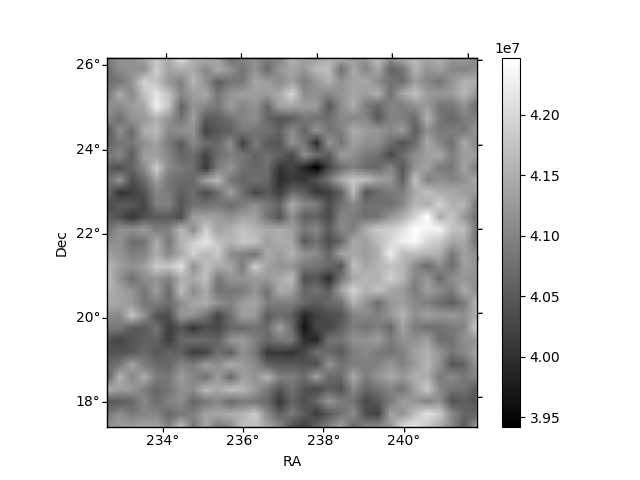
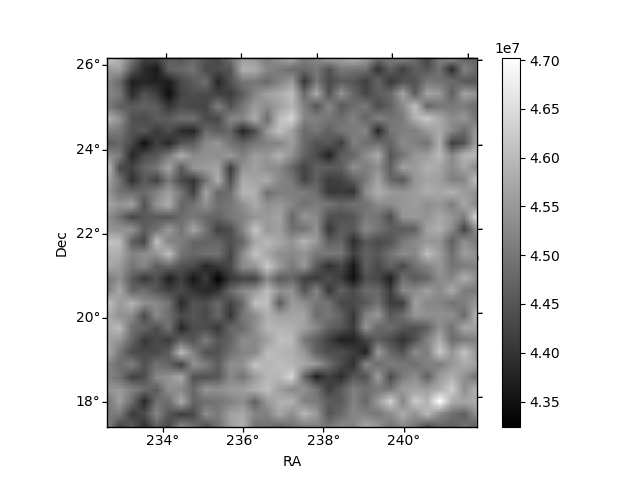
Histogram calculated using DETX and DETY for each event in the final _common_clean file
| Quadrant A | 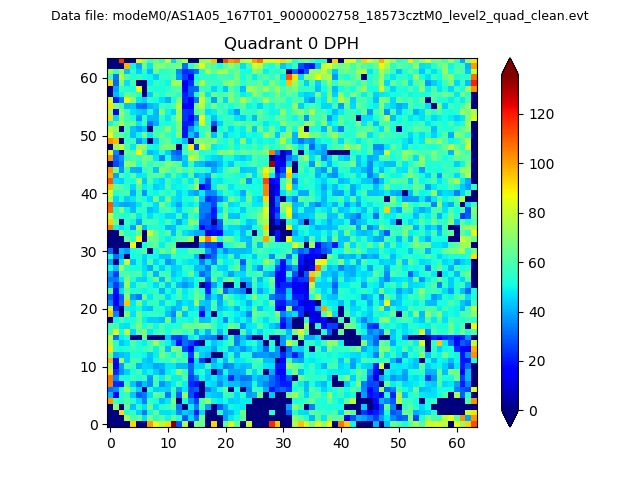 |
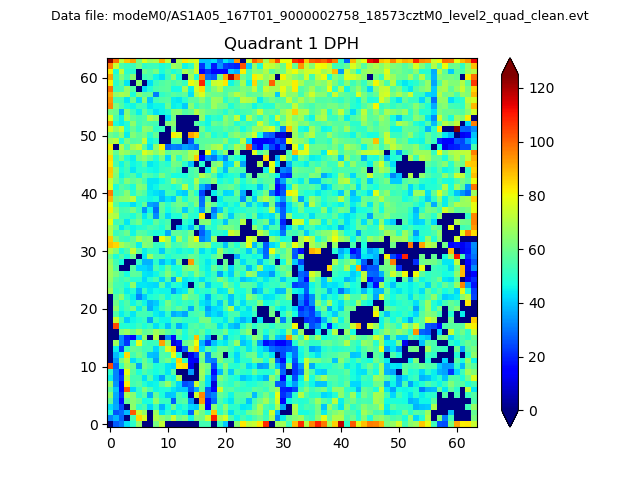 |
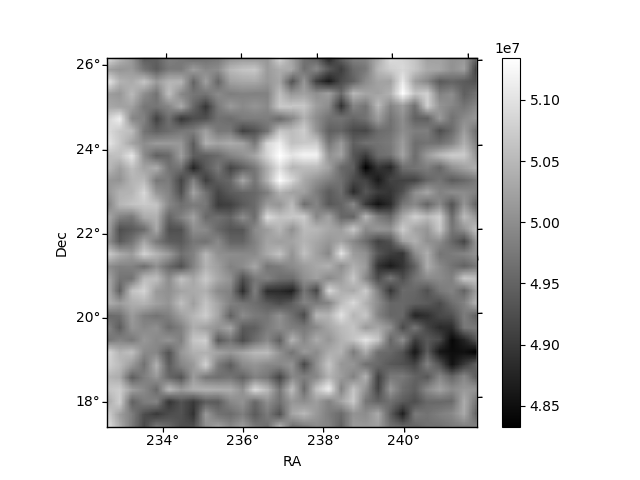
Quadrant B |
|---|---|---|---|
| Quadrant D | 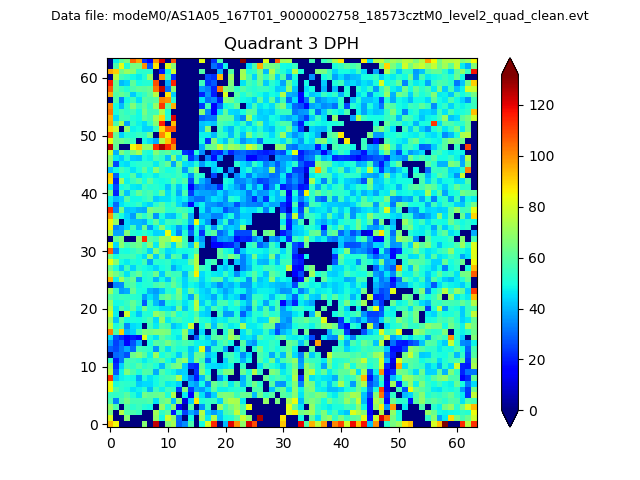 |
 |
Quadrant C |
| Plot type | Count rate plots | Images |
|---|---|---|
| Comparison with Poisson distribution Blue bars denote a histogram of data divided into 1 sec bins. Red curve is a Poisson curve with rate = median count rate of data. |
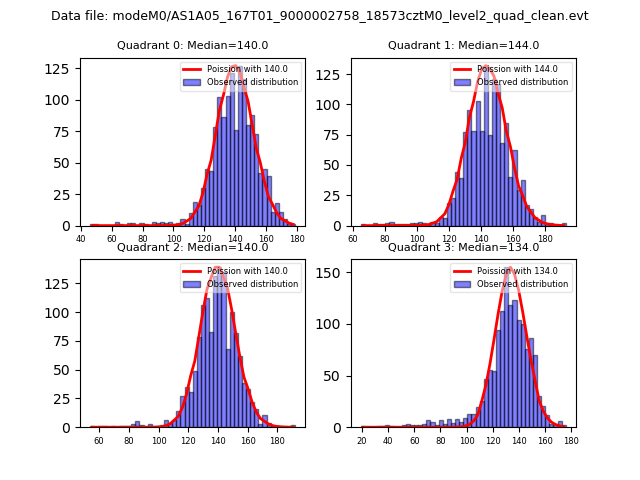 |
 |
| Quadrant-wise count rates Data is divided into 100 sec bins |
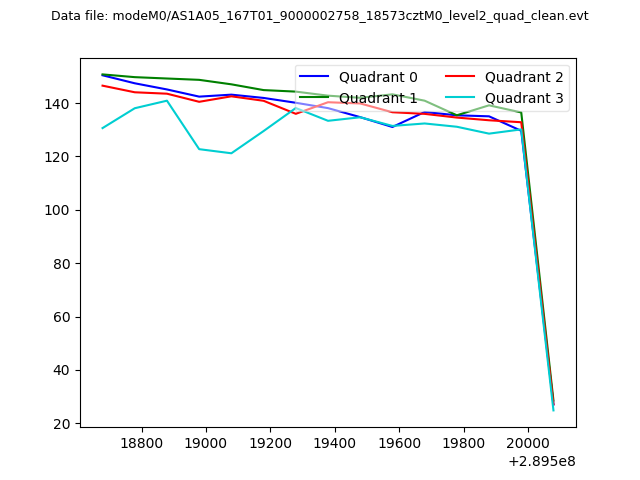 |
|
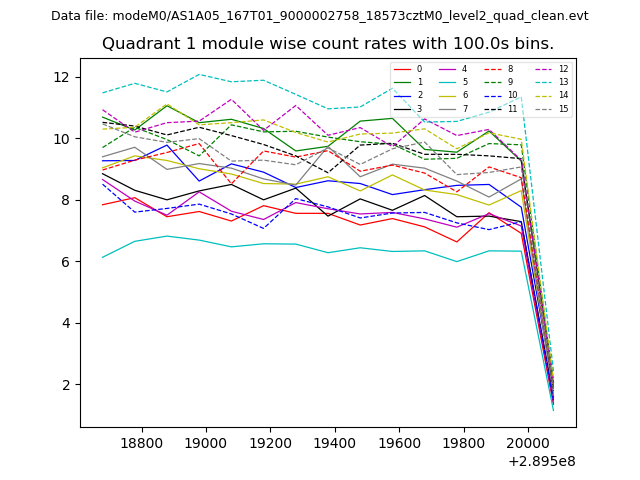
| Module-wise count rates for Quadrant A Data is divided into 100 sec bins |
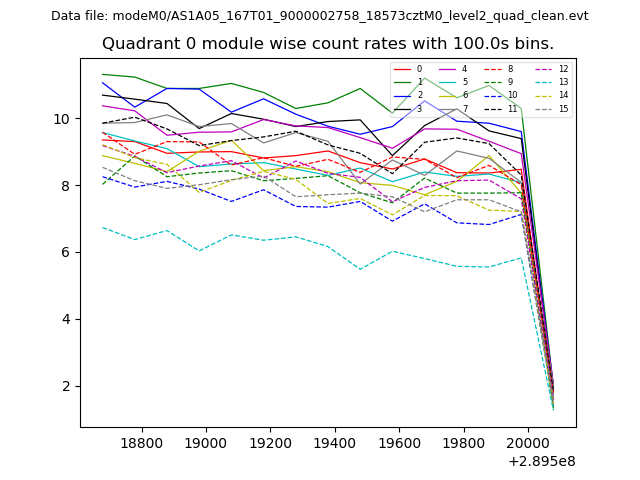 |
 |
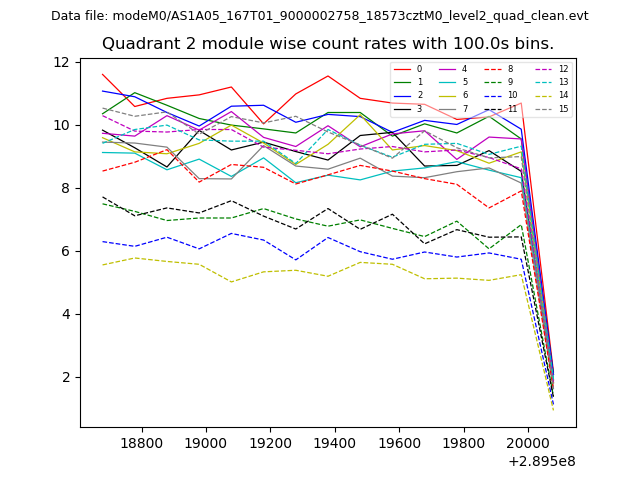
| Module-wise count rates for Quadrant B Data is divided into 100 sec bins |
 |
 |
| Module-wise count rates for Quadrant C Data is divided into 100 sec bins |
 |
 |
| Module-wise count rates for Quadrant D Data is divided into 100 sec bins |
 |
 |
| Parameter | Plot |
|---|---|
| CZT HV Monitor | 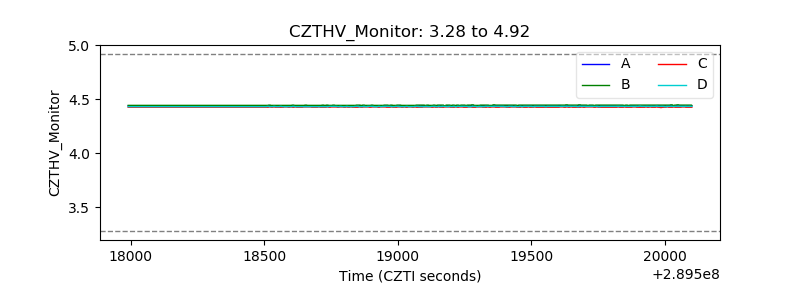 |
| D_VDD | 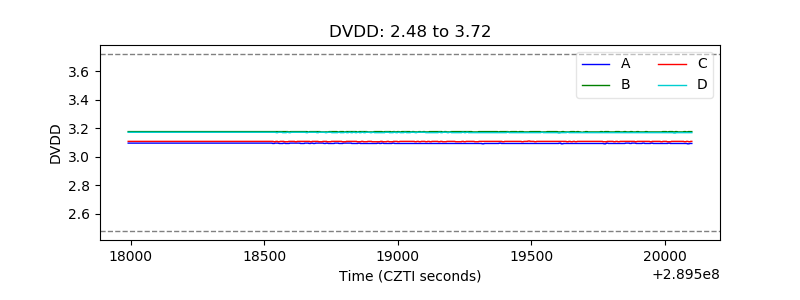 |
| Temperature 1 | 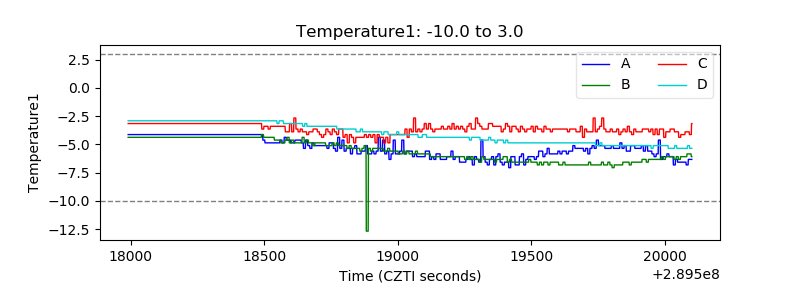 |
| Veto HV Monitor | 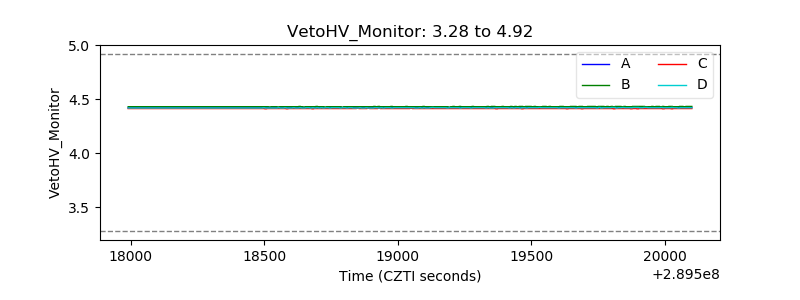 |
| Veto LLD | 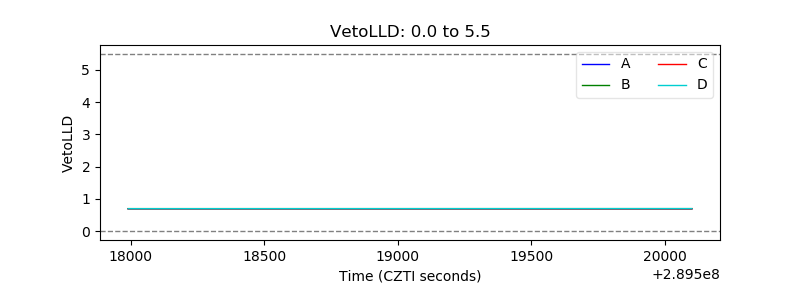 |
| Alpha Counter | 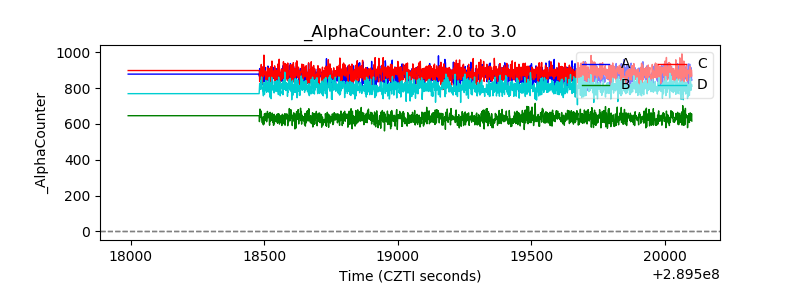 |
| _CPM_Rate | 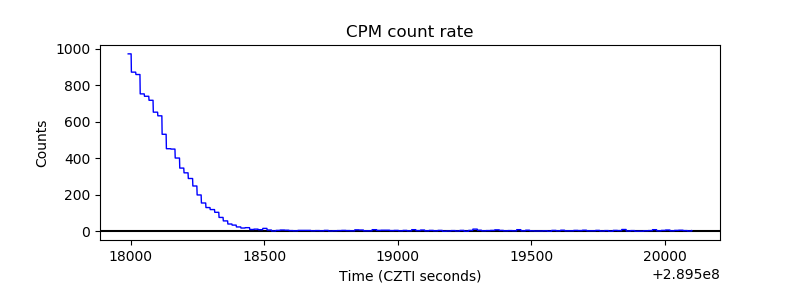 |
| CZT Counter | 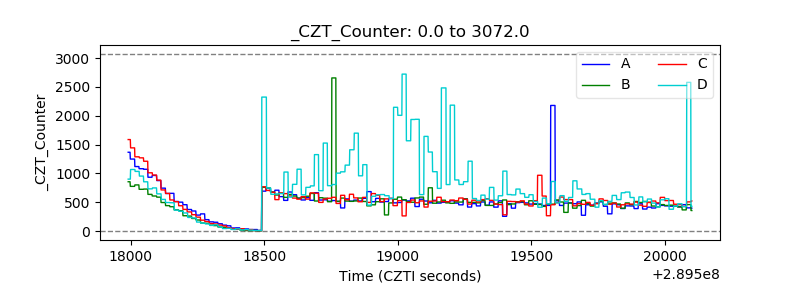 |
| +2.5 Volts monitor |  |
| +5 Volts monitor | 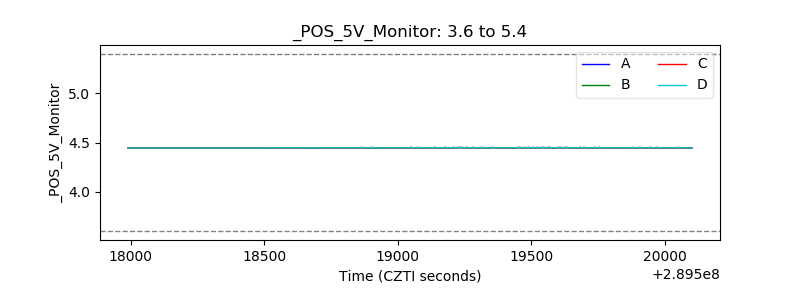 |
| _ROLL_ROT |  |
| _Roll_DEC | 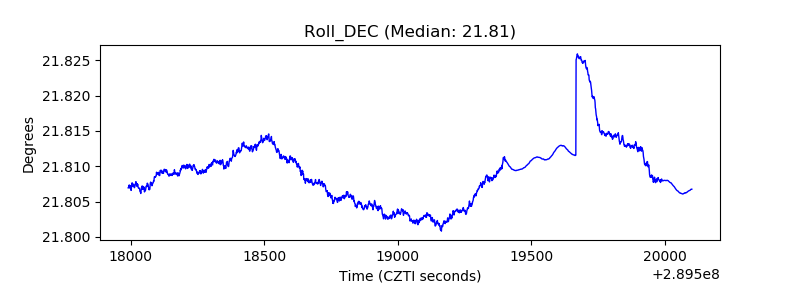 |
| _Roll_RA | 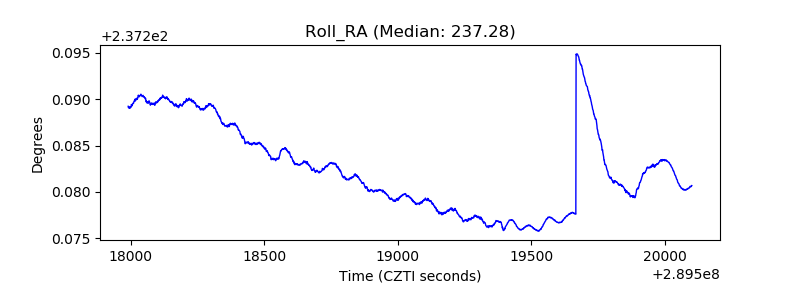 |
| Veto Counter | 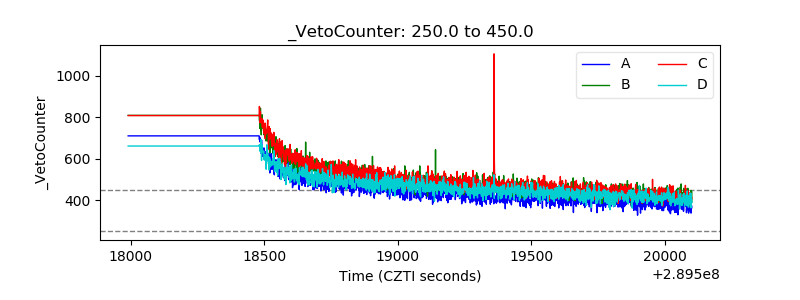 |