| Param | Original file | Final file |
|---|---|---|
| Filename | modeM0/AS1A05_072T02_9000002762cztM0_level2.fits | modeM0/AS1A05_072T02_9000002762cztM0_level2_quad_clean.evt |
| Size (bytes) | 458,766,720 | 375,989,760 |
| Size | 437.5 MB | 358.6 MB |
| Events in quadrant A | 2,829,434 | 2,147,643 |
| Events in quadrant B | 2,755,242 | 2,200,910 |
| Events in quadrant C | 2,817,286 | 2,087,809 |
| Events in quadrant D | 2,437,272 | 1,894,715 |
| Mode SS | |||
|---|---|---|---|
| Quadrant | BADHDUFLAG | Total packets | Discarded packets |
| A | 0 | 906 | 0 |
| B | 0 | 906 | 0 |
| C | 0 | 906 | 0 |
| D | 0 | 906 | 0 |
| Mode M9 | |||
|---|---|---|---|
| Quadrant | BADHDUFLAG | Total packets | Discarded packets |
| A | 0 | 97 | 0 |
| B | 0 | 97 | 0 |
| C | 0 | 97 | 0 |
| D | 0 | 97 | 0 |
| Mode M0 | |||
|---|---|---|---|
| Quadrant | BADHDUFLAG | Total packets | Discarded packets |
| A | 0 | 94750 | 0 |
| B | 0 | 95250 | 0 |
| C | 0 | 101852 | 0 |
| D | 0 | 114746 | 0 |
| Quadrant | Total seconds | Saturated seconds | Saturation percentage |
|---|---|---|---|
| A | 44504 | 407 | 0.914525% |
| B | 44505 | 477 | 1.071790% |
| C | 44505 | 1305 | 2.932255% |
| D | 44505 | 1777 | 3.992810% |
Noise dominated data is calculated using 1-second bins in cleaned event files. If a bin has >2000 counts, and if more than 50% of those come from <1% of pixels, then it is considered to be noise-dominated and hence unusable.
| Quadrant | # 1 sec bins | Bins with >0 counts | Bins with >2000 counts | High rate bins dominated by noise | Noise dominated (total time) | Noise dominated (detector-on time) | Marked lightcurve |
|---|---|---|---|---|---|---|---|
| A | 57498 | 44502 | 0 | 0 | 0.00% | 0.00% |  |
| B | 57498 | 44502 | 0 | 0 | 0.00% | 0.00% |  |
| C | 57498 | 44479 | 0 | 0 | 0.00% | 0.00% | 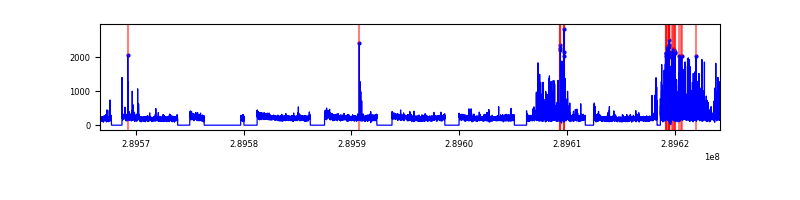 |
| D | 57498 | 44468 | 0 | 0 | 0.00% | 0.00% |  |
Top three noisy pixels from each quadrant. If the there are fewer than three noisy pixels in the level2.evt file, extra rows are filled as -1
| Pixel properties | Quadrant properties | ||||||
|---|---|---|---|---|---|---|---|
| Quadrant | DetID | PixID | Counts | Sigma | Mean | Median | Sigma |
| A | 0 | 29 | 2810 | 11.66 | 737 | 692 | 181.6 |
| A | 7 | 110 | 2296 | 8.83 | 737 | 692 | 181.6 |
| A | 0 | 30 | 2140 | 7.97 | 737 | 692 | 181.6 |
| B | 2 | 9 | 2209 | 10.5 | 727 | 695 | 144.2 |
| B | 2 | 8 | 1906 | 8.4 | 727 | 695 | 144.2 |
| B | 5 | 128 | 1766 | 7.43 | 727 | 695 | 144.2 |
| C | 1 | 80 | 2065 | 7.15 | 743 | 698 | 191.3 |
| C | 1 | 81 | 2042 | 7.03 | 743 | 698 | 191.3 |
| C | 3 | 126 | 1974 | 6.67 | 743 | 698 | 191.3 |
| D | 10 | 190 | 1810 | 6.4 | 694 | 635 | 183.6 |
| D | 6 | 231 | 1805 | 6.37 | 694 | 635 | 183.6 |
| D | 10 | 189 | 1718 | 5.9 | 694 | 635 | 183.6 |
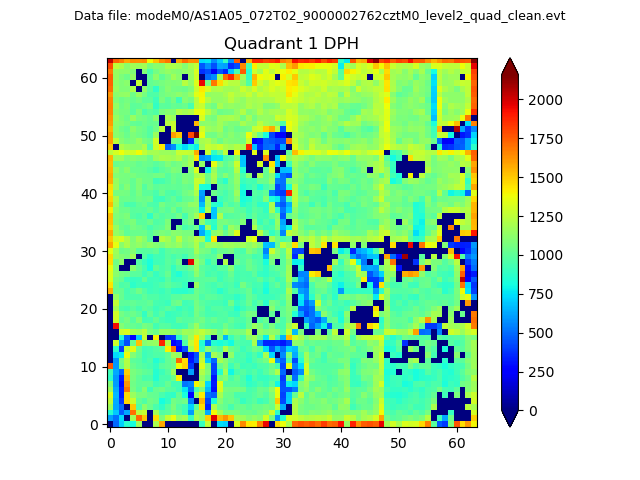
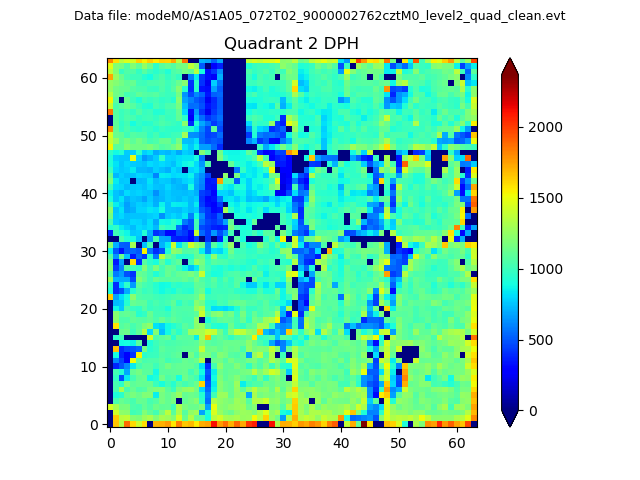
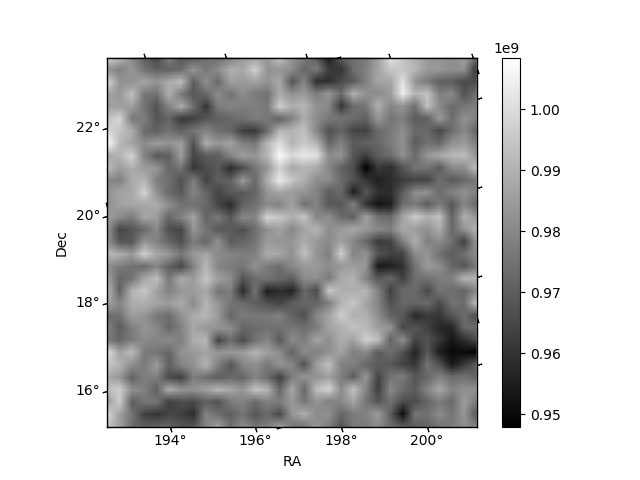
Histogram calculated using DETX and DETY for each event in the final _common_clean file
| Quadrant A |  |
 |
Quadrant B |
|---|---|---|---|
| Quadrant D |  |
 |
Quadrant C |
| Plot type | Count rate plots | Images |
|---|---|---|
| Comparison with Poisson distribution Blue bars denote a histogram of data divided into 1 sec bins. Red curve is a Poisson curve with rate = median count rate of data. |
 |
 |
| Quadrant-wise count rates Data is divided into 100 sec bins |
 |
|
| Module-wise count rates for Quadrant A Data is divided into 100 sec bins |
 |
 |
| Module-wise count rates for Quadrant B Data is divided into 100 sec bins |
 |
 |
| Module-wise count rates for Quadrant C Data is divided into 100 sec bins |
 |
 |
| Module-wise count rates for Quadrant D Data is divided into 100 sec bins |
 |
 |
| Parameter | Plot |
|---|---|
| CZT HV Monitor | 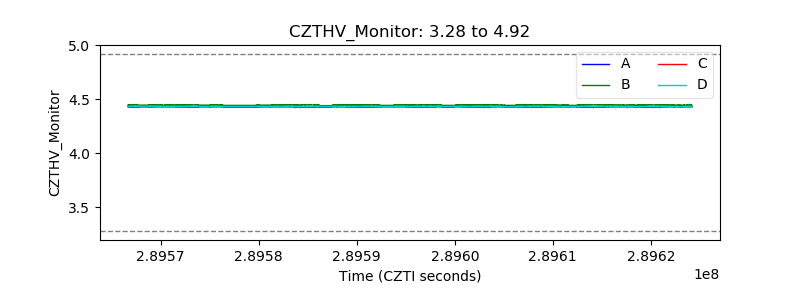 |
| D_VDD |  |
| Temperature 1 |  |
| Veto HV Monitor |  |
| Veto LLD |  |
| Alpha Counter |  |
| _CPM_Rate |  |
| CZT Counter |  |
| +2.5 Volts monitor |  |
| +5 Volts monitor |  |
| _ROLL_ROT |  |
| _Roll_DEC | 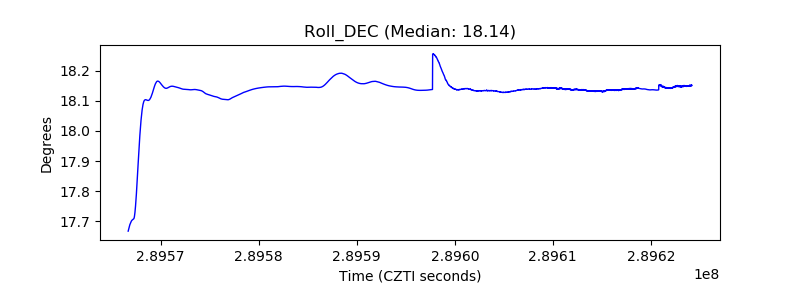 |
| _Roll_RA |  |
| Veto Counter |  |