| Param | Original file | Final file |
|---|---|---|
| Filename | modeM0/AS1A05_072T02_9000002762_18580cztM0_level2.evt | modeM0/AS1A05_072T02_9000002762_18580cztM0_level2_quad_clean.evt |
| Size (bytes) | 192,130,560 | 23,783,040 |
| Size | 183.2 MB | 22.7 MB |
| Events in quadrant A | 1,347,779 | 136,433 |
| Events in quadrant B | 1,343,243 | 137,565 |
| Events in quadrant C | 1,334,570 | 132,381 |
| Events in quadrant D | 1,620,430 | 132,915 |
| Mode SS | |||
|---|---|---|---|
| Quadrant | BADHDUFLAG | Total packets | Discarded packets |
| A | 0 | 52 | 0 |
| B | 0 | 52 | 0 |
| C | 0 | 52 | 0 |
| D | 0 | 52 | 0 |
| Mode M9 | |||
|---|---|---|---|
| Quadrant | BADHDUFLAG | Total packets | Discarded packets |
| A | 0 | 10 | 0 |
| B | 0 | 10 | 0 |
| C | 0 | 10 | 0 |
| D | 0 | 10 | 0 |
| Mode M0 | |||
|---|---|---|---|
| Quadrant | BADHDUFLAG | Total packets | Discarded packets |
| A | 0 | 5556 | 1 |
| B | 0 | 5526 | 1 |
| C | 0 | 5496 | 1 |
| D | 0 | 6488 | 1 |
| Quadrant | Total seconds | Saturated seconds | Saturation percentage |
|---|---|---|---|
| A | 2510 | 104 | 4.143426% |
| B | 2510 | 61 | 2.430279% |
| C | 2510 | 56 | 2.231076% |
| D | 2510 | 146 | 5.816733% |
Noise dominated data is calculated using 1-second bins in cleaned event files. If a bin has >2000 counts, and if more than 50% of those come from <1% of pixels, then it is considered to be noise-dominated and hence unusable.
| Quadrant | # 1 sec bins | Bins with >0 counts | Bins with >2000 counts | High rate bins dominated by noise | Noise dominated (total time) | Noise dominated (detector-on time) | Marked lightcurve |
|---|---|---|---|---|---|---|---|
| A | 3490 | 2510 | 0 | 0 | 0.00% | 0.00% | 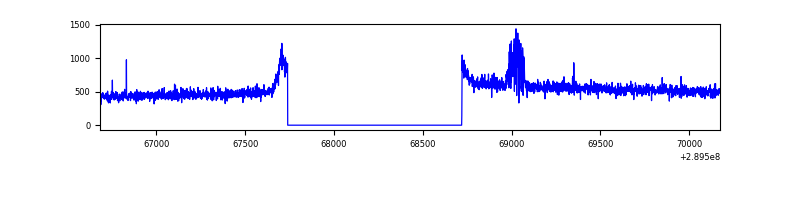 |
| B | 3490 | 2510 | 2 | 2 | 0.06% | 0.08% | 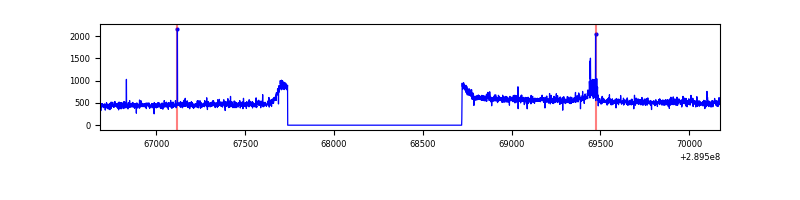 |
| C | 3490 | 2510 | 1 | 1 | 0.03% | 0.04% | 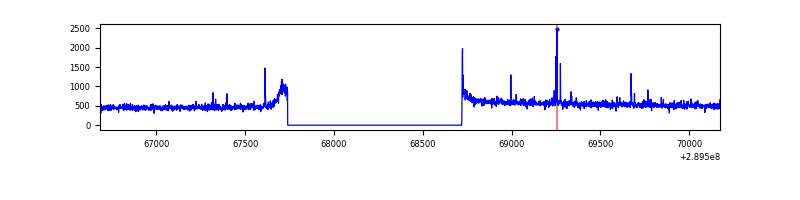 |
| D | 3490 | 2510 | 86 | 86 | 2.46% | 3.43% | 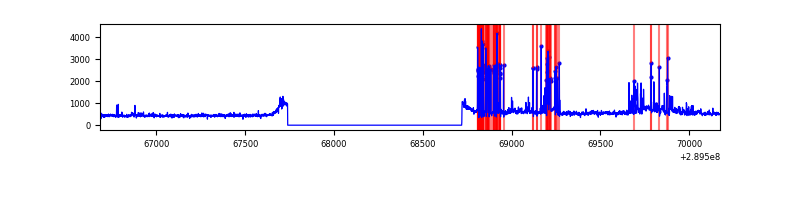 |
Top three noisy pixels from each quadrant. If the there are fewer than three noisy pixels in the level2.evt file, extra rows are filled as -1
| Pixel properties | Quadrant properties | ||||||
|---|---|---|---|---|---|---|---|
| Quadrant | DetID | PixID | Counts | Sigma | Mean | Median | Sigma |
| A | 14 | 111 | 43028 | 607.84 | 338 | 330 | 70.2 |
| A | 13 | 254 | 3680 | 47.69 | 338 | 330 | 70.2 |
| A | 0 | 226 | 2962 | 37.47 | 338 | 330 | 70.2 |
| B | 0 | 190 | 16067 | 232.13 | 337 | 328 | 67.8 |
| B | 0 | 198 | 8174 | 115.72 | 337 | 328 | 67.8 |
| B | 12 | 111 | 7592 | 107.14 | 337 | 328 | 67.8 |
| C | 14 | 238 | 49806 | 640.93 | 323 | 325 | 77.2 |
| C | 4 | 254 | 18494 | 235.34 | 323 | 325 | 77.2 |
| C | 9 | 54 | 3664 | 43.25 | 323 | 325 | 77.2 |
| D | 1 | 52 | 325326 | 4123.88 | 323 | 313 | 78.8 |
| D | 7 | 238 | 29657 | 372.33 | 323 | 313 | 78.8 |
| D | 10 | 50 | 27638 | 346.71 | 323 | 313 | 78.8 |
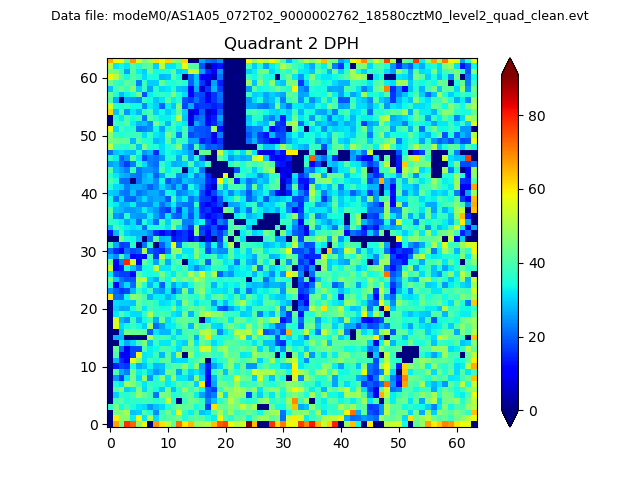
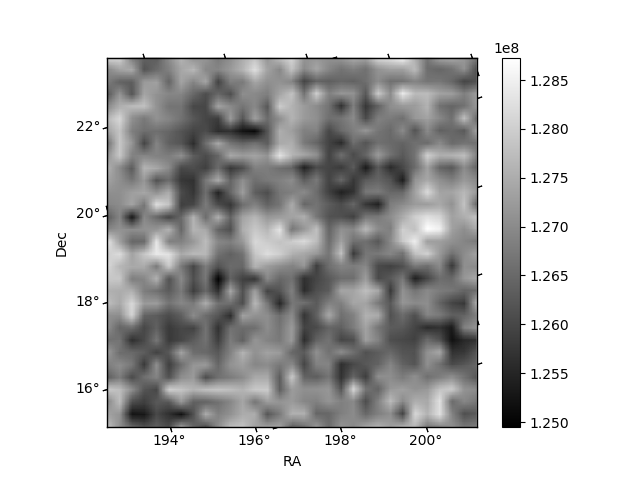
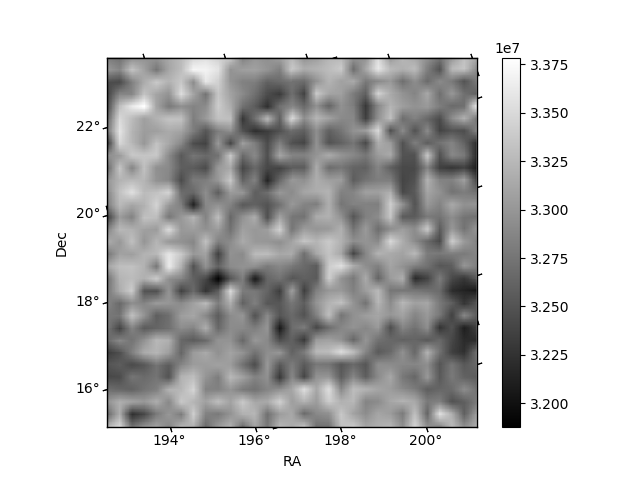
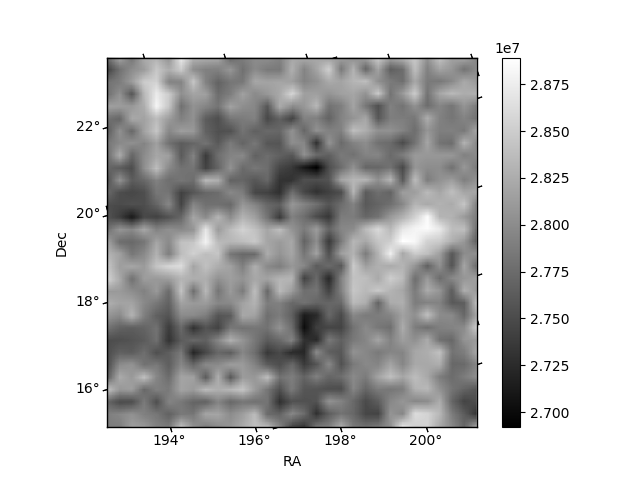
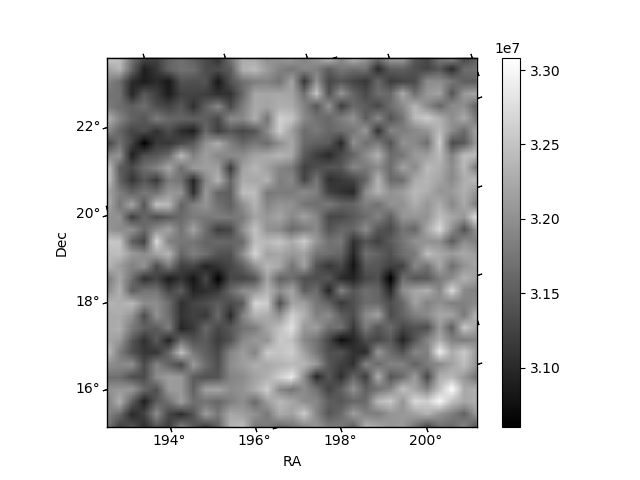
Histogram calculated using DETX and DETY for each event in the final _common_clean file
| Quadrant A | 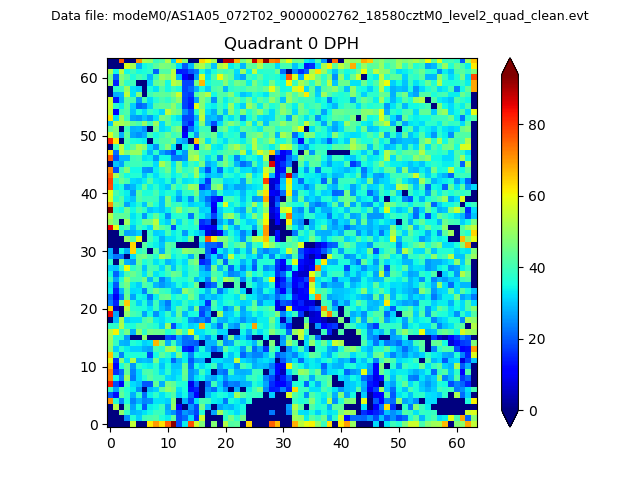 |
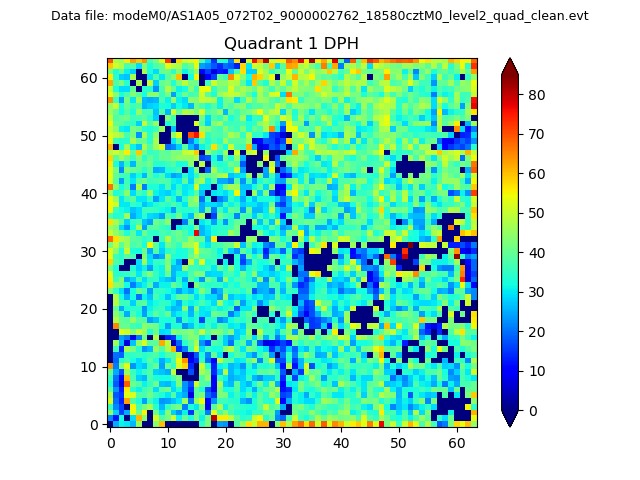 |
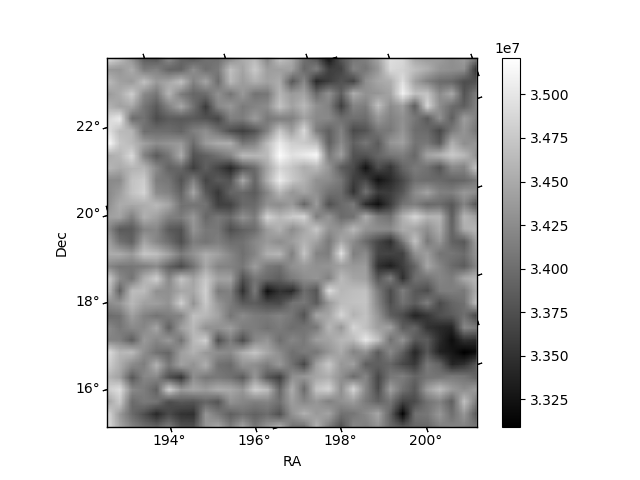
Quadrant B |
|---|---|---|---|
| Quadrant D | 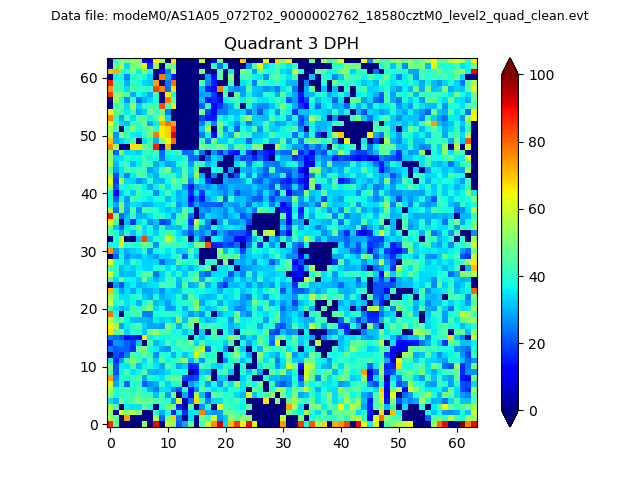 |
 |
Quadrant C |
| Plot type | Count rate plots | Images |
|---|---|---|
| Comparison with Poisson distribution Blue bars denote a histogram of data divided into 1 sec bins. Red curve is a Poisson curve with rate = median count rate of data. |
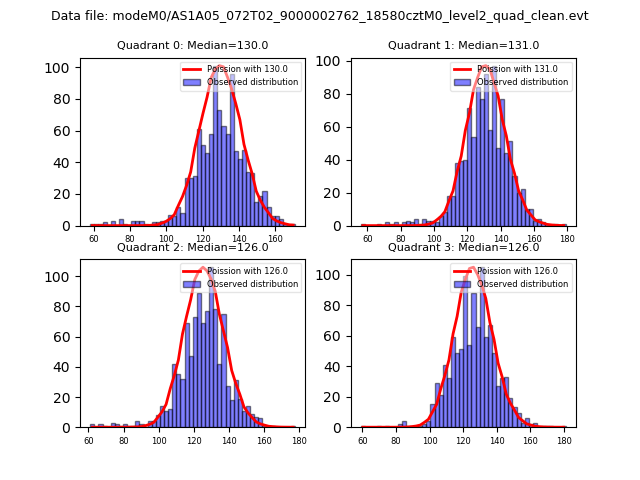 |
 |
| Quadrant-wise count rates Data is divided into 100 sec bins |
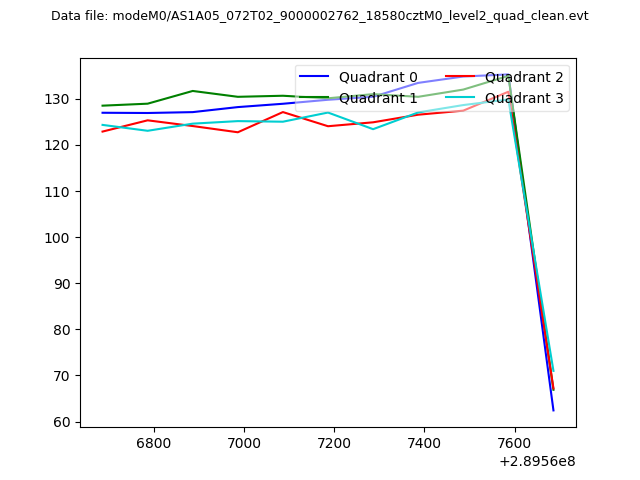 |
|
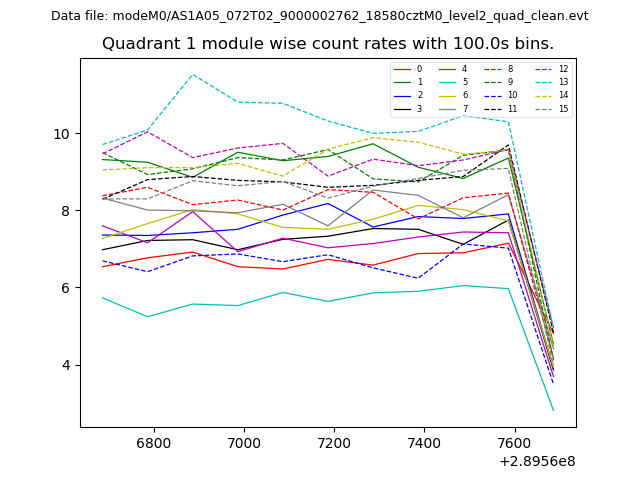
| Module-wise count rates for Quadrant A Data is divided into 100 sec bins |
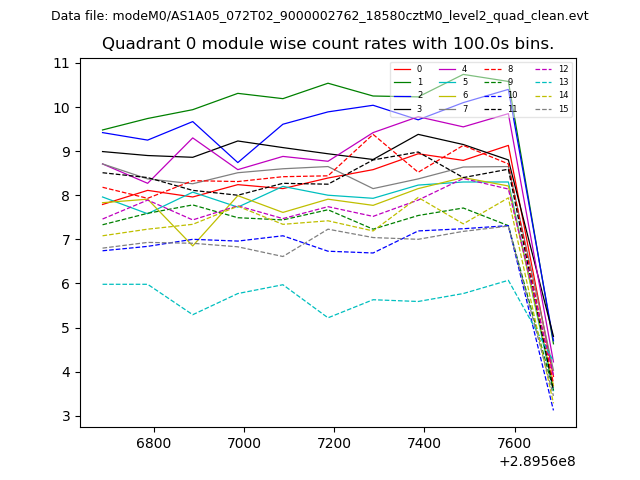 |
 |
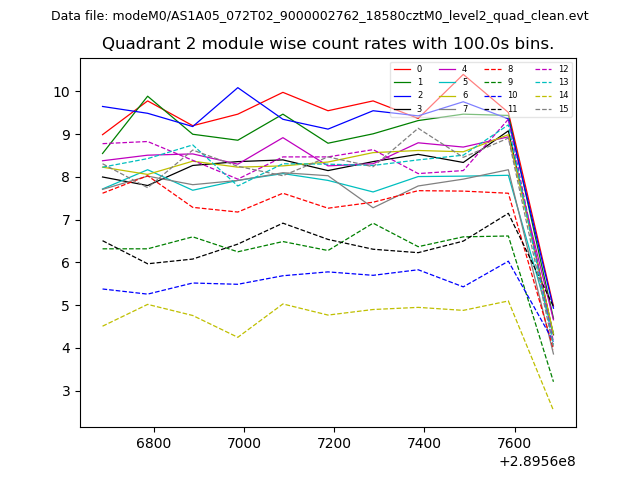
| Module-wise count rates for Quadrant B Data is divided into 100 sec bins |
 |
 |
| Module-wise count rates for Quadrant C Data is divided into 100 sec bins |
 |
 |
| Module-wise count rates for Quadrant D Data is divided into 100 sec bins |
 |
 |
| Parameter | Plot |
|---|---|
| CZT HV Monitor |  |
| D_VDD | 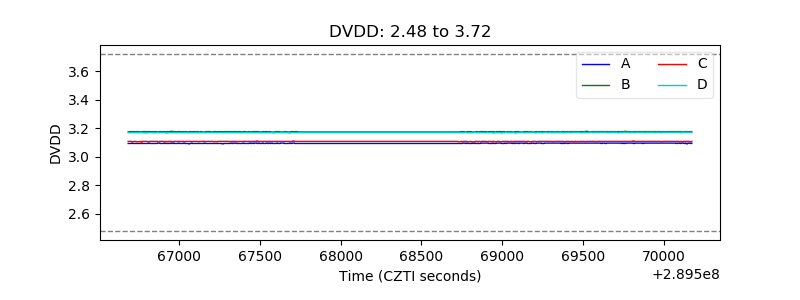 |
| Temperature 1 | 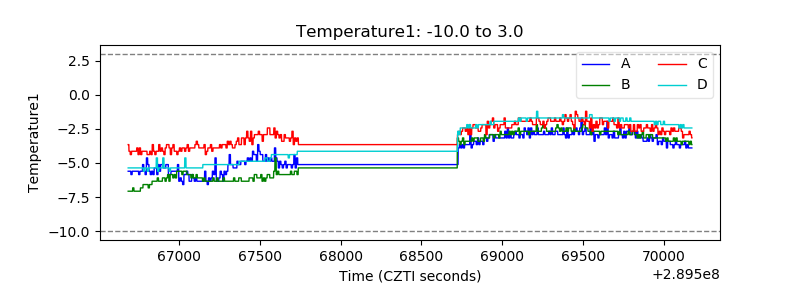 |
| Veto HV Monitor | 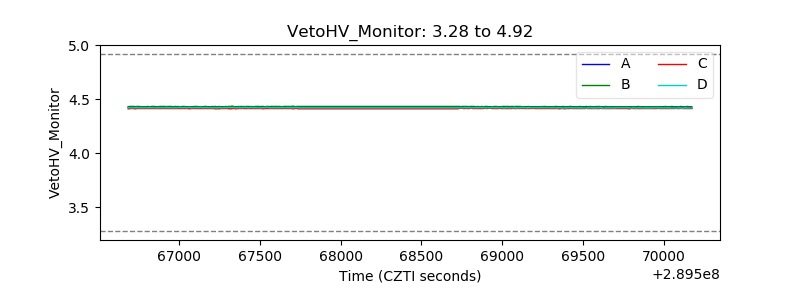 |
| Veto LLD | 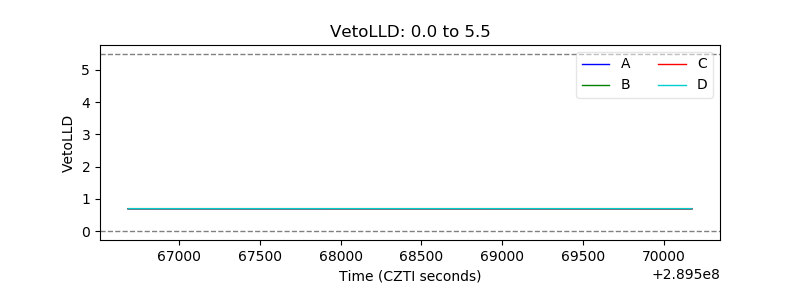 |
| Alpha Counter | 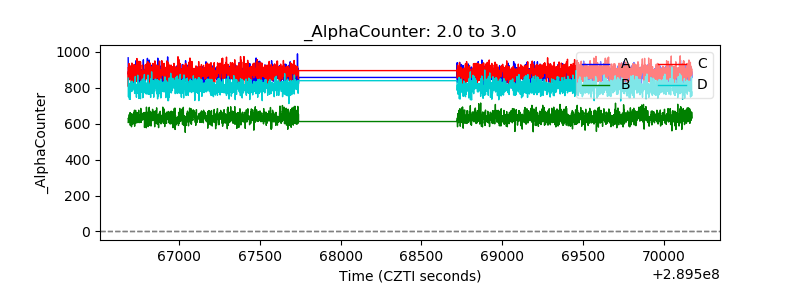 |
| _CPM_Rate | 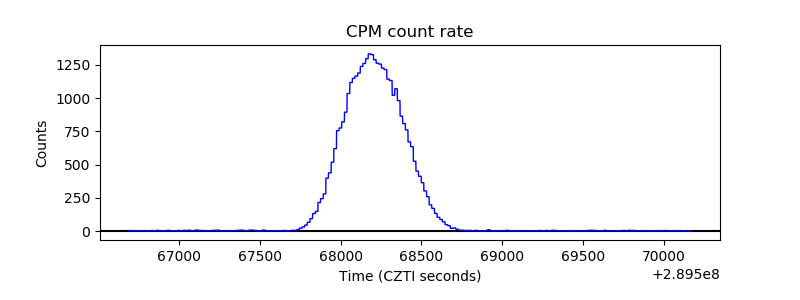 |
| CZT Counter | 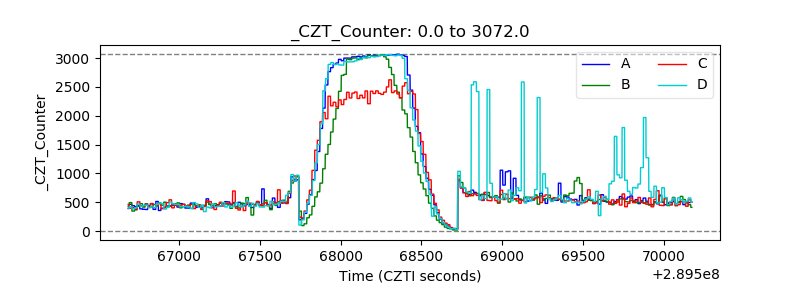 |
| +2.5 Volts monitor |  |
| +5 Volts monitor |  |
| _ROLL_ROT |  |
| _Roll_DEC |  |
| _Roll_RA | 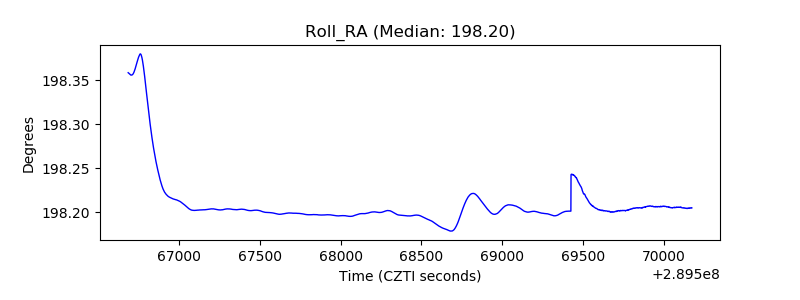 |
| Veto Counter | 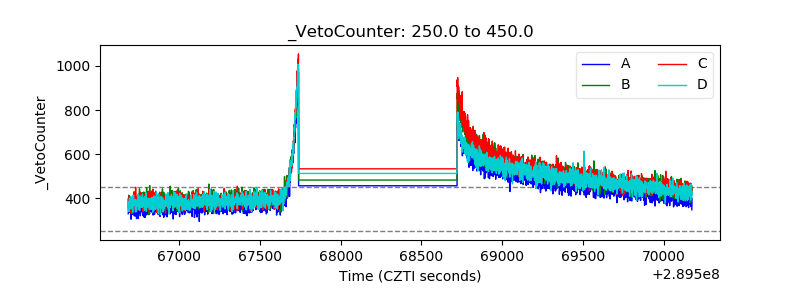 |