| Param | Original file | Final file |
|---|---|---|
| Filename | modeM0/AS1A05_072T02_9000002762_18582cztM0_level2.evt | modeM0/AS1A05_072T02_9000002762_18582cztM0_level2_quad_clean.evt |
| Size (bytes) | 473,241,600 | 69,203,520 |
| Size | 451.3 MB | 66.0 MB |
| Events in quadrant A | 3,323,125 | 413,691 |
| Events in quadrant B | 3,365,600 | 419,340 |
| Events in quadrant C | 3,367,609 | 405,774 |
| Events in quadrant D | 3,834,950 | 403,850 |
| Mode SS | |||
|---|---|---|---|
| Quadrant | BADHDUFLAG | Total packets | Discarded packets |
| A | 0 | 130 | 0 |
| B | 0 | 130 | 0 |
| C | 0 | 130 | 0 |
| D | 0 | 130 | 0 |
| Mode M9 | |||
|---|---|---|---|
| Quadrant | BADHDUFLAG | Total packets | Discarded packets |
| A | 0 | 17 | 0 |
| B | 0 | 18 | 0 |
| C | 0 | 18 | 0 |
| D | 0 | 18 | 0 |
| Mode M0 | |||
|---|---|---|---|
| Quadrant | BADHDUFLAG | Total packets | Discarded packets |
| A | 0 | 14147 | 2 |
| B | 0 | 14182 | 2 |
| C | 0 | 14111 | 2 |
| D | 0 | 15875 | 2 |
| Quadrant | Total seconds | Saturated seconds | Saturation percentage |
|---|---|---|---|
| A | 6496 | 100 | 1.539409% |
| B | 6496 | 67 | 1.031404% |
| C | 6496 | 98 | 1.508621% |
| D | 6496 | 192 | 2.955665% |
Noise dominated data is calculated using 1-second bins in cleaned event files. If a bin has >2000 counts, and if more than 50% of those come from <1% of pixels, then it is considered to be noise-dominated and hence unusable.
| Quadrant | # 1 sec bins | Bins with >0 counts | Bins with >2000 counts | High rate bins dominated by noise | Noise dominated (total time) | Noise dominated (detector-on time) | Marked lightcurve |
|---|---|---|---|---|---|---|---|
| A | 7626 | 6496 | 0 | 0 | 0.00% | 0.00% | 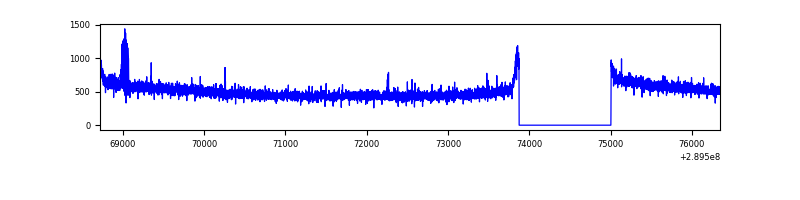 |
| B | 7626 | 6496 | 1 | 1 | 0.01% | 0.02% | 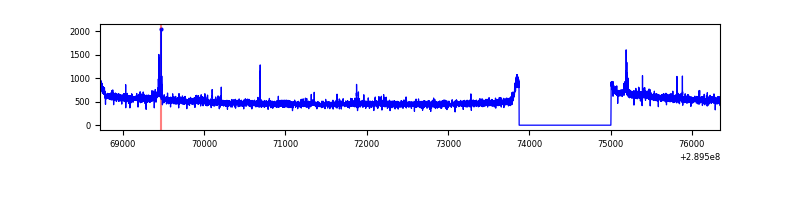 |
| C | 7626 | 6496 | 1 | 1 | 0.01% | 0.02% | 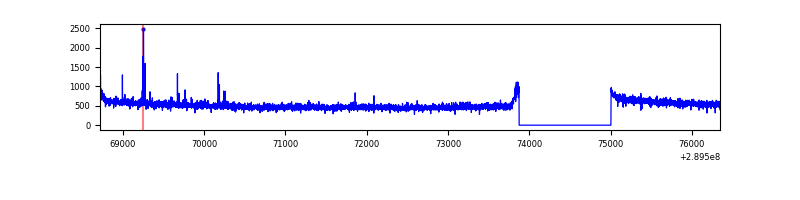 |
| D | 7626 | 6496 | 116 | 116 | 1.52% | 1.79% | 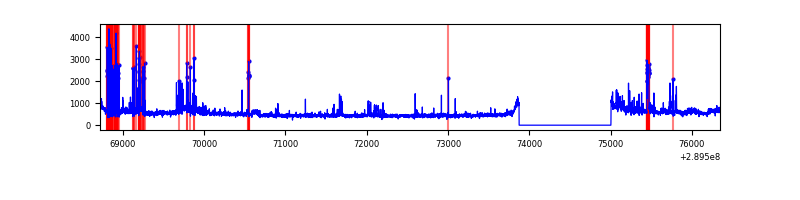 |
Top three noisy pixels from each quadrant. If the there are fewer than three noisy pixels in the level2.evt file, extra rows are filled as -1
| Pixel properties | Quadrant properties | ||||||
|---|---|---|---|---|---|---|---|
| Quadrant | DetID | PixID | Counts | Sigma | Mean | Median | Sigma |
| A | 14 | 111 | 48674 | 279.08 | 850 | 831 | 171.4 |
| A | 13 | 254 | 9710 | 51.79 | 850 | 831 | 171.4 |
| A | 0 | 226 | 7356 | 38.06 | 850 | 831 | 171.4 |
| B | 0 | 190 | 35260 | 213.19 | 848 | 828 | 161.5 |
| B | 12 | 111 | 19006 | 112.55 | 848 | 828 | 161.5 |
| B | 11 | 111 | 16925 | 99.66 | 848 | 828 | 161.5 |
| C | 14 | 238 | 130061 | 676.85 | 821 | 828 | 190.9 |
| C | 4 | 254 | 28440 | 144.62 | 821 | 828 | 190.9 |
| C | 13 | 61 | 5799 | 26.04 | 821 | 828 | 190.9 |
| D | 1 | 52 | 473486 | 2361.31 | 824 | 801 | 200.2 |
| D | 7 | 238 | 126488 | 627.87 | 824 | 801 | 200.2 |
| D | 10 | 50 | 93546 | 463.31 | 824 | 801 | 200.2 |
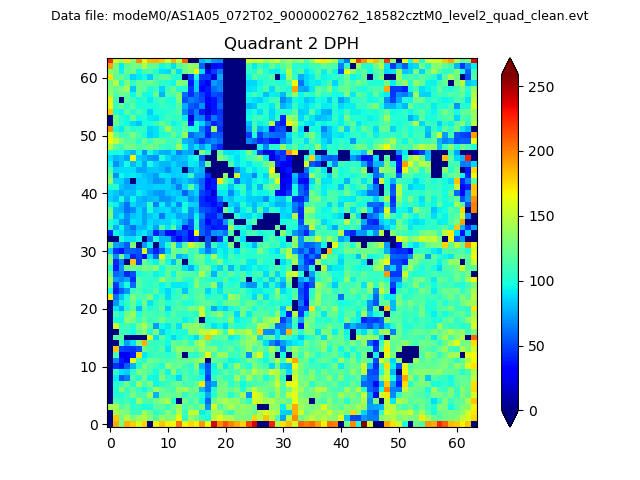
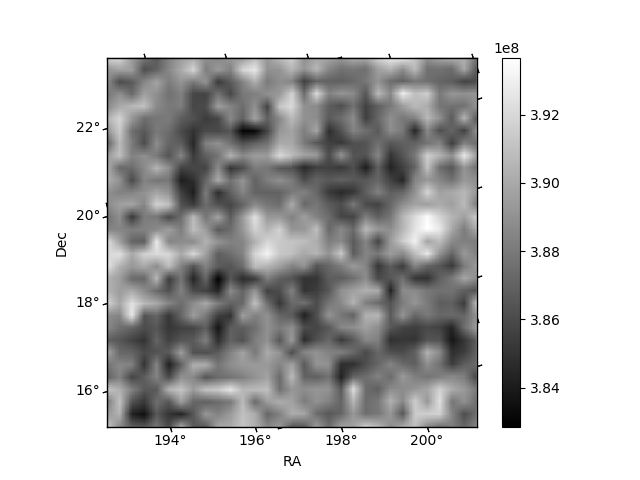
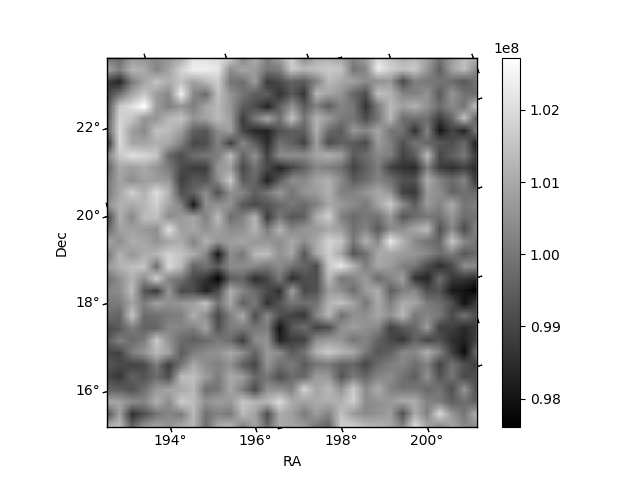
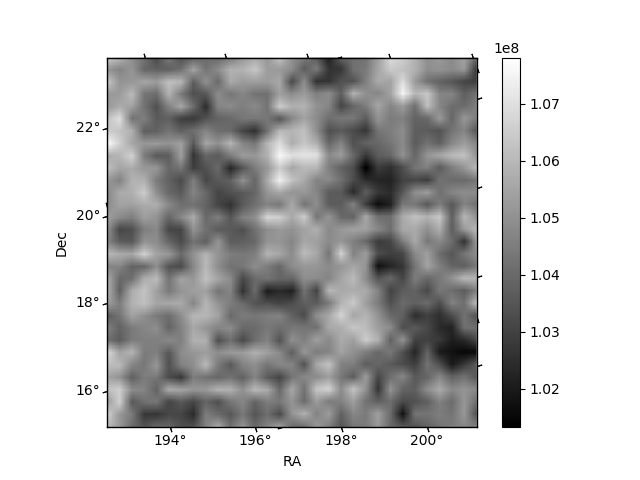
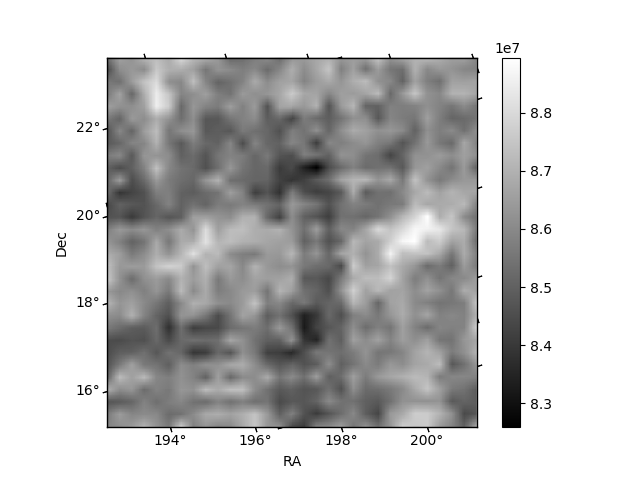
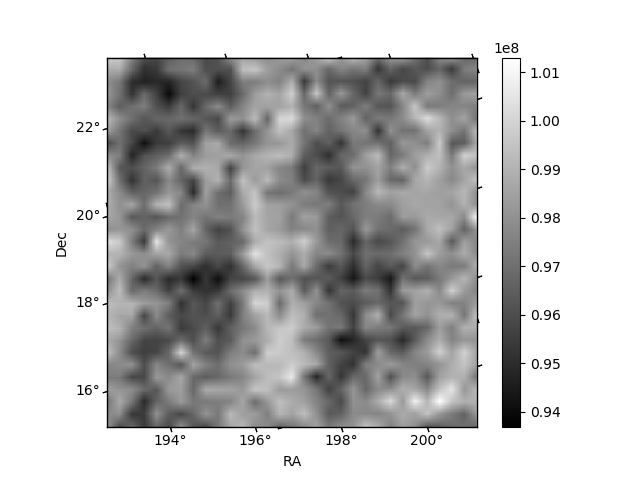
Histogram calculated using DETX and DETY for each event in the final _common_clean file
| Quadrant A | 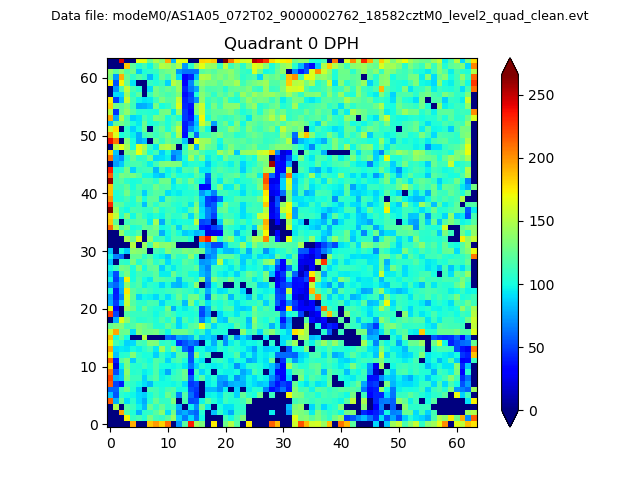 |
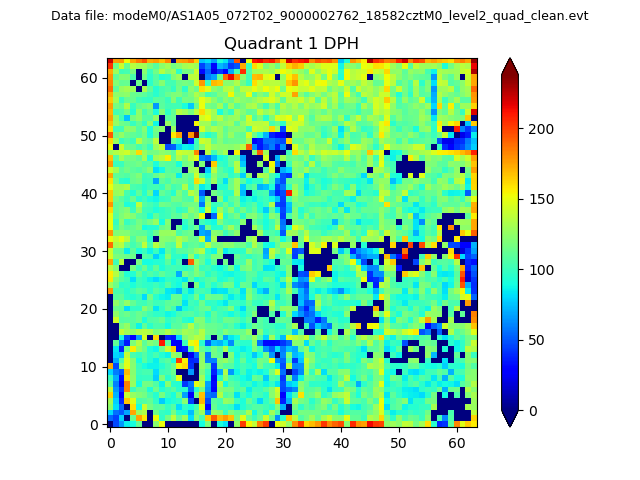 |
Quadrant B |
|---|---|---|---|
| Quadrant D | 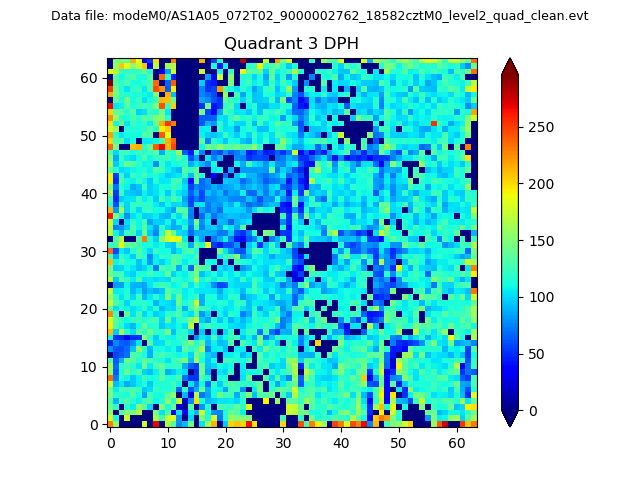 |
 |
Quadrant C |
| Plot type | Count rate plots | Images |
|---|---|---|
| Comparison with Poisson distribution Blue bars denote a histogram of data divided into 1 sec bins. Red curve is a Poisson curve with rate = median count rate of data. |
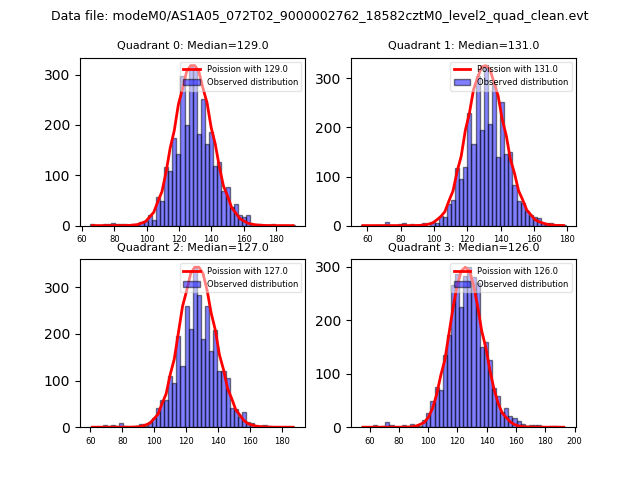 |
 |
| Quadrant-wise count rates Data is divided into 100 sec bins |
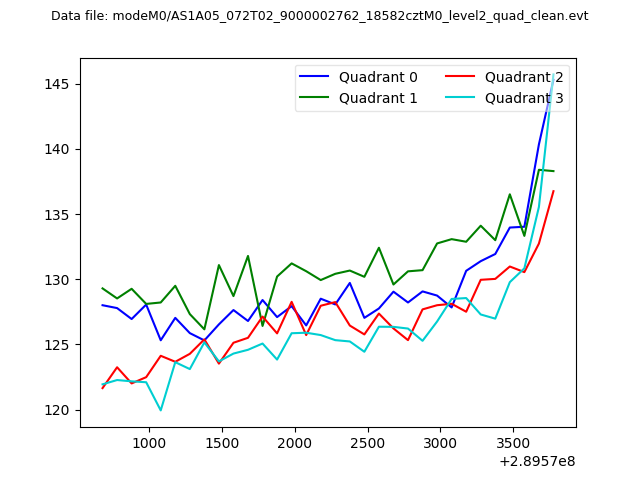 |
|
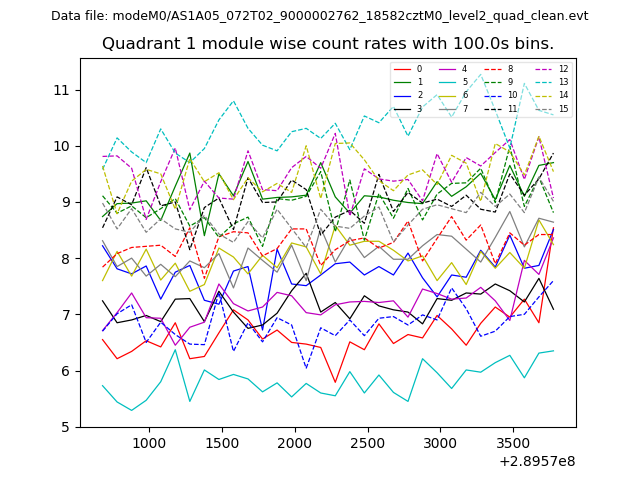
| Module-wise count rates for Quadrant A Data is divided into 100 sec bins |
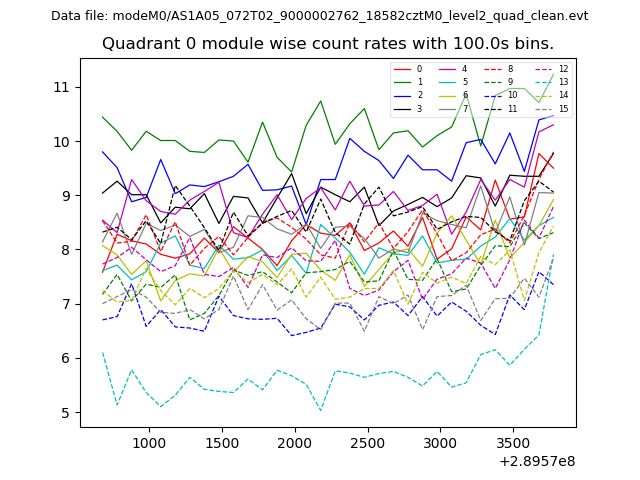 |
 |
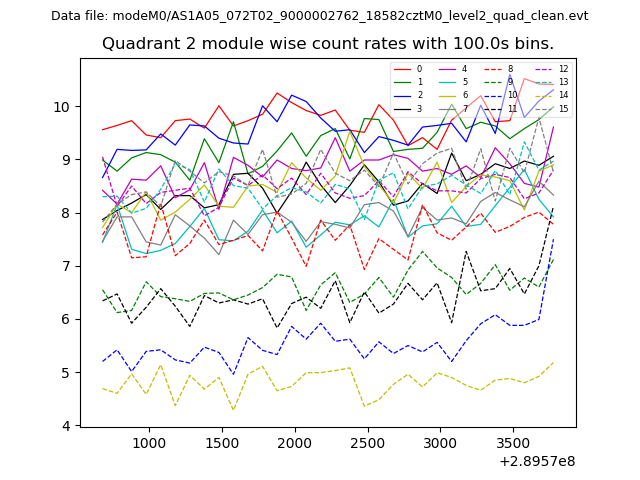
| Module-wise count rates for Quadrant B Data is divided into 100 sec bins |
 |
 |
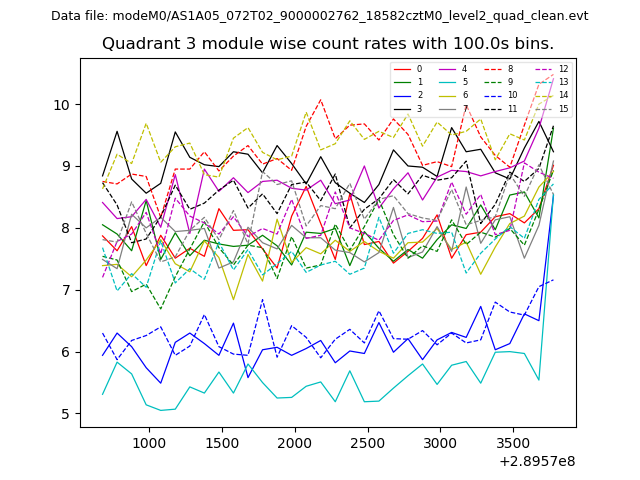
| Module-wise count rates for Quadrant C Data is divided into 100 sec bins |
 |
 |
| Module-wise count rates for Quadrant D Data is divided into 100 sec bins |
 |
 |
| Parameter | Plot |
|---|---|
| CZT HV Monitor | 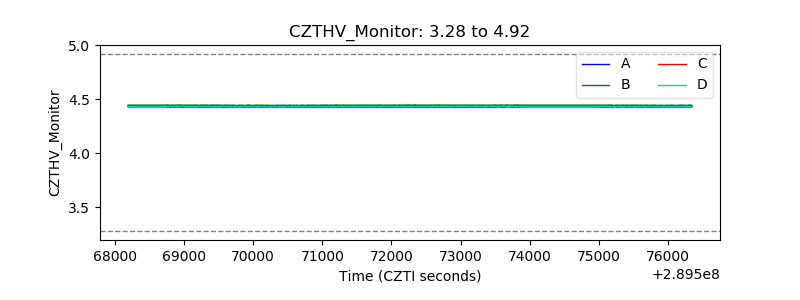 |
| D_VDD | 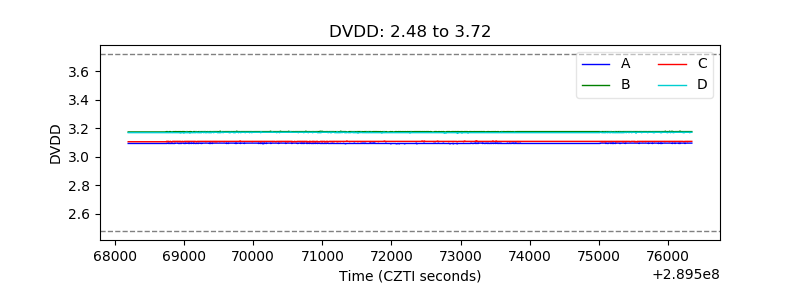 |
| Temperature 1 | 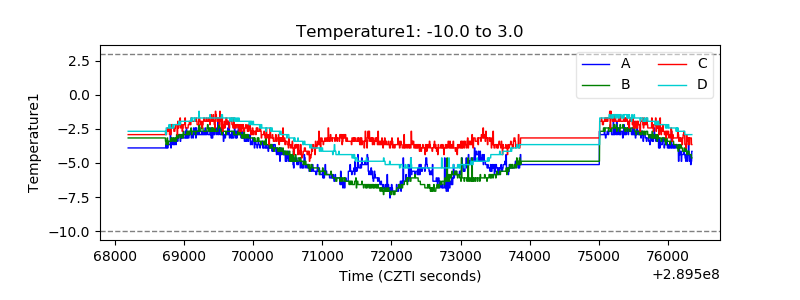 |
| Veto HV Monitor | 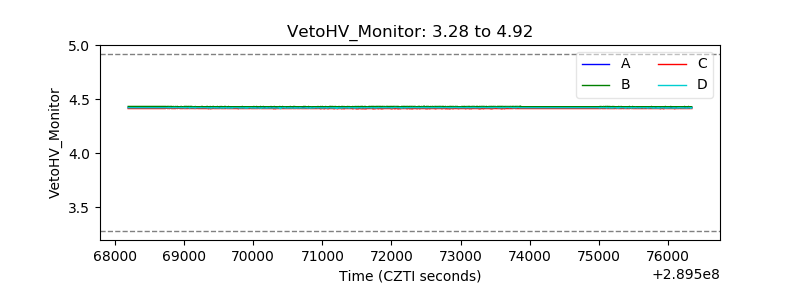 |
| Veto LLD | 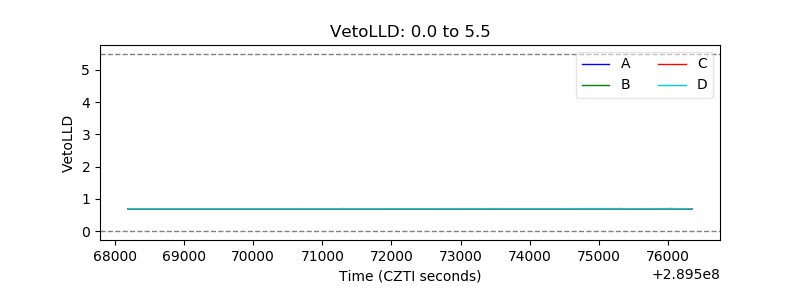 |
| Alpha Counter | 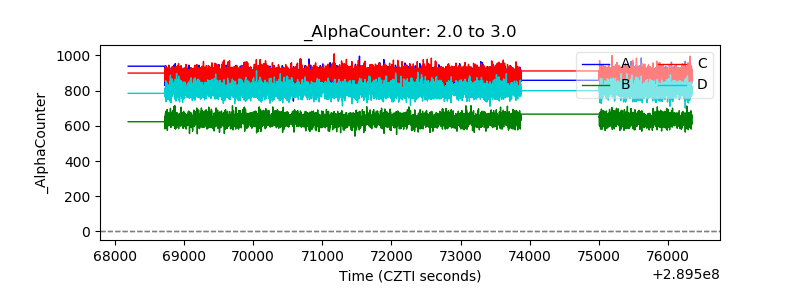 |
| _CPM_Rate | 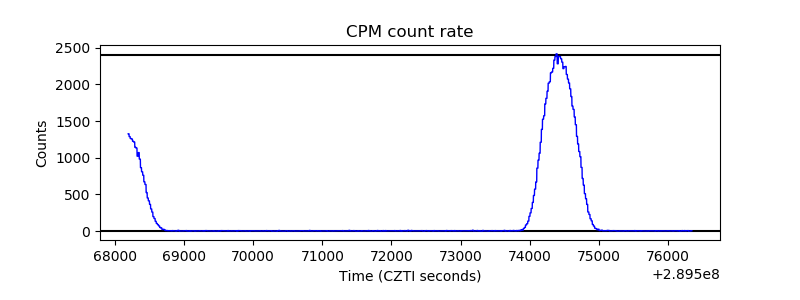 |
| CZT Counter | 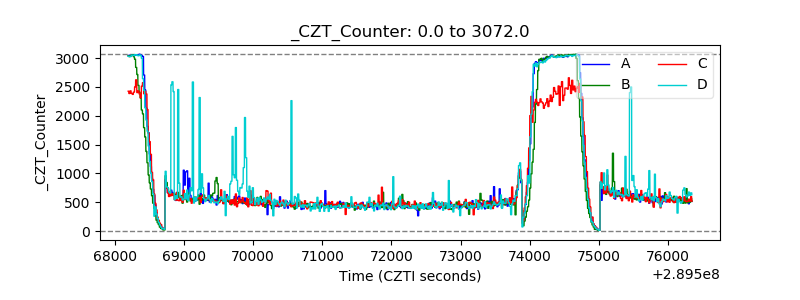 |
| +2.5 Volts monitor |  |
| +5 Volts monitor |  |
| _ROLL_ROT | 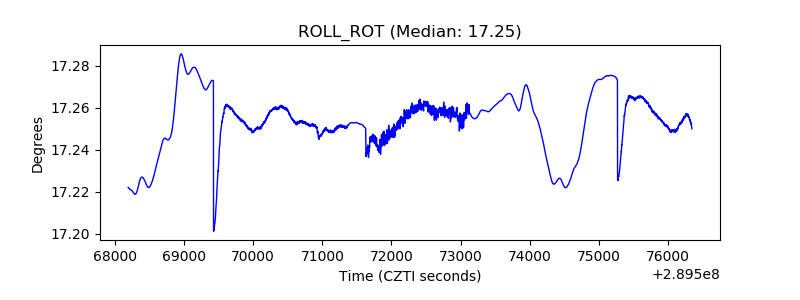 |
| _Roll_DEC | 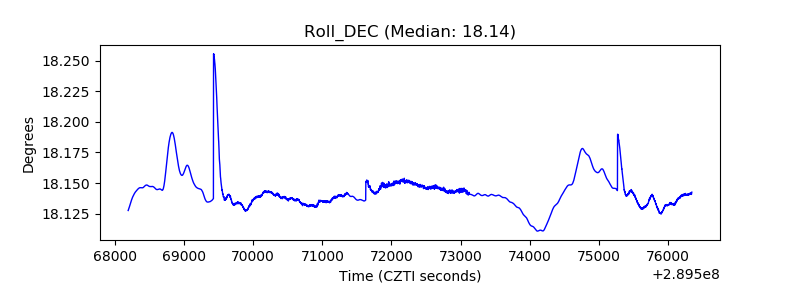 |
| _Roll_RA | 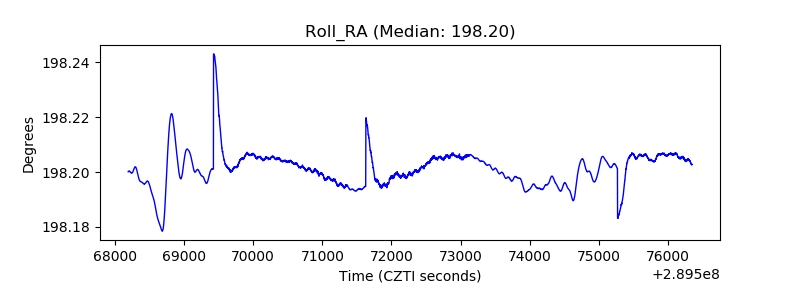 |
| Veto Counter | 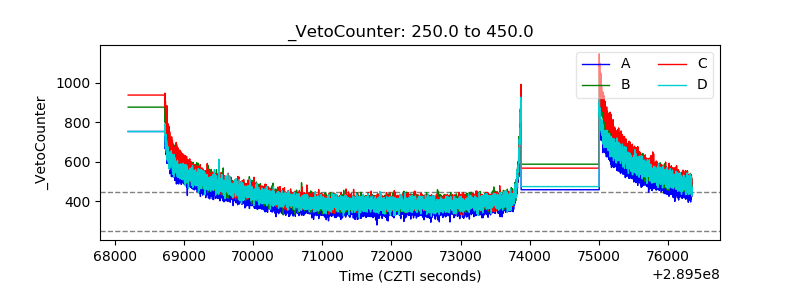 |