| Param | Original file | Final file |
|---|---|---|
| Filename | modeM0/AS1A05_072T02_9000002762_18585cztM0_level2.evt | modeM0/AS1A05_072T02_9000002762_18585cztM0_level2_quad_clean.evt |
| Size (bytes) | 459,705,600 | 162,915,840 |
| Size | 438.4 MB | 155.4 MB |
| Events in quadrant A | 3,287,236 | 1,075,052 |
| Events in quadrant B | 3,296,513 | 1,081,989 |
| Events in quadrant C | 3,380,149 | 1,072,926 |
| Events in quadrant D | 3,543,745 | 1,278,856 |
| Mode SS | |||
|---|---|---|---|
| Quadrant | BADHDUFLAG | Total packets | Discarded packets |
| A | 0 | 124 | 0 |
| B | 0 | 124 | 0 |
| C | 0 | 124 | 0 |
| D | 0 | 124 | 0 |
| Mode M9 | |||
|---|---|---|---|
| Quadrant | BADHDUFLAG | Total packets | Discarded packets |
| A | 0 | 14 | 0 |
| B | 0 | 14 | 0 |
| C | 0 | 14 | 0 |
| D | 0 | 14 | 0 |
| Mode M0 | |||
|---|---|---|---|
| Quadrant | BADHDUFLAG | Total packets | Discarded packets |
| A | 0 | 13566 | 3 |
| B | 0 | 13696 | 2 |
| C | 0 | 13950 | 2 |
| D | 0 | 14524 | 2 |
| Quadrant | Total seconds | Saturated seconds | Saturation percentage |
|---|---|---|---|
| A | 6107 | 38 | 0.622237% |
| B | 6107 | 49 | 0.802358% |
| C | 6108 | 91 | 1.489849% |
| D | 6108 | 120 | 1.964637% |
Noise dominated data is calculated using 1-second bins in cleaned event files. If a bin has >2000 counts, and if more than 50% of those come from <1% of pixels, then it is considered to be noise-dominated and hence unusable.
| Quadrant | # 1 sec bins | Bins with >0 counts | Bins with >2000 counts | High rate bins dominated by noise | Noise dominated (total time) | Noise dominated (detector-on time) | Marked lightcurve |
|---|---|---|---|---|---|---|---|
| A | 7512 | 6108 | 0 | 0 | 0.00% | 0.00% | 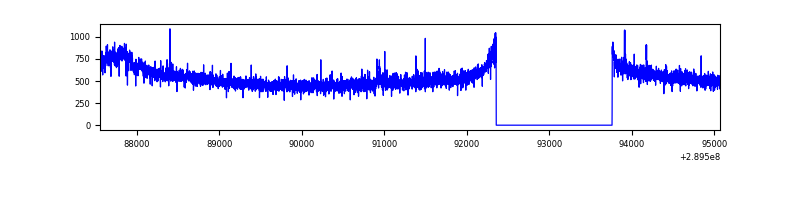 |
| B | 7512 | 6108 | 0 | 0 | 0.00% | 0.00% | 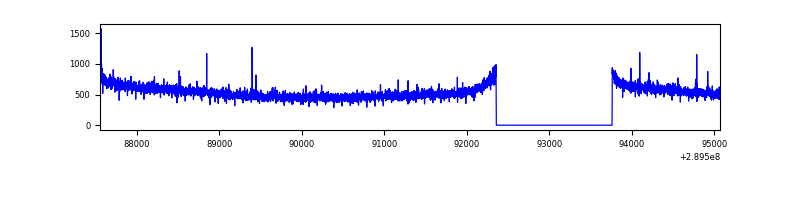 |
| C | 7513 | 6109 | 1 | 1 | 0.01% | 0.02% | 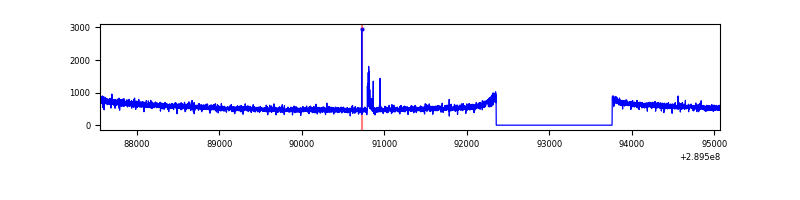 |
| D | 7513 | 6109 | 48 | 48 | 0.64% | 0.79% | 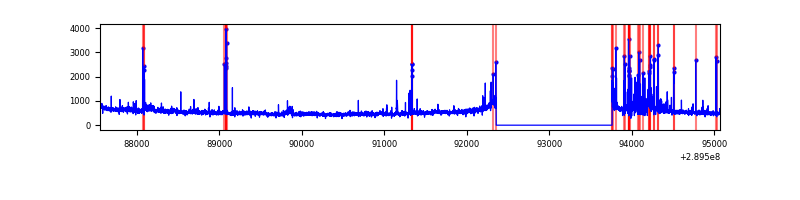 |
Top three noisy pixels from each quadrant. If the there are fewer than three noisy pixels in the level2.evt file, extra rows are filled as -1
| Pixel properties | Quadrant properties | ||||||
|---|---|---|---|---|---|---|---|
| Quadrant | DetID | PixID | Counts | Sigma | Mean | Median | Sigma |
| A | 13 | 210 | 43061 | 251.86 | 832 | 818 | 167.7 |
| A | 3 | 254 | 24839 | 143.22 | 832 | 818 | 167.7 |
| A | 13 | 254 | 10157 | 55.68 | 832 | 818 | 167.7 |
| B | 12 | 111 | 18276 | 110.91 | 841 | 822 | 157.4 |
| B | 11 | 111 | 15675 | 94.38 | 841 | 822 | 157.4 |
| B | 14 | 111 | 13575 | 81.04 | 841 | 822 | 157.4 |
| C | 14 | 238 | 129119 | 671.63 | 826 | 835 | 191.0 |
| C | 9 | 54 | 26559 | 134.68 | 826 | 835 | 191.0 |
| C | 13 | 61 | 5676 | 25.34 | 826 | 835 | 191.0 |
| D | 1 | 52 | 396499 | 1981.47 | 822 | 800 | 199.7 |
| D | 7 | 238 | 27982 | 136.11 | 822 | 800 | 199.7 |
| D | 2 | 234 | 24981 | 121.08 | 822 | 800 | 199.7 |
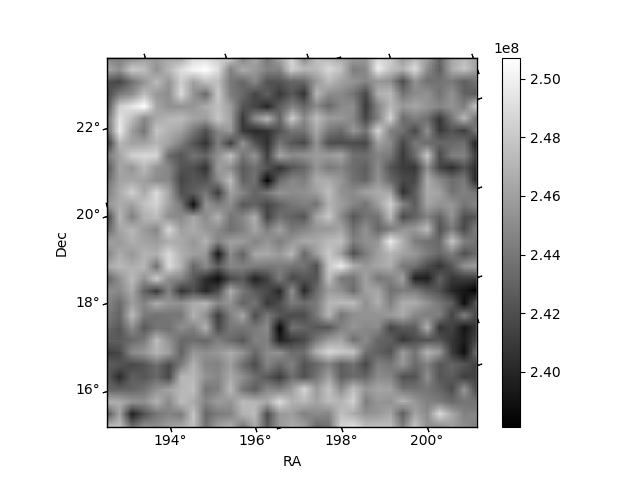
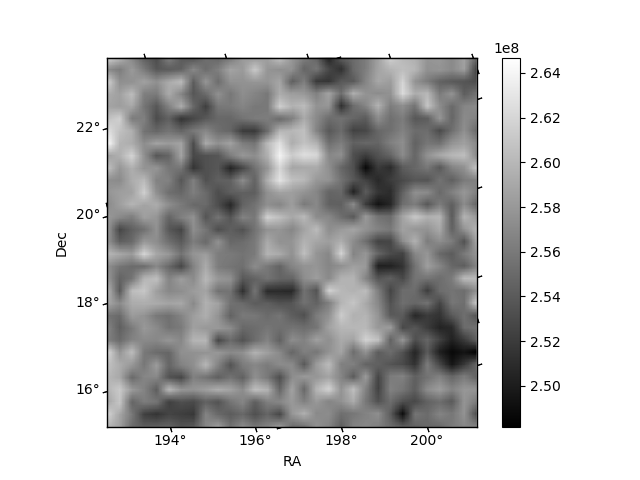
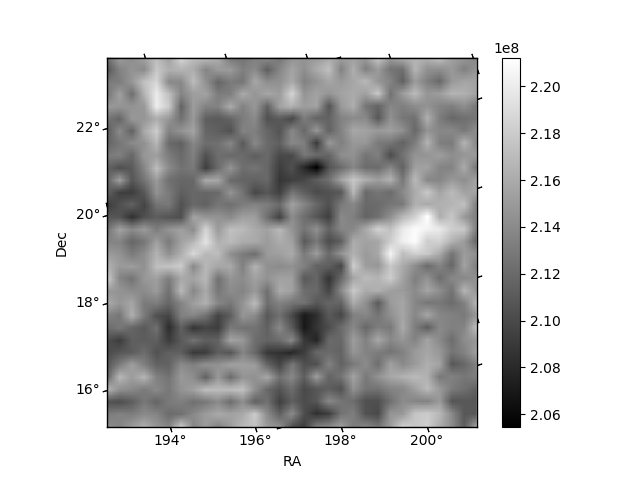
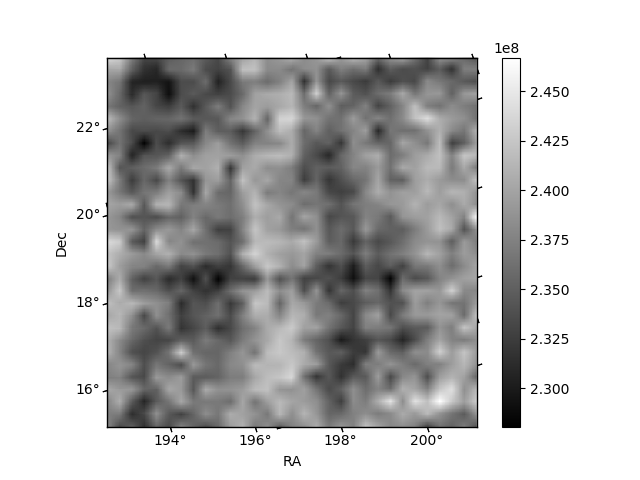
Histogram calculated using DETX and DETY for each event in the final _common_clean file
| Quadrant A | 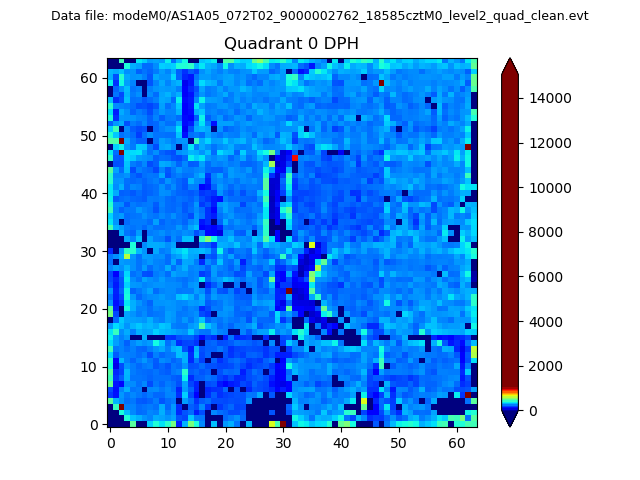 |
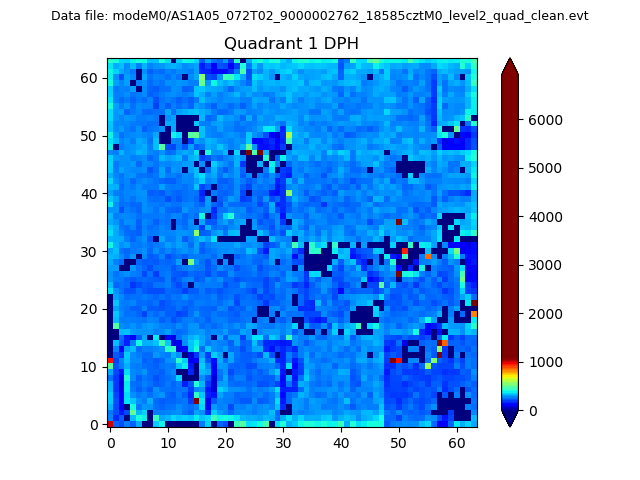 |
Quadrant B |
|---|---|---|---|
| Quadrant D |  |
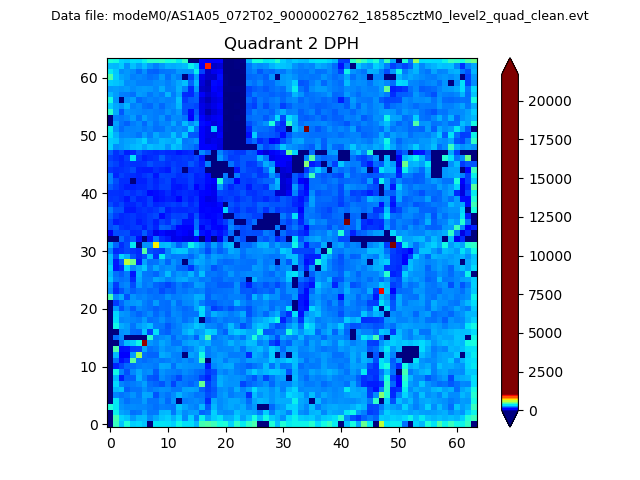 |
Quadrant C |
| Plot type | Count rate plots | Images |
|---|---|---|
| Comparison with Poisson distribution Blue bars denote a histogram of data divided into 1 sec bins. Red curve is a Poisson curve with rate = median count rate of data. |
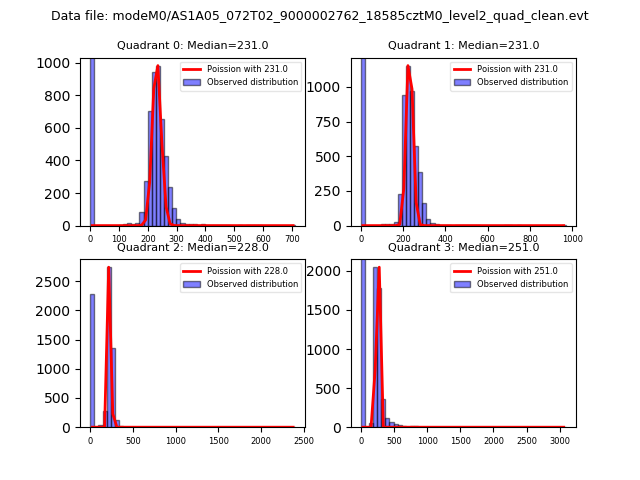 |
 |
| Quadrant-wise count rates Data is divided into 100 sec bins |
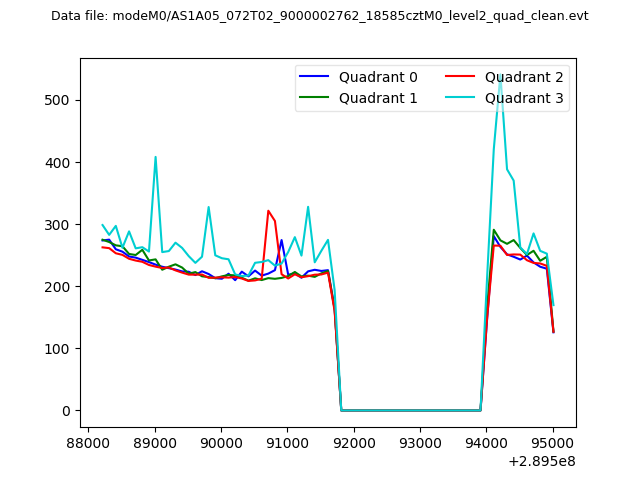 |
|
| Module-wise count rates for Quadrant A Data is divided into 100 sec bins |
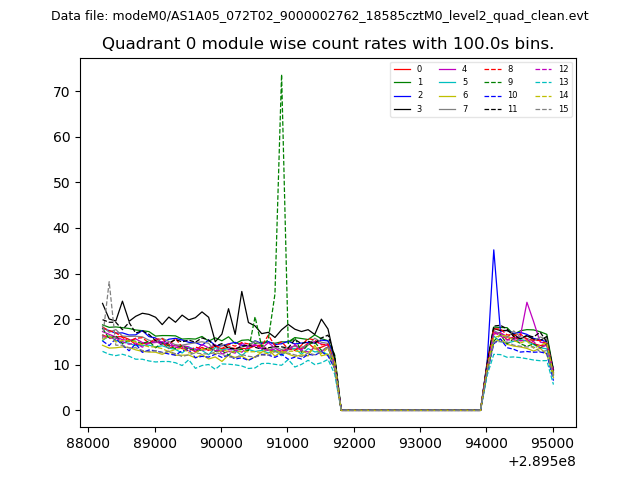 |
 |
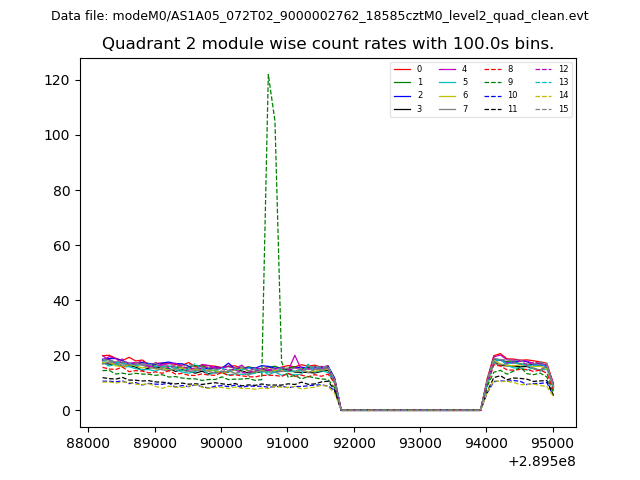
| Module-wise count rates for Quadrant B Data is divided into 100 sec bins |
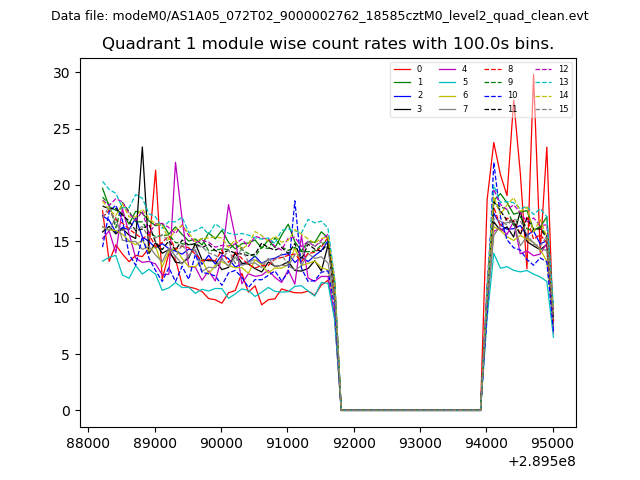 |
 |
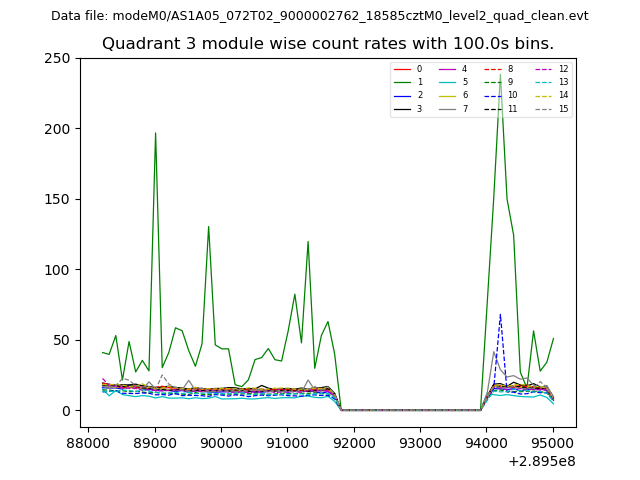
| Module-wise count rates for Quadrant C Data is divided into 100 sec bins |
 |
 |
| Module-wise count rates for Quadrant D Data is divided into 100 sec bins |
 |
 |
| Parameter | Plot |
|---|---|
| CZT HV Monitor | 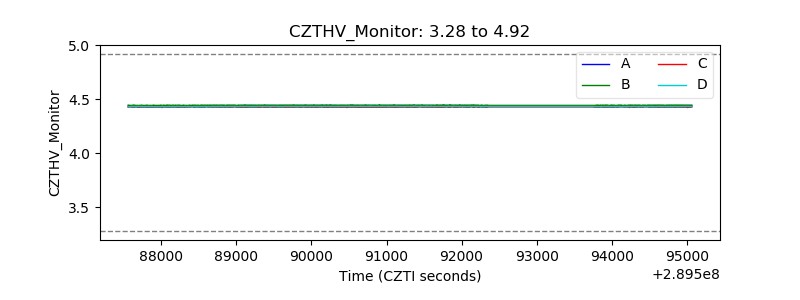 |
| D_VDD | 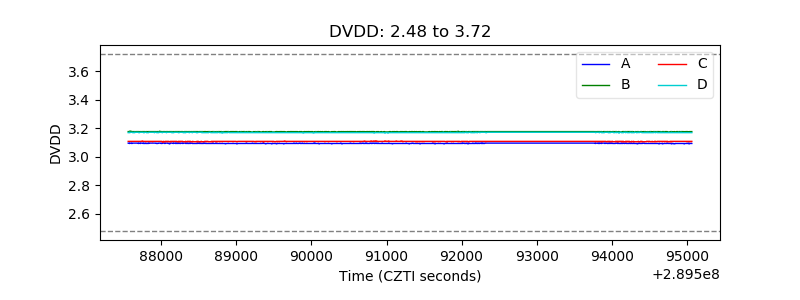 |
| Temperature 1 | 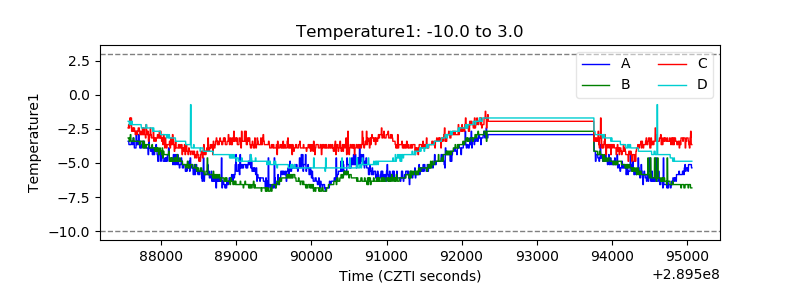 |
| Veto HV Monitor |  |
| Veto LLD | 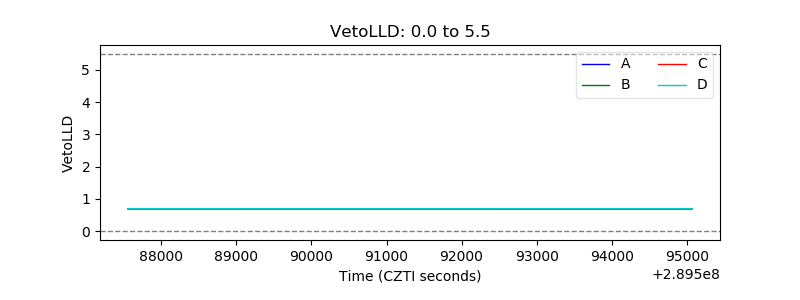 |
| Alpha Counter | 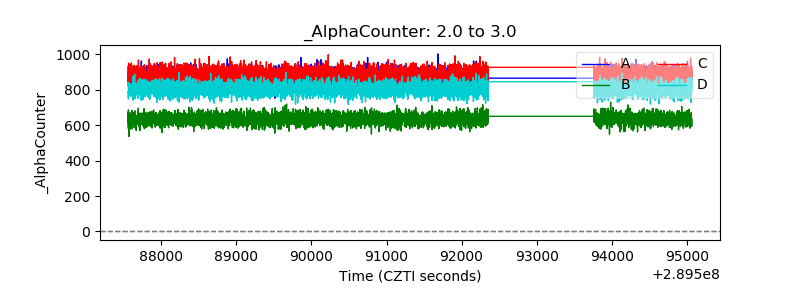 |
| _CPM_Rate |  |
| CZT Counter | 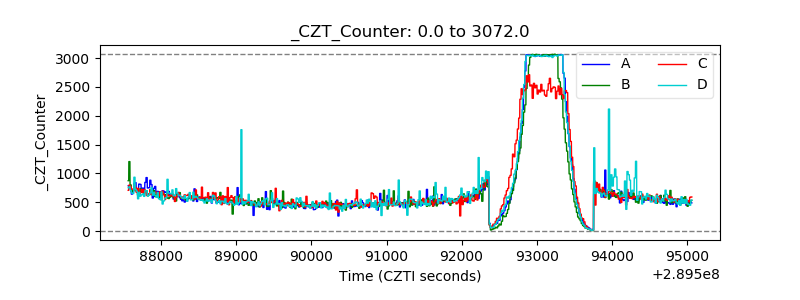 |
| +2.5 Volts monitor |  |
| +5 Volts monitor |  |
| _ROLL_ROT | 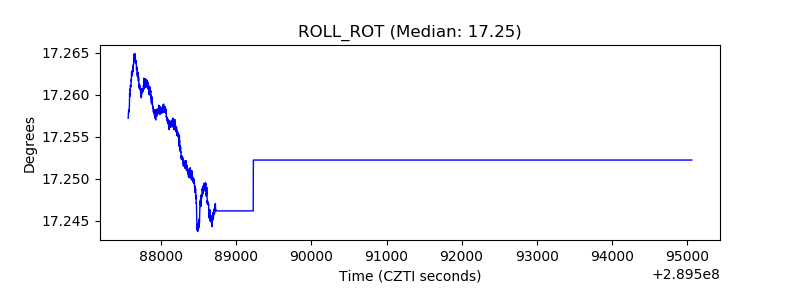 |
| _Roll_DEC | 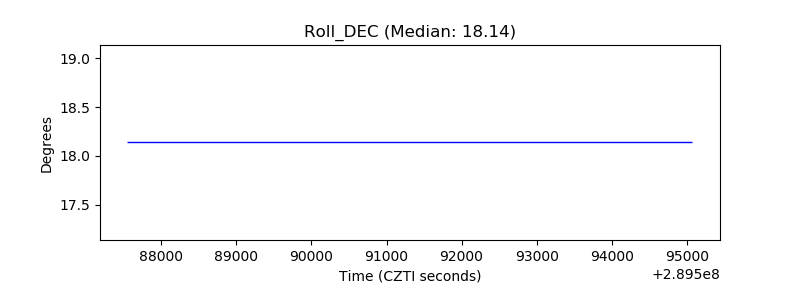 |
| _Roll_RA | 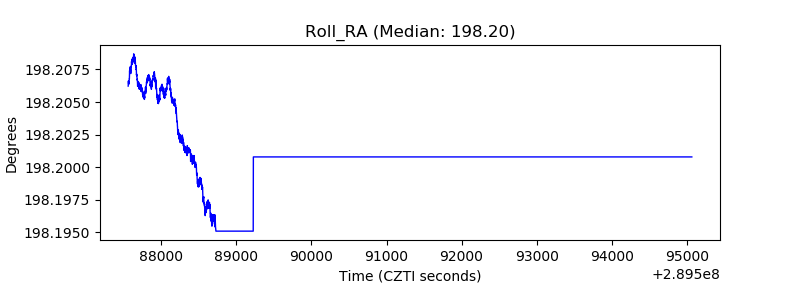 |
| Veto Counter | 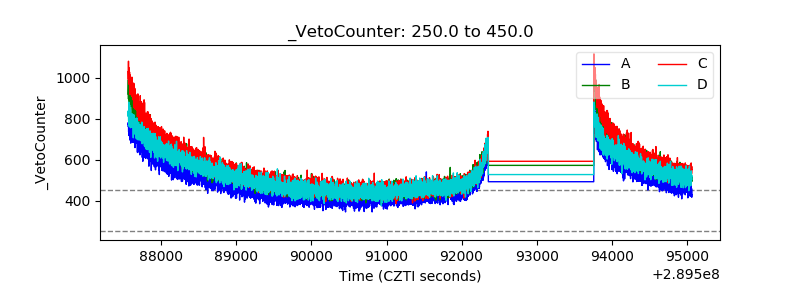 |