| Param | Original file | Final file |
|---|---|---|
| Filename | modeM0/AS1A05_072T02_9000002762_18586cztM0_level2.evt | modeM0/AS1A05_072T02_9000002762_18586cztM0_level2_quad_clean.evt |
| Size (bytes) | 452,370,240 | 107,032,320 |
| Size | 431.4 MB | 102.1 MB |
| Events in quadrant A | 3,128,753 | 698,291 |
| Events in quadrant B | 3,248,202 | 727,437 |
| Events in quadrant C | 3,252,117 | 708,650 |
| Events in quadrant D | 3,653,884 | 678,531 |
| Mode SS | |||
|---|---|---|---|
| Quadrant | BADHDUFLAG | Total packets | Discarded packets |
| A | 0 | 126 | 0 |
| B | 0 | 126 | 0 |
| C | 0 | 126 | 0 |
| D | 0 | 126 | 0 |
| Mode M9 | |||
|---|---|---|---|
| Quadrant | BADHDUFLAG | Total packets | Discarded packets |
| A | 0 | 18 | 0 |
| B | 0 | 19 | 0 |
| C | 0 | 19 | 0 |
| D | 0 | 19 | 0 |
| Mode M0 | |||
|---|---|---|---|
| Quadrant | BADHDUFLAG | Total packets | Discarded packets |
| A | 0 | 13126 | 2 |
| B | 0 | 13546 | 3 |
| C | 0 | 13461 | 2 |
| D | 0 | 14899 | 2 |
| Quadrant | Total seconds | Saturated seconds | Saturation percentage |
|---|---|---|---|
| A | 6138 | 39 | 0.635386% |
| B | 6137 | 76 | 1.238390% |
| C | 6137 | 92 | 1.499104% |
| D | 6137 | 164 | 2.672315% |
Noise dominated data is calculated using 1-second bins in cleaned event files. If a bin has >2000 counts, and if more than 50% of those come from <1% of pixels, then it is considered to be noise-dominated and hence unusable.
| Quadrant | # 1 sec bins | Bins with >0 counts | Bins with >2000 counts | High rate bins dominated by noise | Noise dominated (total time) | Noise dominated (detector-on time) | Marked lightcurve |
|---|---|---|---|---|---|---|---|
| A | 7463 | 6139 | 0 | 0 | 0.00% | 0.00% | 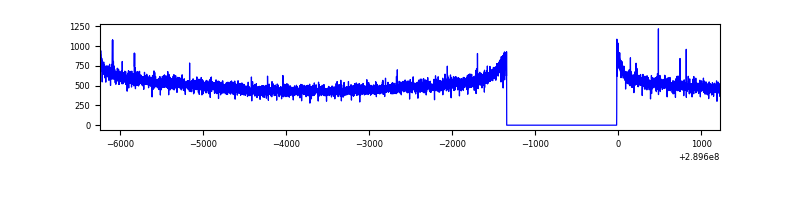 |
| B | 7462 | 6138 | 0 | 0 | 0.00% | 0.00% | 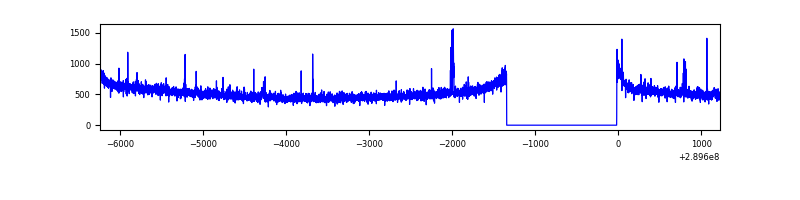 |
| C | 7462 | 6138 | 0 | 0 | 0.00% | 0.00% | 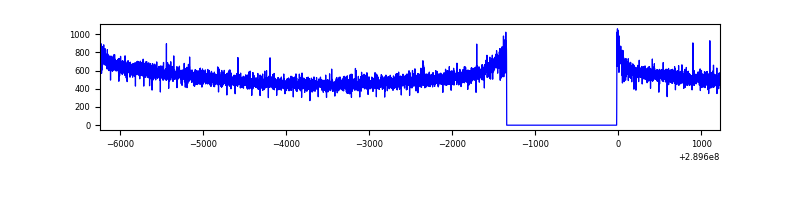 |
| D | 7462 | 6138 | 94 | 94 | 1.26% | 1.53% | 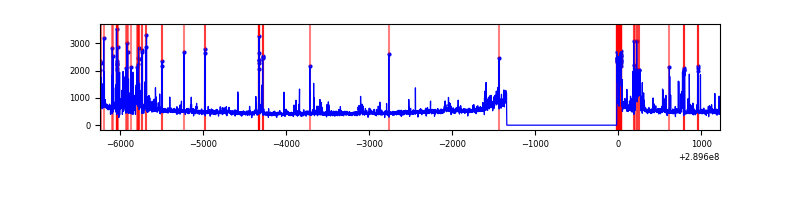 |
Top three noisy pixels from each quadrant. If the there are fewer than three noisy pixels in the level2.evt file, extra rows are filled as -1
| Pixel properties | Quadrant properties | ||||||
|---|---|---|---|---|---|---|---|
| Quadrant | DetID | PixID | Counts | Sigma | Mean | Median | Sigma |
| A | 13 | 254 | 10891 | 62.18 | 808 | 794 | 162.4 |
| A | 13 | 210 | 7807 | 43.18 | 808 | 794 | 162.4 |
| A | 0 | 226 | 7076 | 38.68 | 808 | 794 | 162.4 |
| B | 0 | 230 | 31565 | 199.52 | 820 | 801 | 154.2 |
| B | 12 | 111 | 17879 | 110.76 | 820 | 801 | 154.2 |
| B | 11 | 111 | 15579 | 95.84 | 820 | 801 | 154.2 |
| C | 14 | 238 | 124399 | 665.86 | 801 | 810 | 185.6 |
| C | 13 | 61 | 5673 | 26.2 | 801 | 810 | 185.6 |
| C | 4 | 254 | 3087 | 12.27 | 801 | 810 | 185.6 |
| D | 1 | 52 | 476218 | 2497.87 | 792 | 774 | 190.3 |
| D | 7 | 238 | 83999 | 437.25 | 792 | 774 | 190.3 |
| D | 5 | 222 | 57004 | 295.42 | 792 | 774 | 190.3 |
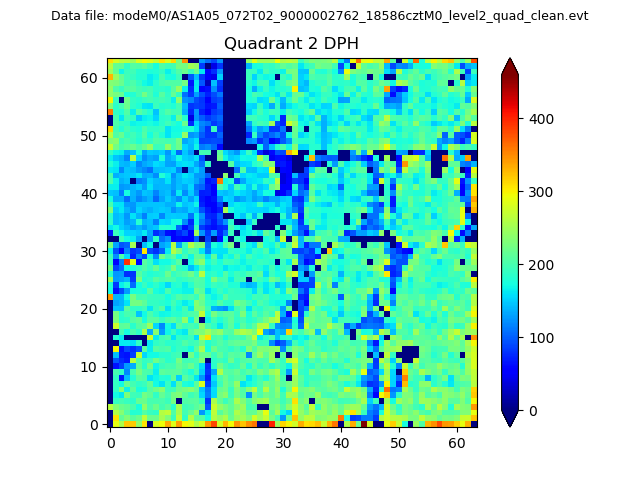
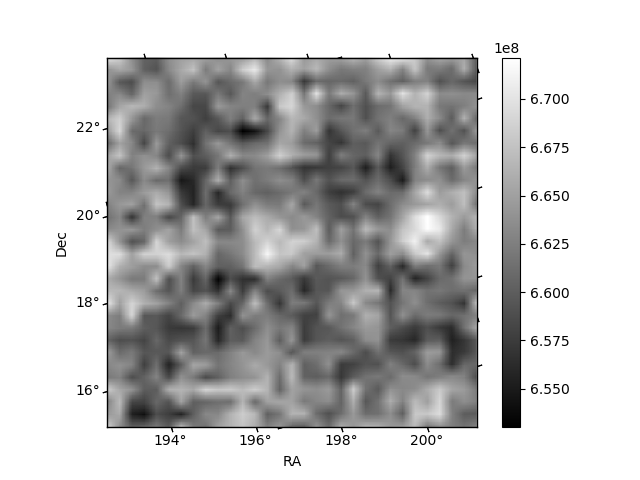
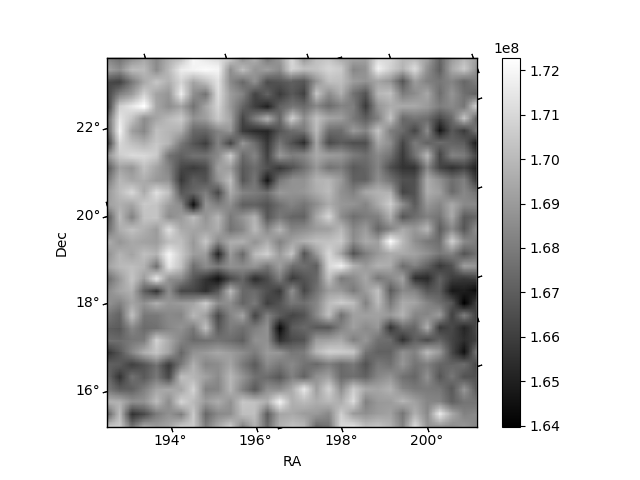
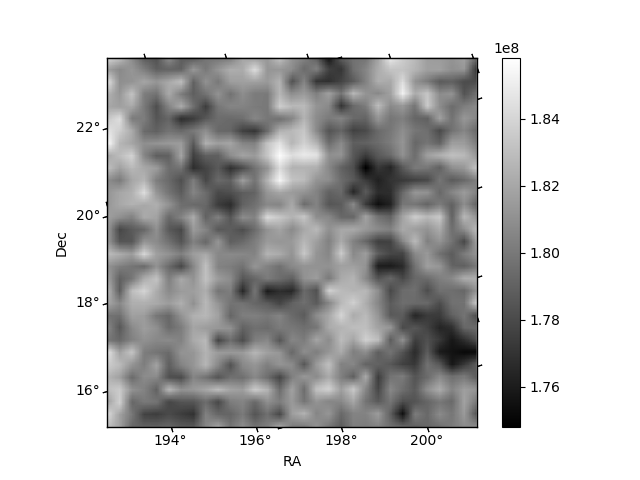
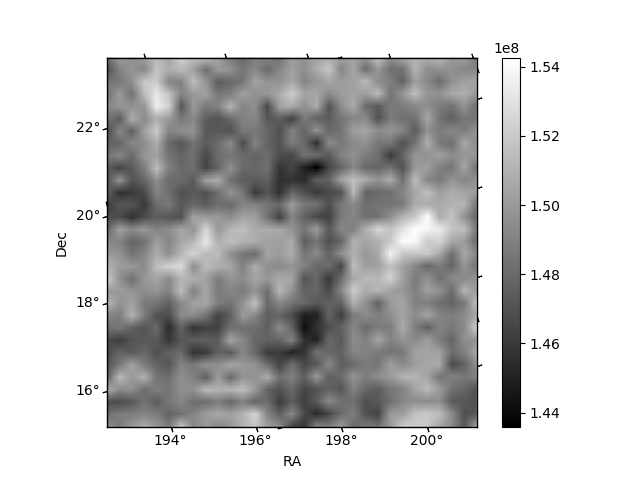
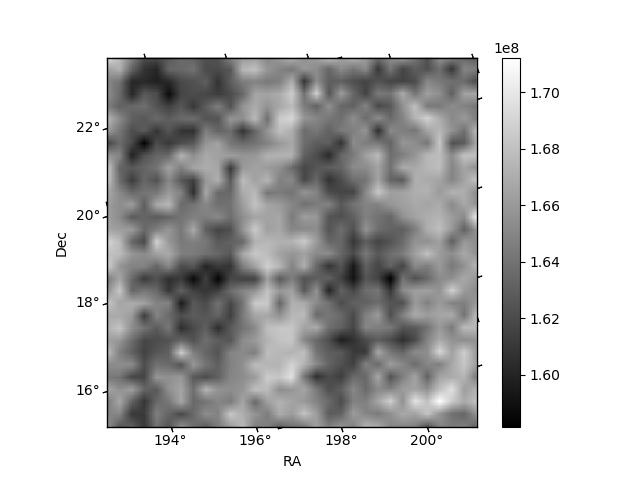
Histogram calculated using DETX and DETY for each event in the final _common_clean file
| Quadrant A | 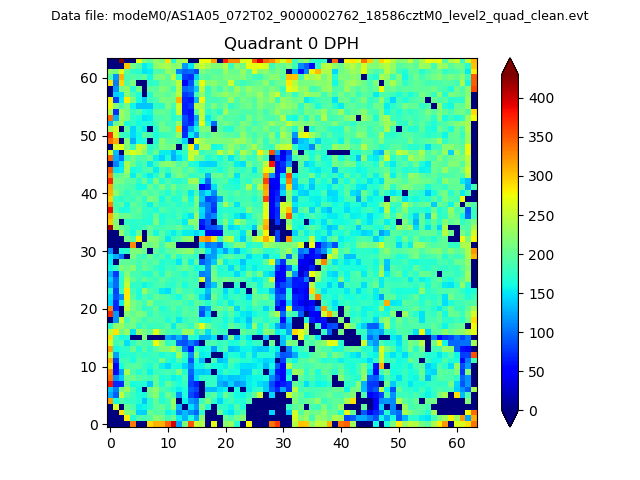 |
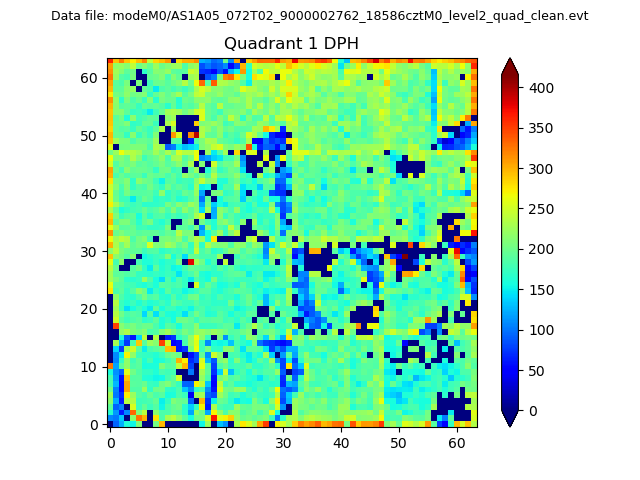 |
Quadrant B |
|---|---|---|---|
| Quadrant D | 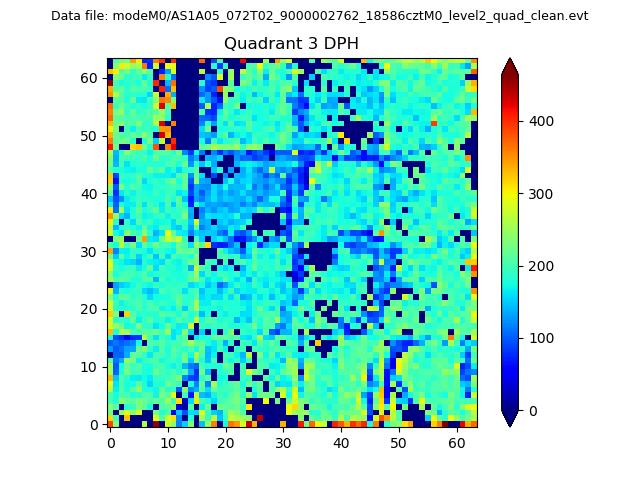 |
 |
Quadrant C |
| Plot type | Count rate plots | Images |
|---|---|---|
| Comparison with Poisson distribution Blue bars denote a histogram of data divided into 1 sec bins. Red curve is a Poisson curve with rate = median count rate of data. |
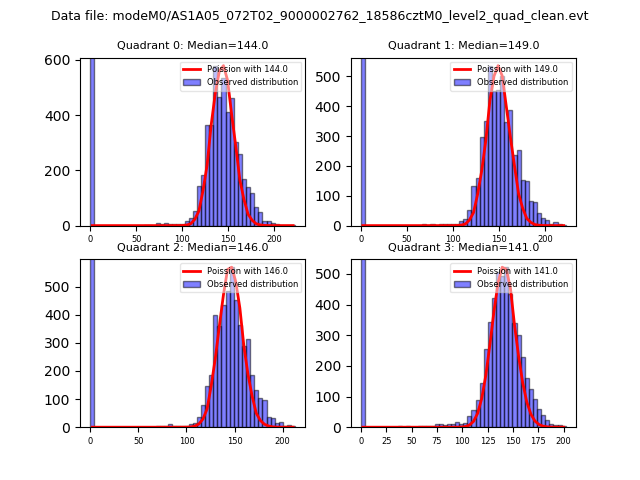 |
 |
| Quadrant-wise count rates Data is divided into 100 sec bins |
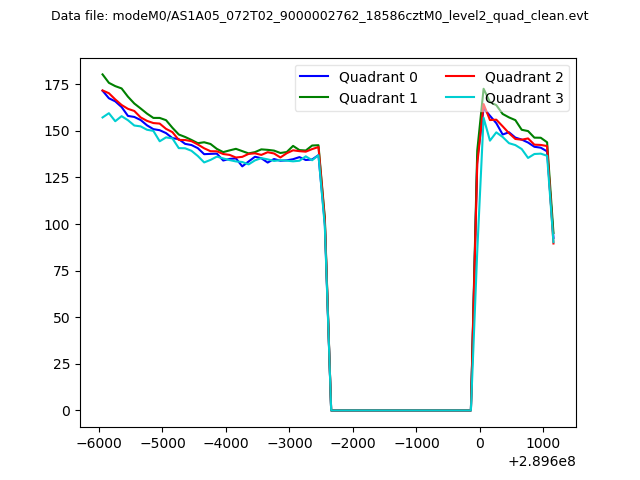 |
|
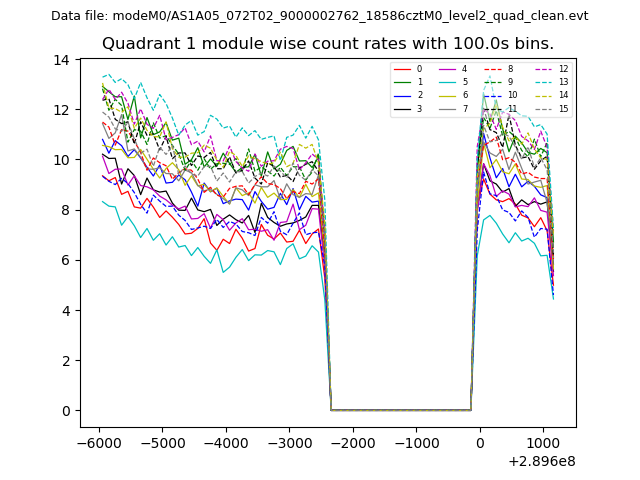
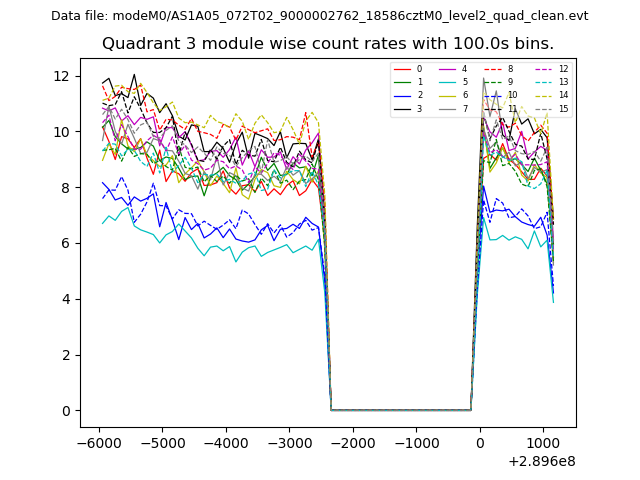
| Module-wise count rates for Quadrant A Data is divided into 100 sec bins |
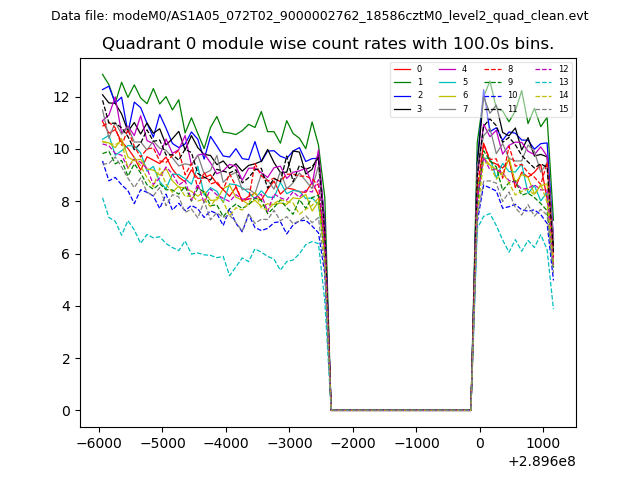 |
 |
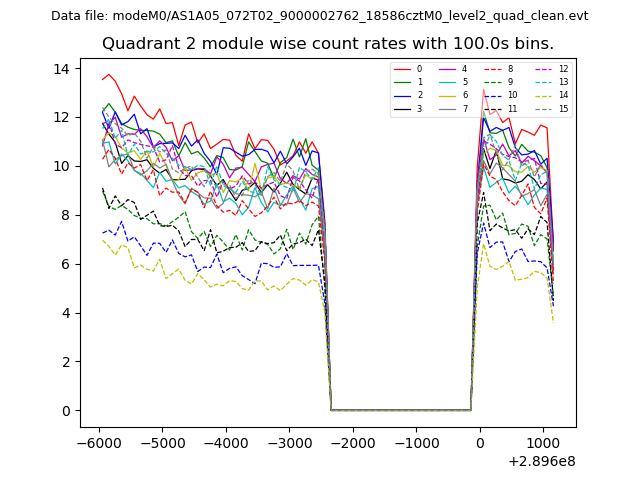
| Module-wise count rates for Quadrant B Data is divided into 100 sec bins |
 |
 |
| Module-wise count rates for Quadrant C Data is divided into 100 sec bins |
 |
 |
| Module-wise count rates for Quadrant D Data is divided into 100 sec bins |
 |
 |
| Parameter | Plot |
|---|---|
| CZT HV Monitor | 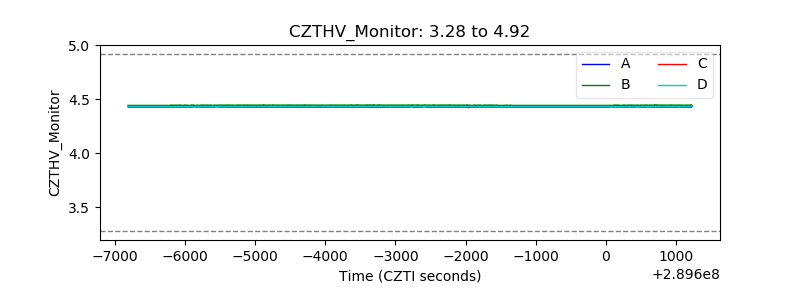 |
| D_VDD | 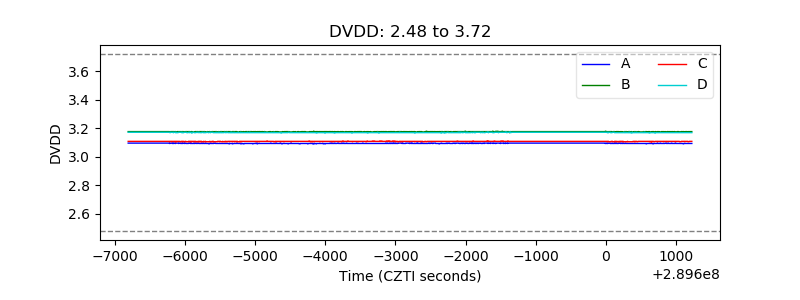 |
| Temperature 1 | 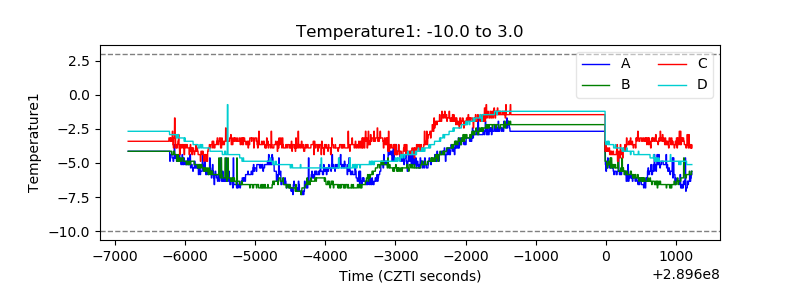 |
| Veto HV Monitor | 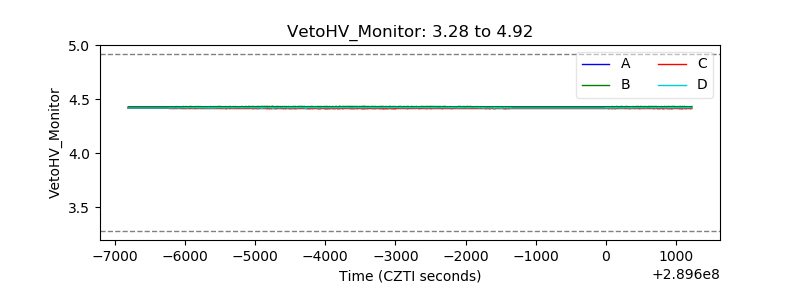 |
| Veto LLD | 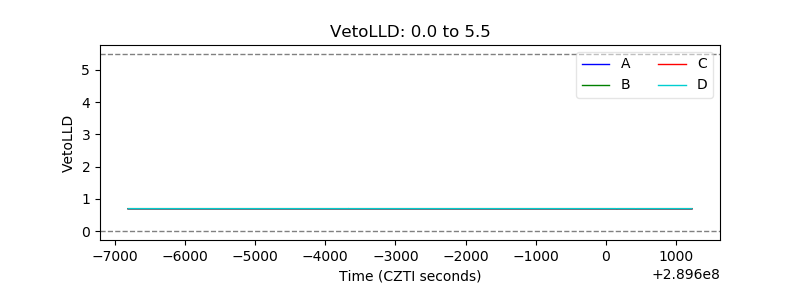 |
| Alpha Counter | 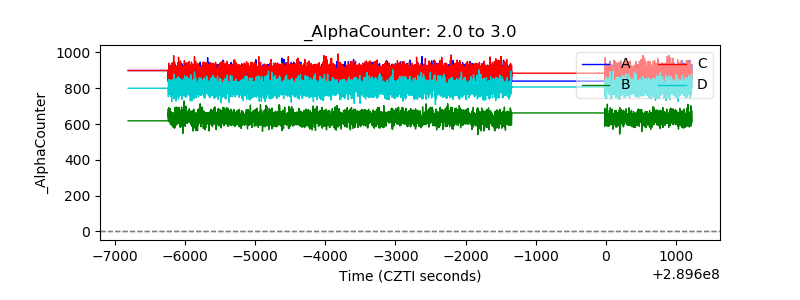 |
| _CPM_Rate | 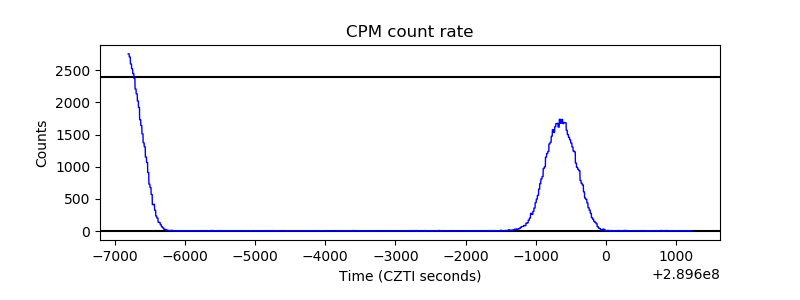 |
| CZT Counter | 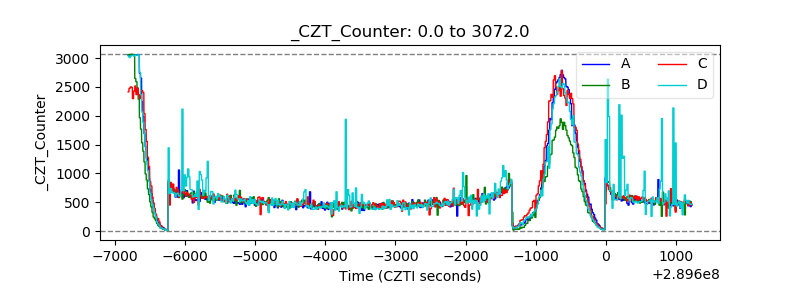 |
| +2.5 Volts monitor |  |
| +5 Volts monitor |  |
| _ROLL_ROT | 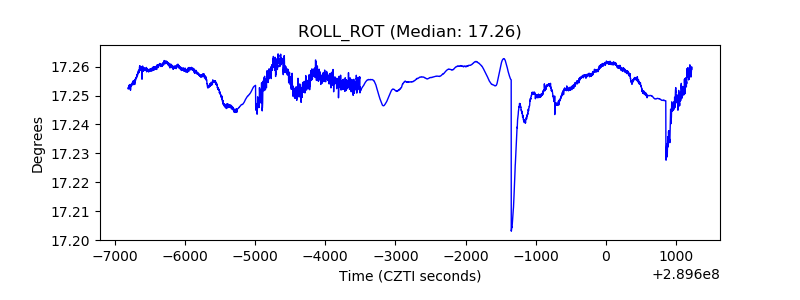 |
| _Roll_DEC | 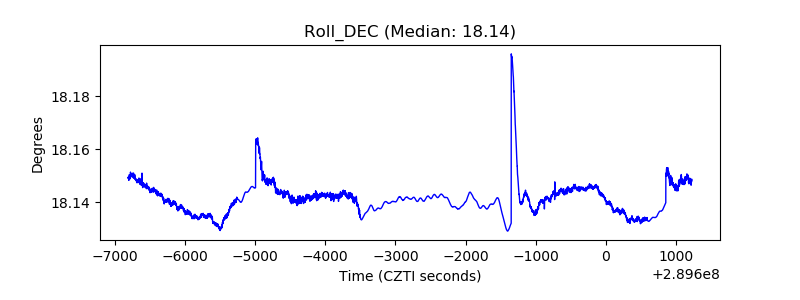 |
| _Roll_RA | 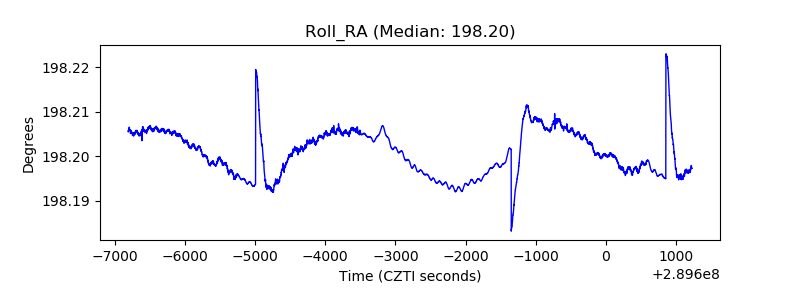 |
| Veto Counter | 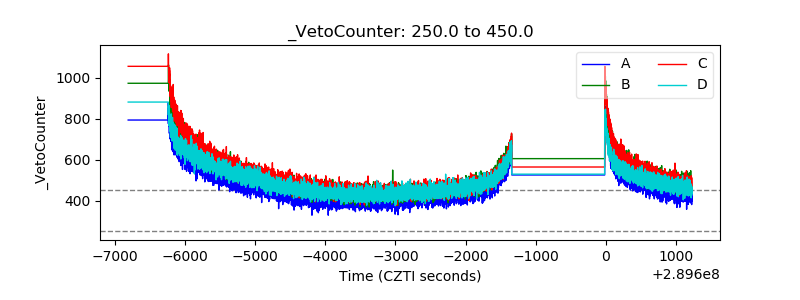 |