| Param | Original file | Final file |
|---|---|---|
| Filename | modeM0/AS1A05_072T02_9000002762_18587cztM0_level2.evt | modeM0/AS1A05_072T02_9000002762_18587cztM0_level2_quad_clean.evt |
| Size (bytes) | 509,172,480 | 101,260,800 |
| Size | 485.6 MB | 96.6 MB |
| Events in quadrant A | 3,161,472 | 656,603 |
| Events in quadrant B | 3,239,200 | 683,687 |
| Events in quadrant C | 3,324,871 | 661,648 |
| Events in quadrant D | 5,257,712 | 615,406 |
| Mode SS | |||
|---|---|---|---|
| Quadrant | BADHDUFLAG | Total packets | Discarded packets |
| A | 0 | 132 | 0 |
| B | 0 | 132 | 0 |
| C | 0 | 132 | 0 |
| D | 0 | 132 | 0 |
| Mode M9 | |||
|---|---|---|---|
| Quadrant | BADHDUFLAG | Total packets | Discarded packets |
| A | 0 | 22 | 0 |
| B | 0 | 23 | 0 |
| C | 0 | 23 | 0 |
| D | 0 | 23 | 0 |
| Mode M0 | |||
|---|---|---|---|
| Quadrant | BADHDUFLAG | Total packets | Discarded packets |
| A | 0 | 13563 | 2 |
| B | 0 | 13684 | 2 |
| C | 0 | 13849 | 2 |
| D | 0 | 19901 | 2 |
| Quadrant | Total seconds | Saturated seconds | Saturation percentage |
|---|---|---|---|
| A | 6438 | 32 | 0.497049% |
| B | 6437 | 58 | 0.901041% |
| C | 6437 | 89 | 1.382632% |
| D | 6437 | 515 | 8.000621% |
Noise dominated data is calculated using 1-second bins in cleaned event files. If a bin has >2000 counts, and if more than 50% of those come from <1% of pixels, then it is considered to be noise-dominated and hence unusable.
| Quadrant | # 1 sec bins | Bins with >0 counts | Bins with >2000 counts | High rate bins dominated by noise | Noise dominated (total time) | Noise dominated (detector-on time) | Marked lightcurve |
|---|---|---|---|---|---|---|---|
| A | 7578 | 6439 | 2 | 2 | 0.03% | 0.03% | 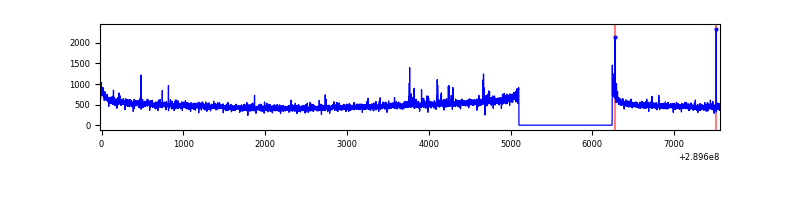 |
| B | 7577 | 6438 | 0 | 0 | 0.00% | 0.00% | 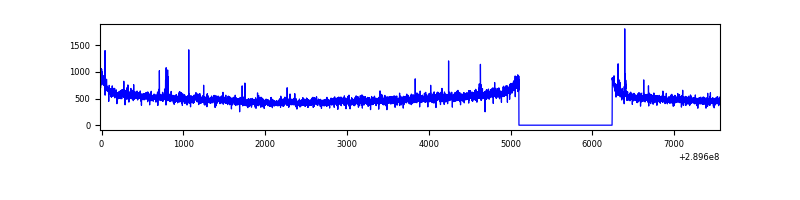 |
| C | 7577 | 6438 | 8 | 8 | 0.11% | 0.12% | 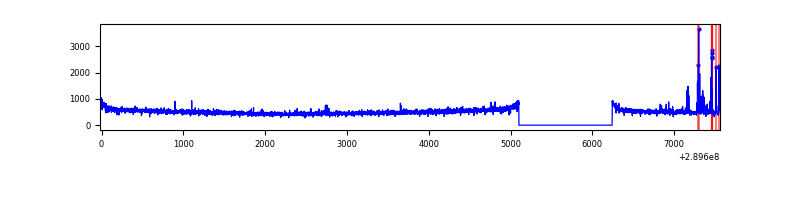 |
| D | 7577 | 6438 | 464 | 464 | 6.12% | 7.21% | 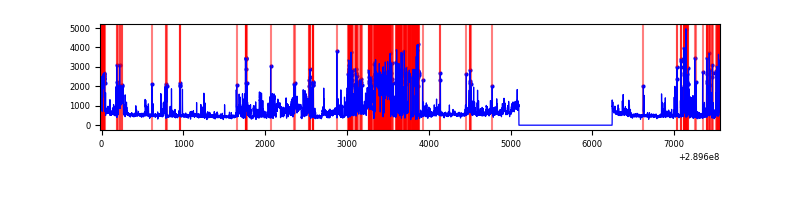 |
Top three noisy pixels from each quadrant. If the there are fewer than three noisy pixels in the level2.evt file, extra rows are filled as -1
| Pixel properties | Quadrant properties | ||||||
|---|---|---|---|---|---|---|---|
| Quadrant | DetID | PixID | Counts | Sigma | Mean | Median | Sigma |
| A | 9 | 143 | 24330 | 145.33 | 810 | 795 | 161.9 |
| A | 4 | 2 | 13360 | 77.59 | 810 | 795 | 161.9 |
| A | 13 | 254 | 10590 | 60.48 | 810 | 795 | 161.9 |
| B | 12 | 111 | 18494 | 112.71 | 820 | 799 | 157.0 |
| B | 11 | 111 | 15881 | 96.06 | 820 | 799 | 157.0 |
| B | 0 | 198 | 15714 | 95.0 | 820 | 799 | 157.0 |
| C | 14 | 238 | 125412 | 670.69 | 796 | 805 | 185.8 |
| C | 4 | 254 | 88661 | 472.88 | 796 | 805 | 185.8 |
| C | 13 | 61 | 5485 | 25.19 | 796 | 805 | 185.8 |
| D | 7 | 238 | 1362762 | 7378.08 | 764 | 745 | 184.6 |
| D | 1 | 52 | 871111 | 4714.8 | 764 | 745 | 184.6 |
| D | 5 | 222 | 86766 | 465.98 | 764 | 745 | 184.6 |
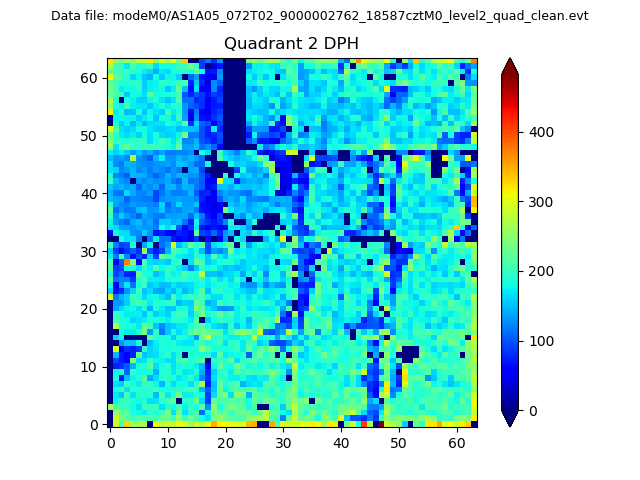
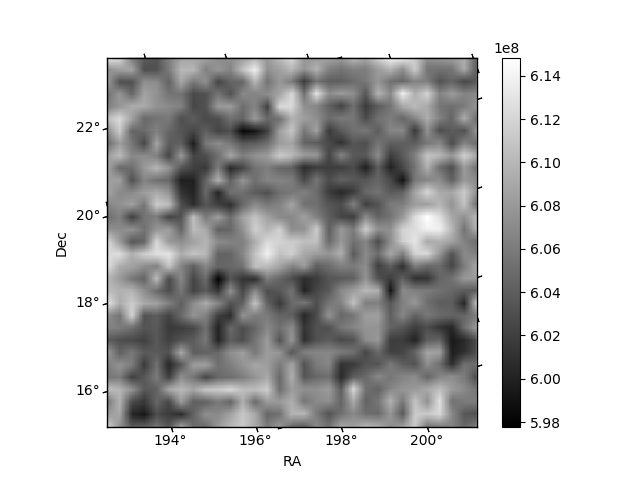
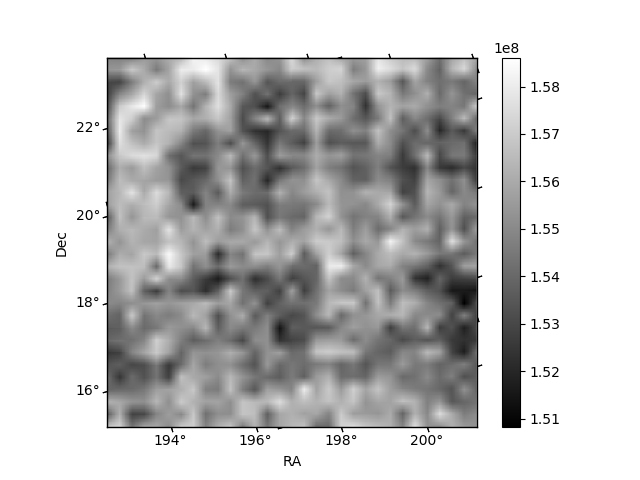
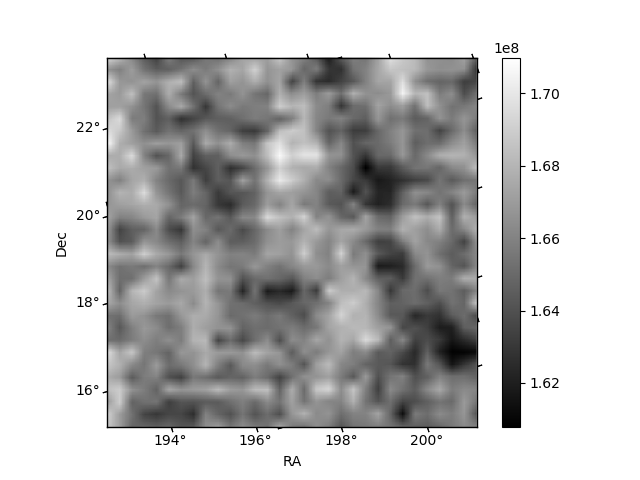
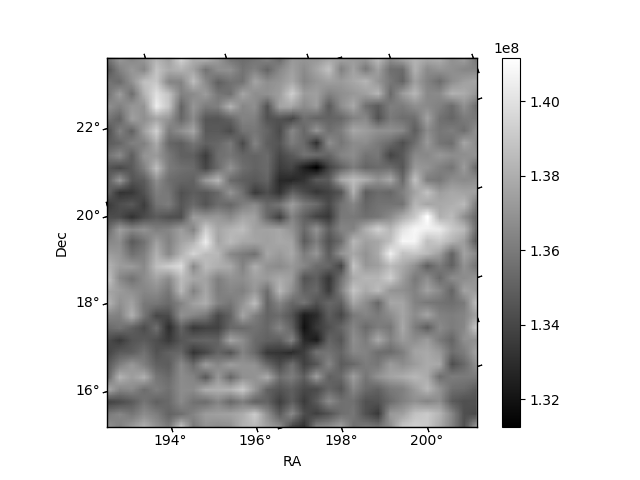
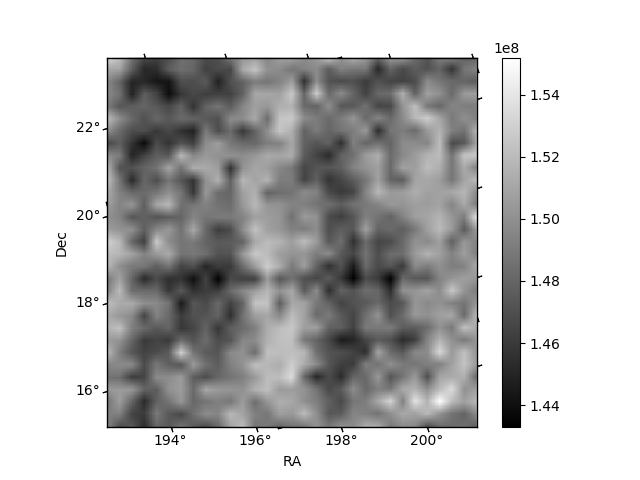
Histogram calculated using DETX and DETY for each event in the final _common_clean file
| Quadrant A | 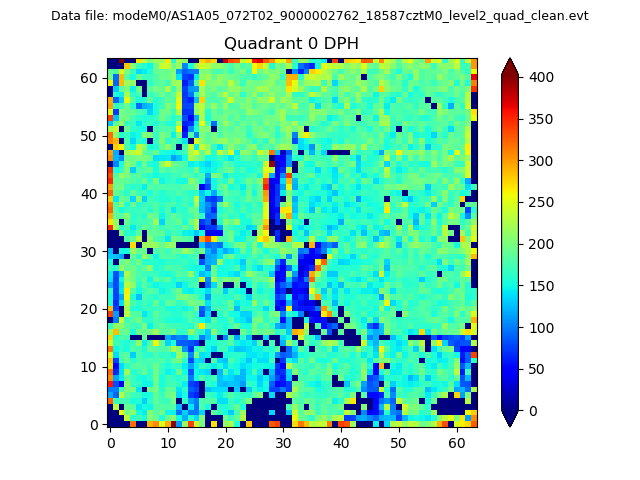 |
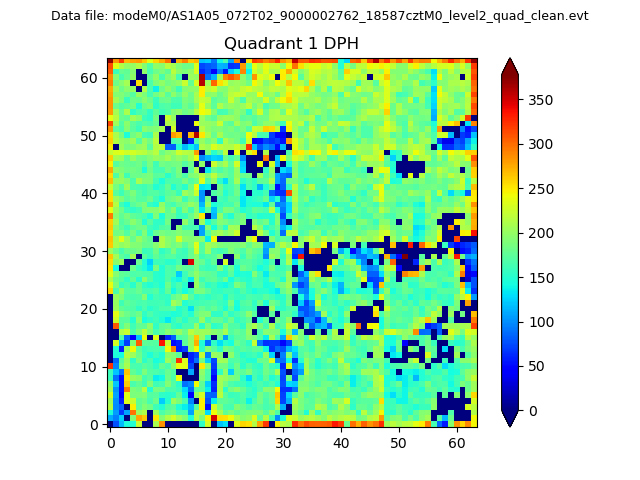 |
Quadrant B |
|---|---|---|---|
| Quadrant D | 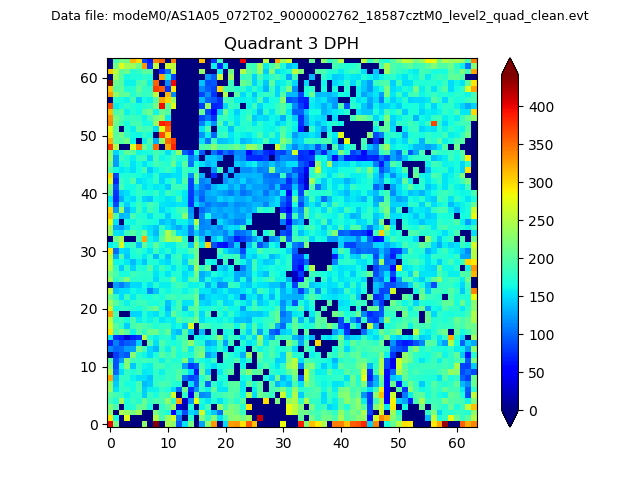 |
 |
Quadrant C |
| Plot type | Count rate plots | Images |
|---|---|---|
| Comparison with Poisson distribution Blue bars denote a histogram of data divided into 1 sec bins. Red curve is a Poisson curve with rate = median count rate of data. |
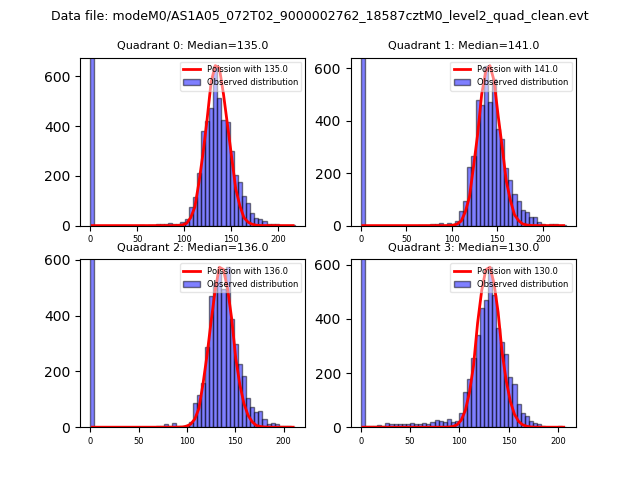 |
 |
| Quadrant-wise count rates Data is divided into 100 sec bins |
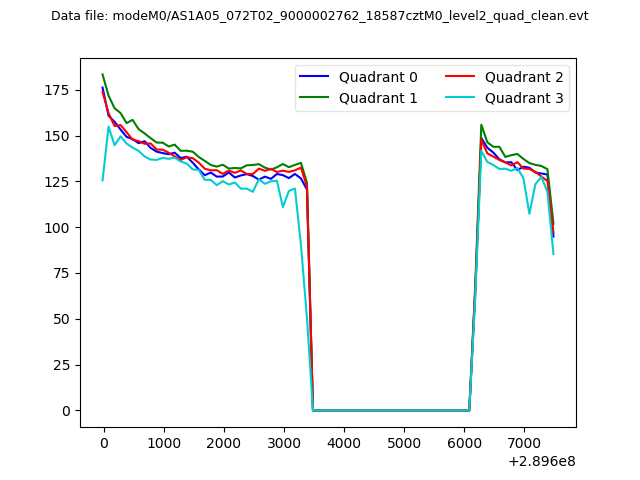 |
|
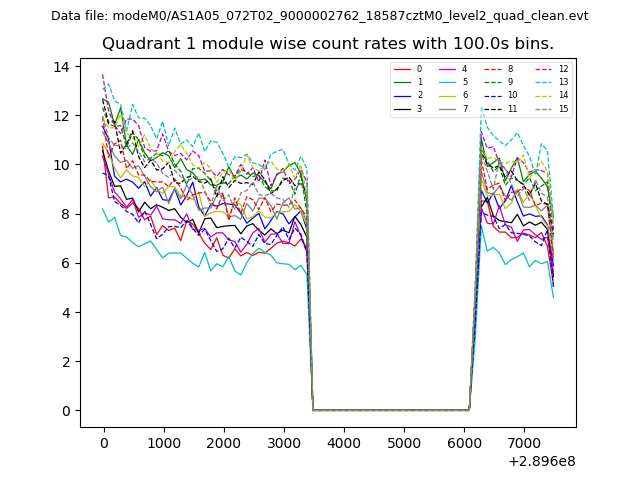
| Module-wise count rates for Quadrant A Data is divided into 100 sec bins |
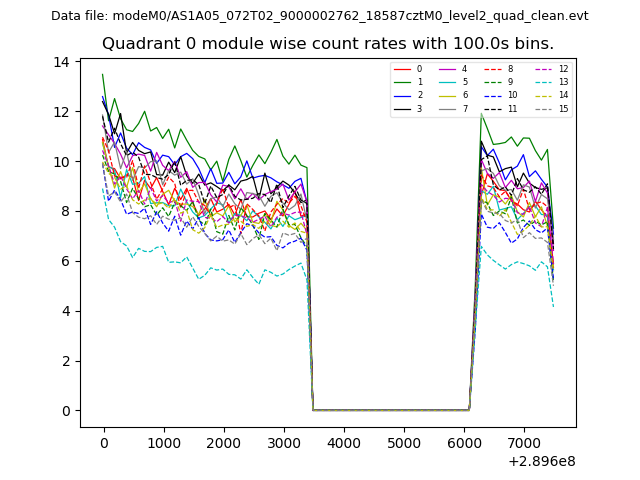 |
 |
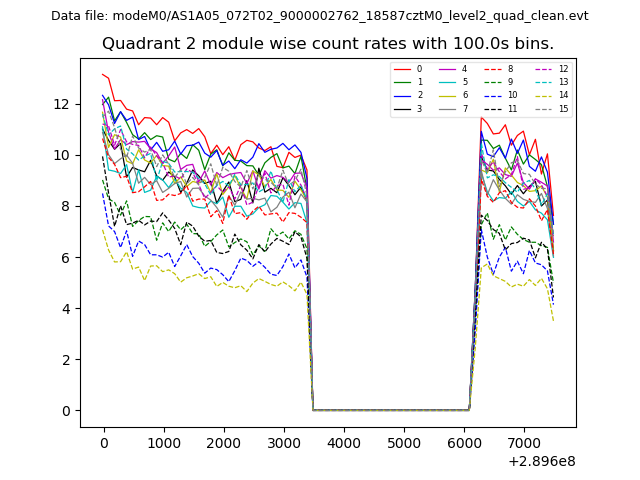
| Module-wise count rates for Quadrant B Data is divided into 100 sec bins |
 |
 |
| Module-wise count rates for Quadrant C Data is divided into 100 sec bins |
 |
 |
| Module-wise count rates for Quadrant D Data is divided into 100 sec bins |
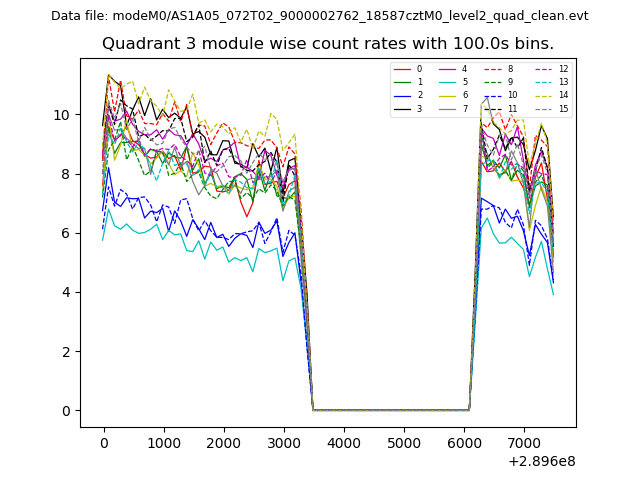 |
 |
| Parameter | Plot |
|---|---|
| CZT HV Monitor | 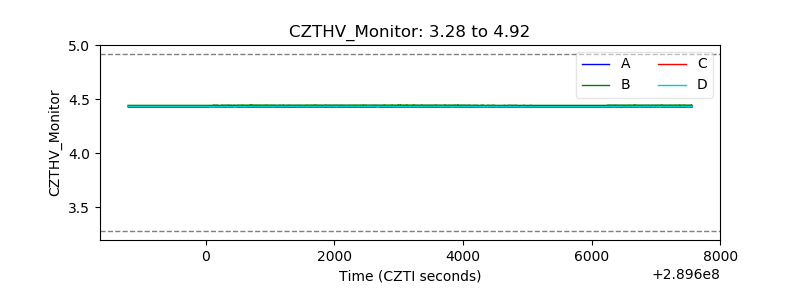 |
| D_VDD | 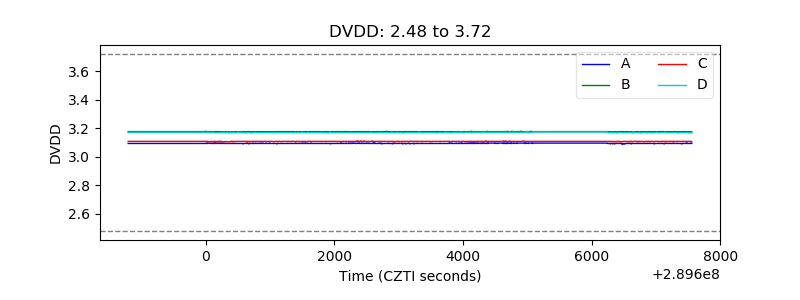 |
| Temperature 1 | 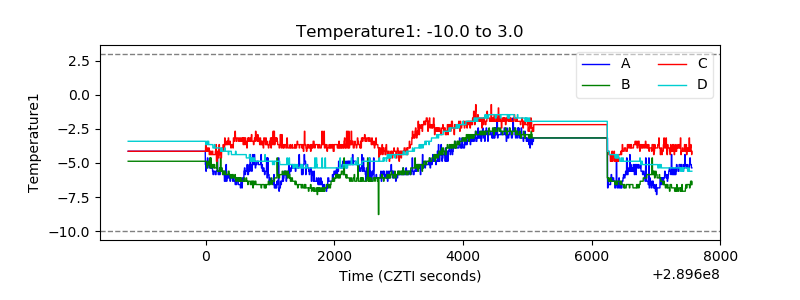 |
| Veto HV Monitor | 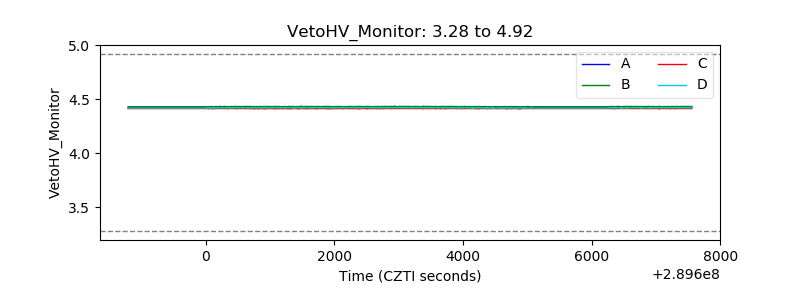 |
| Veto LLD | 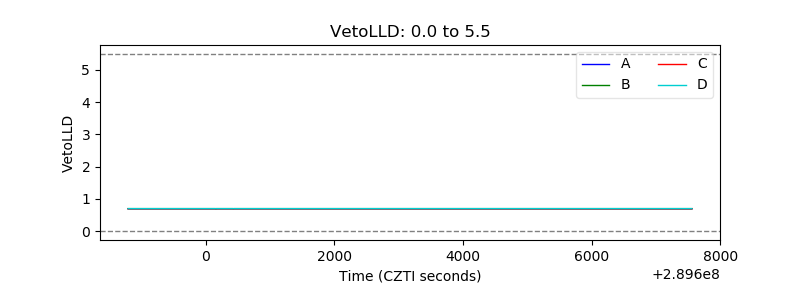 |
| Alpha Counter | 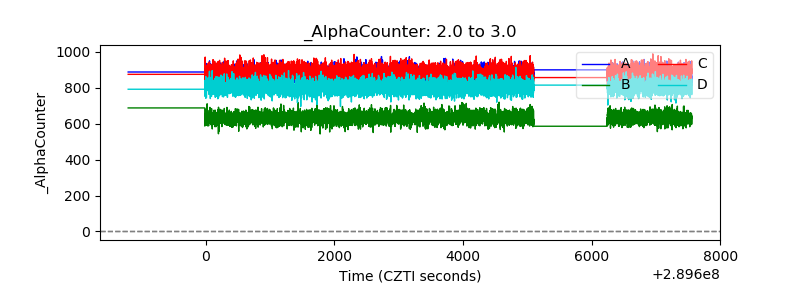 |
| _CPM_Rate | 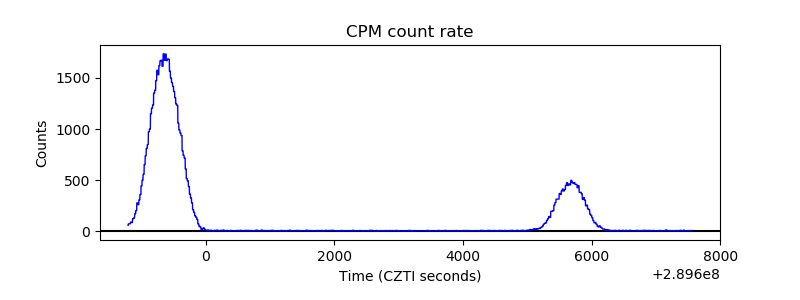 |
| CZT Counter | 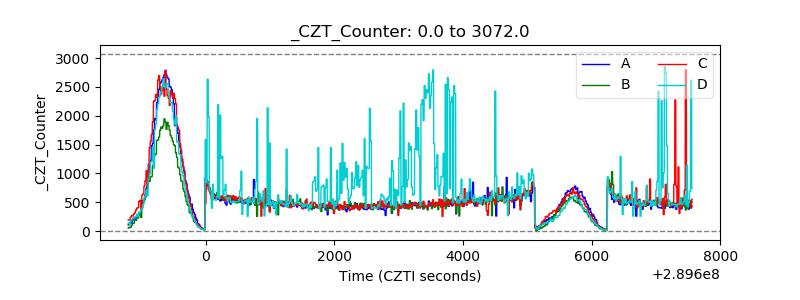 |
| +2.5 Volts monitor | 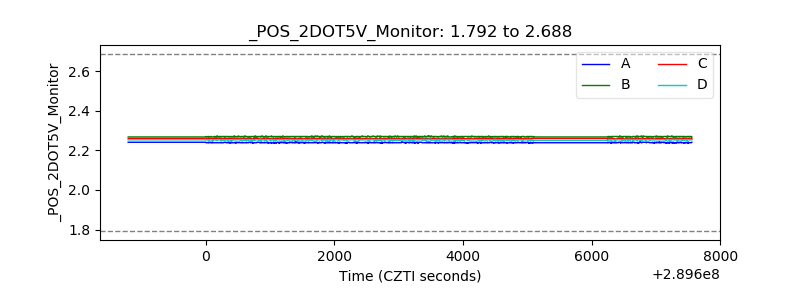 |
| +5 Volts monitor | 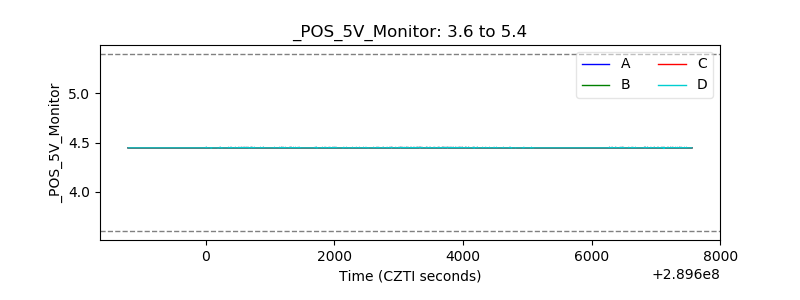 |
| _ROLL_ROT | 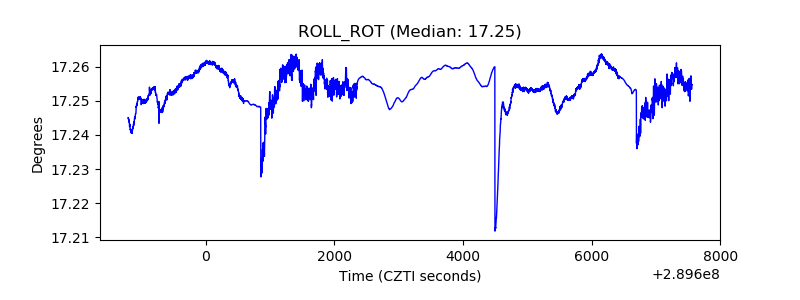 |
| _Roll_DEC |  |
| _Roll_RA | 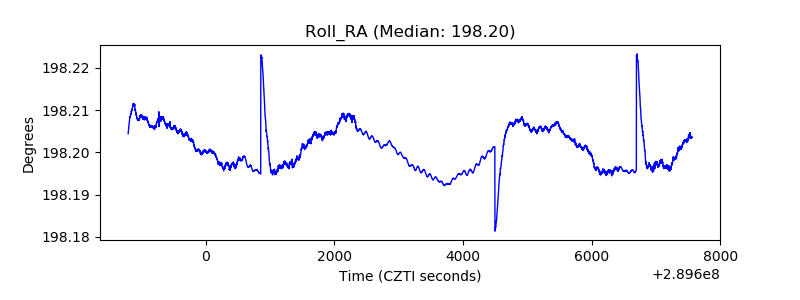 |
| Veto Counter | 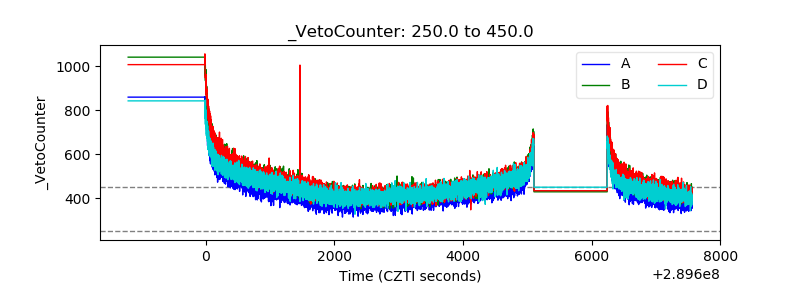 |