| Param | Original file | Final file |
|---|---|---|
| Filename | modeM0/AS1A05_072T02_9000002762_18588cztM0_level2.evt | modeM0/AS1A05_072T02_9000002762_18588cztM0_level2_quad_clean.evt |
| Size (bytes) | 557,809,920 | 92,609,280 |
| Size | 532.0 MB | 88.3 MB |
| Events in quadrant A | 3,612,336 | 574,288 |
| Events in quadrant B | 3,663,481 | 595,011 |
| Events in quadrant C | 4,106,230 | 577,484 |
| Events in quadrant D | 5,010,445 | 543,756 |
| Mode SS | |||
|---|---|---|---|
| Quadrant | BADHDUFLAG | Total packets | Discarded packets |
| A | 0 | 152 | 0 |
| B | 0 | 152 | 0 |
| C | 0 | 152 | 0 |
| D | 0 | 152 | 0 |
| Mode M9 | |||
|---|---|---|---|
| Quadrant | BADHDUFLAG | Total packets | Discarded packets |
| A | 0 | 19 | 0 |
| B | 0 | 19 | 0 |
| C | 0 | 19 | 0 |
| D | 0 | 19 | 0 |
| Mode M0 | |||
|---|---|---|---|
| Quadrant | BADHDUFLAG | Total packets | Discarded packets |
| A | 0 | 15598 | 2 |
| B | 0 | 15619 | 2 |
| C | 0 | 16808 | 2 |
| D | 0 | 19805 | 2 |
| Quadrant | Total seconds | Saturated seconds | Saturation percentage |
|---|---|---|---|
| A | 7382 | 43 | 0.582498% |
| B | 7382 | 69 | 0.934706% |
| C | 7382 | 170 | 2.302899% |
| D | 7383 | 369 | 4.997968% |
Noise dominated data is calculated using 1-second bins in cleaned event files. If a bin has >2000 counts, and if more than 50% of those come from <1% of pixels, then it is considered to be noise-dominated and hence unusable.
| Quadrant | # 1 sec bins | Bins with >0 counts | Bins with >2000 counts | High rate bins dominated by noise | Noise dominated (total time) | Noise dominated (detector-on time) | Marked lightcurve |
|---|---|---|---|---|---|---|---|
| A | 9292 | 7384 | 3 | 3 | 0.03% | 0.04% | 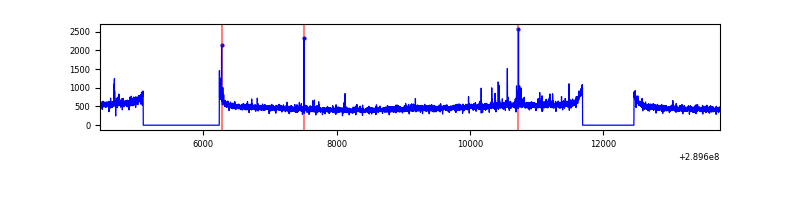 |
| B | 9292 | 7384 | 0 | 0 | 0.00% | 0.00% |  |
| C | 9292 | 7384 | 56 | 56 | 0.60% | 0.76% | 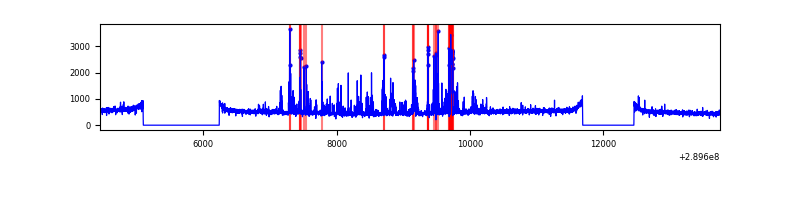 |
| D | 9293 | 7385 | 312 | 312 | 3.36% | 4.22% | 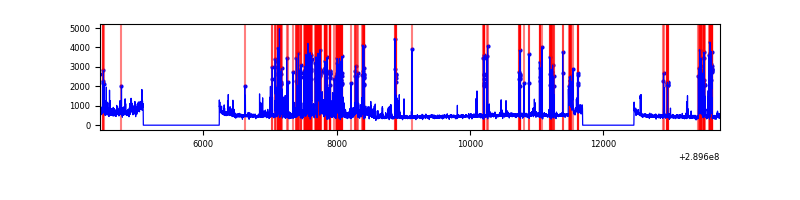 |
Top three noisy pixels from each quadrant. If the there are fewer than three noisy pixels in the level2.evt file, extra rows are filled as -1
| Pixel properties | Quadrant properties | ||||||
|---|---|---|---|---|---|---|---|
| Quadrant | DetID | PixID | Counts | Sigma | Mean | Median | Sigma |
| A | 9 | 143 | 40874 | 213.69 | 924 | 902 | 187.1 |
| A | 13 | 254 | 12629 | 62.69 | 924 | 902 | 187.1 |
| A | 0 | 226 | 7924 | 37.54 | 924 | 902 | 187.1 |
| B | 12 | 111 | 21755 | 115.52 | 932 | 907 | 180.5 |
| B | 11 | 111 | 18809 | 99.19 | 932 | 907 | 180.5 |
| B | 14 | 111 | 16306 | 85.33 | 932 | 907 | 180.5 |
| C | 4 | 254 | 440231 | 2092.9 | 895 | 903 | 209.9 |
| C | 14 | 238 | 138076 | 653.47 | 895 | 903 | 209.9 |
| C | 9 | 54 | 29216 | 134.88 | 895 | 903 | 209.9 |
| D | 7 | 238 | 1093900 | 5050.47 | 887 | 860 | 216.4 |
| D | 1 | 52 | 478016 | 2204.73 | 887 | 860 | 216.4 |
| D | 5 | 222 | 65703 | 299.61 | 887 | 860 | 216.4 |
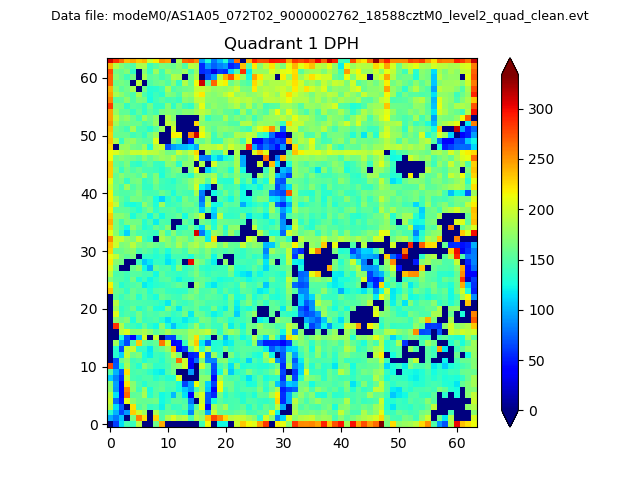
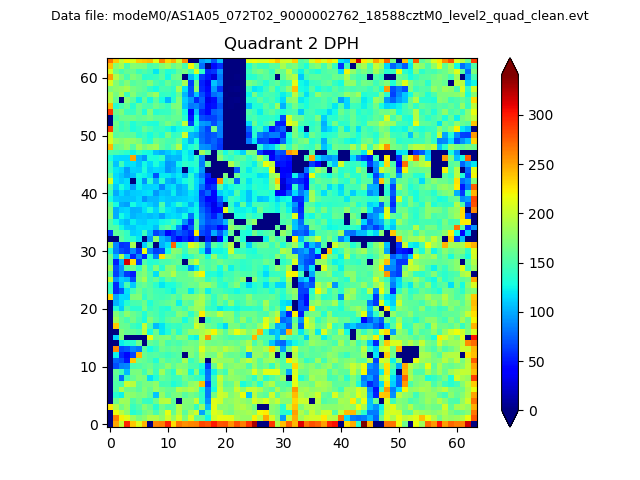
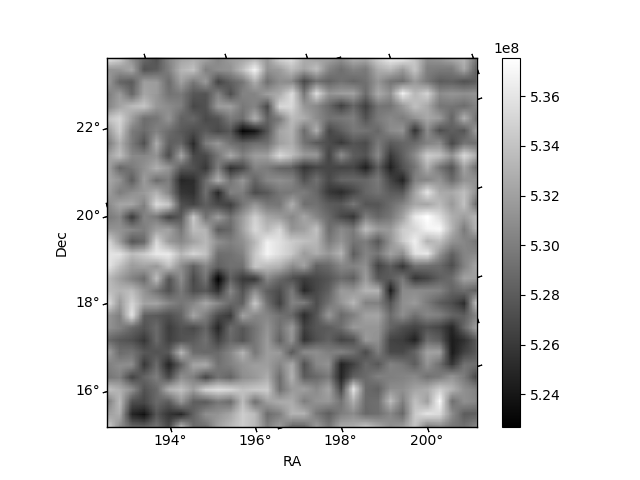
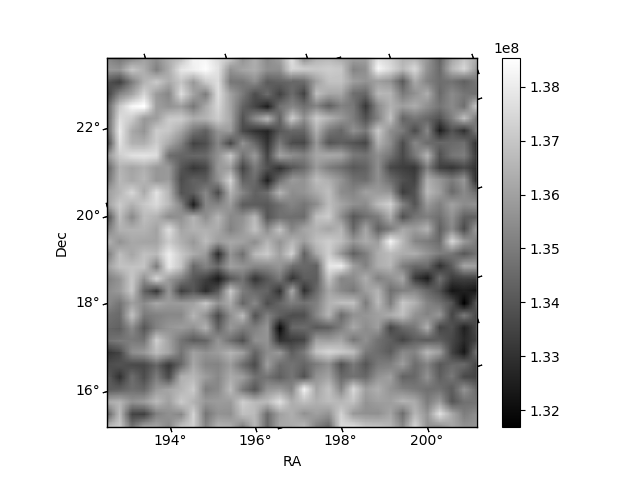
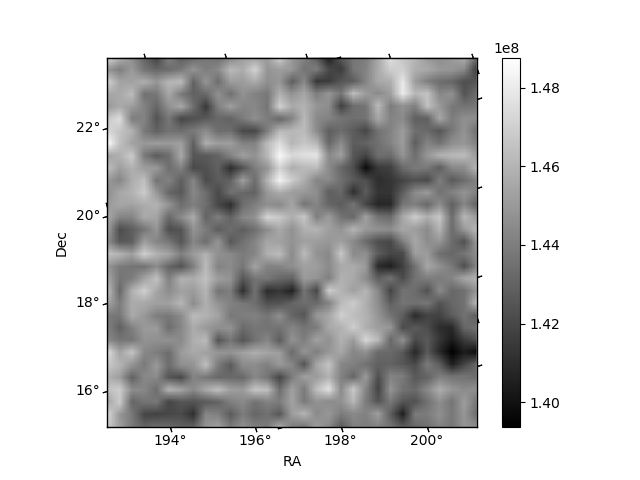
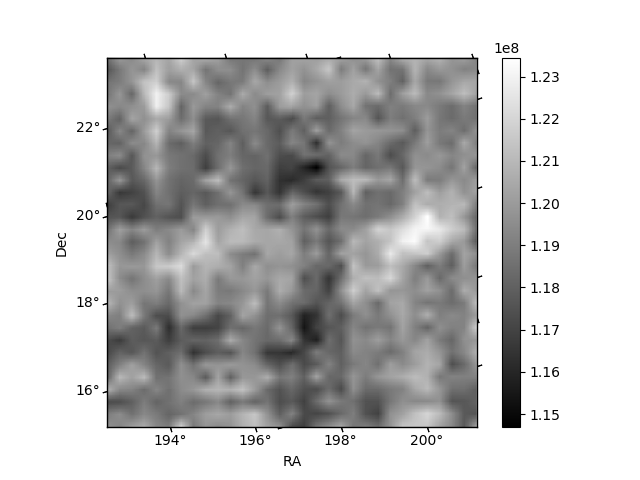
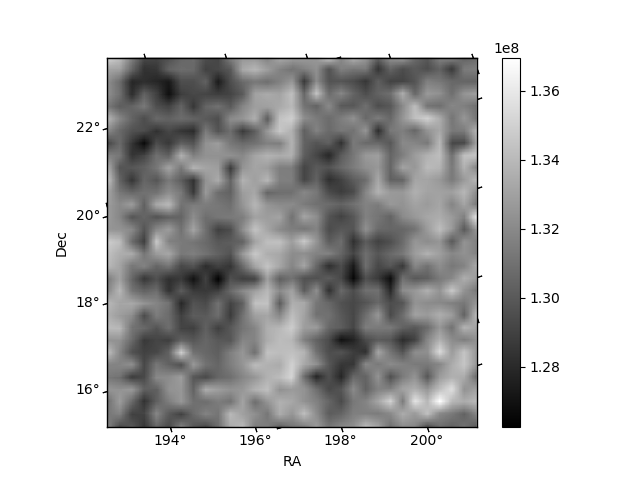
Histogram calculated using DETX and DETY for each event in the final _common_clean file
| Quadrant A | 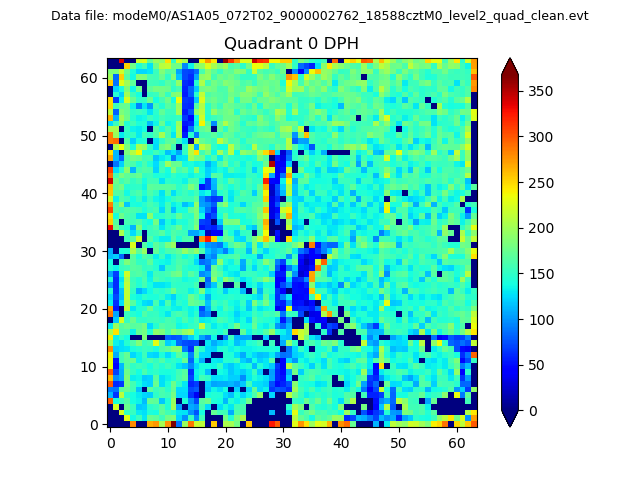 |
 |
Quadrant B |
|---|---|---|---|
| Quadrant D | 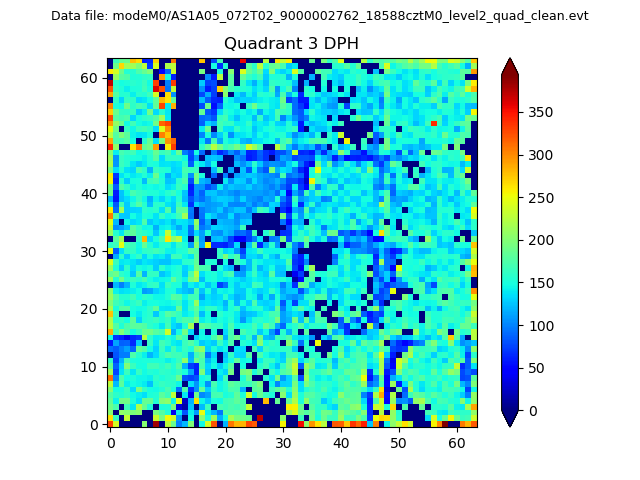 |
 |
Quadrant C |
| Plot type | Count rate plots | Images |
|---|---|---|
| Comparison with Poisson distribution Blue bars denote a histogram of data divided into 1 sec bins. Red curve is a Poisson curve with rate = median count rate of data. |
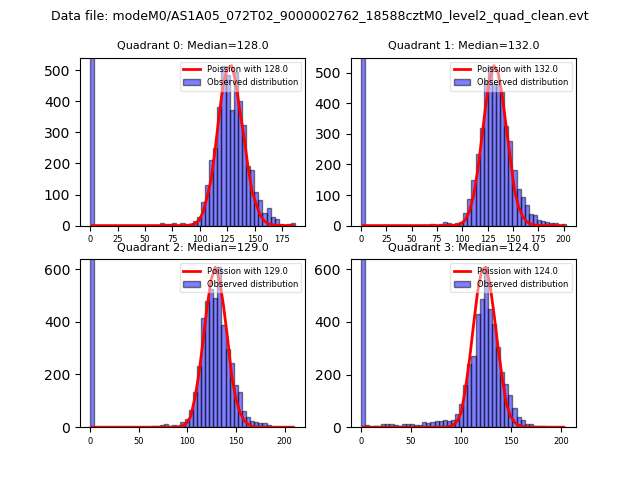 |
 |
| Quadrant-wise count rates Data is divided into 100 sec bins |
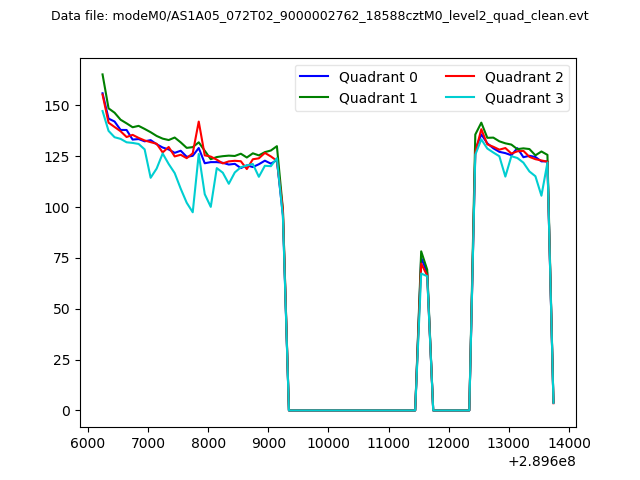 |
|
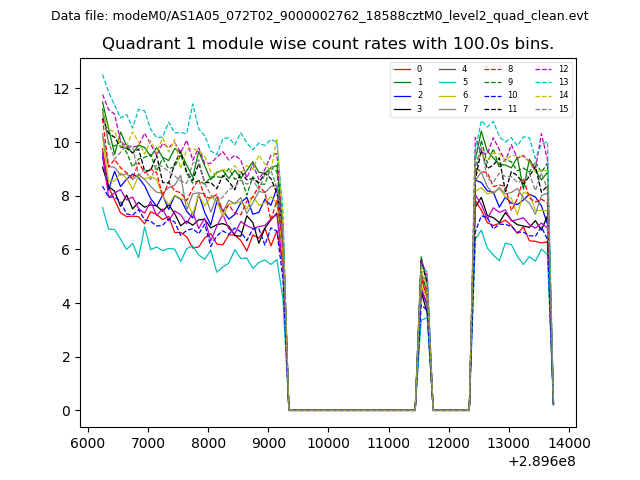
| Module-wise count rates for Quadrant A Data is divided into 100 sec bins |
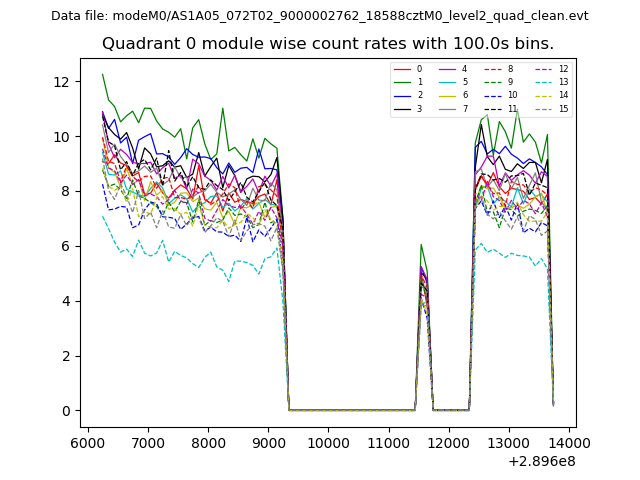 |
 |
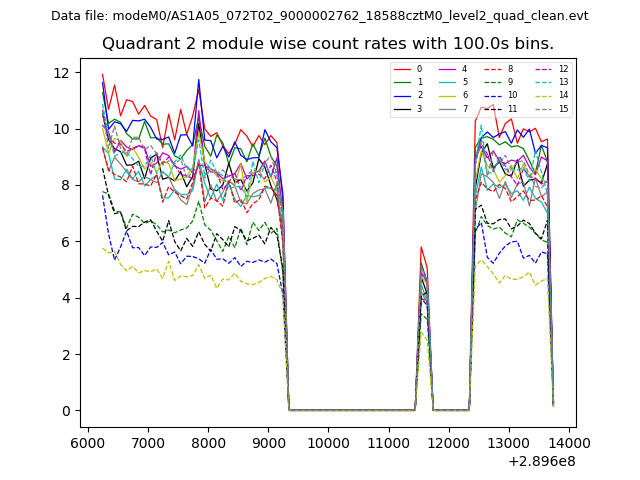
| Module-wise count rates for Quadrant B Data is divided into 100 sec bins |
 |
 |
| Module-wise count rates for Quadrant C Data is divided into 100 sec bins |
 |
 |
| Module-wise count rates for Quadrant D Data is divided into 100 sec bins |
 |
 |
| Parameter | Plot |
|---|---|
| CZT HV Monitor | 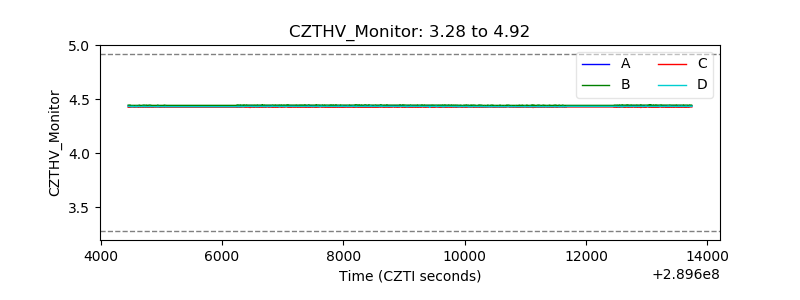 |
| D_VDD | 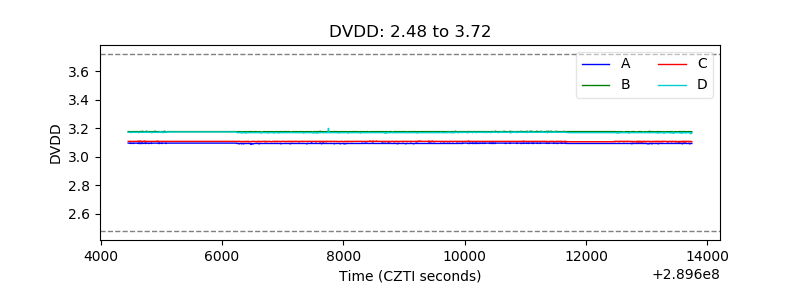 |
| Temperature 1 | 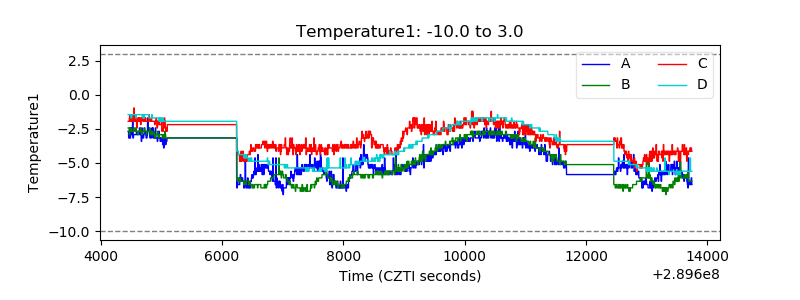 |
| Veto HV Monitor | 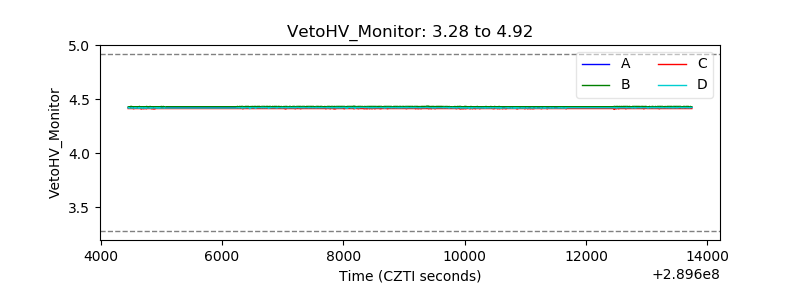 |
| Veto LLD | 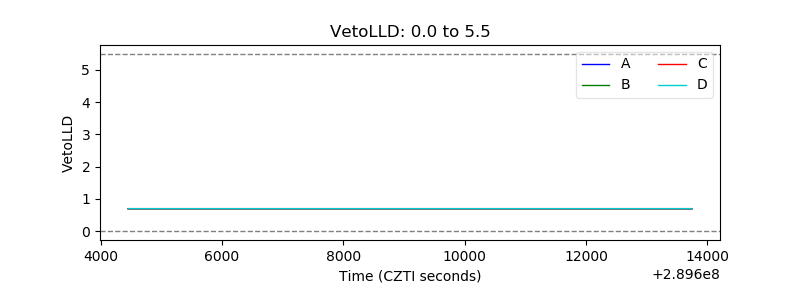 |
| Alpha Counter | 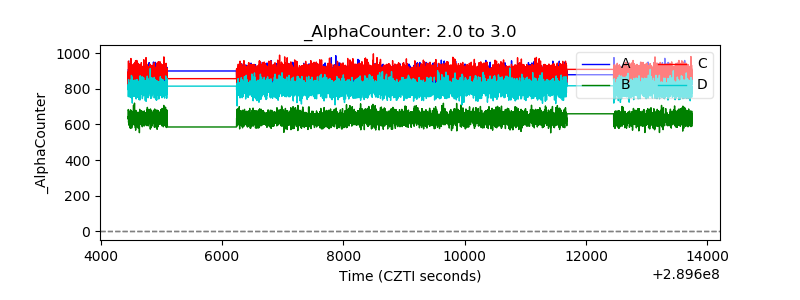 |
| _CPM_Rate | 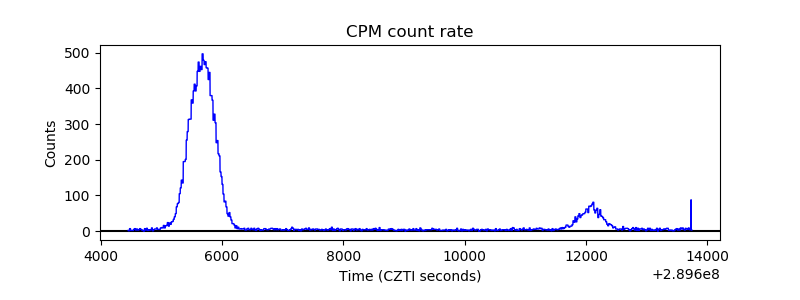 |
| CZT Counter | 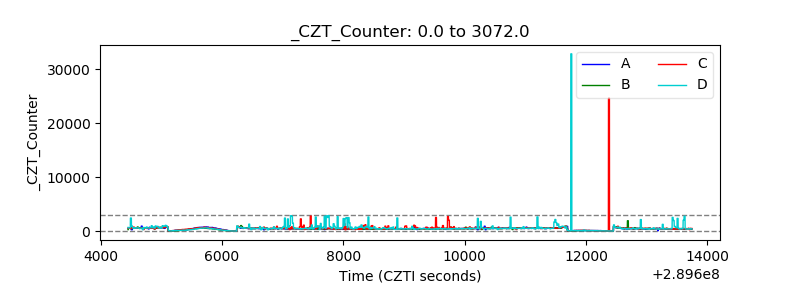 |
| +2.5 Volts monitor | 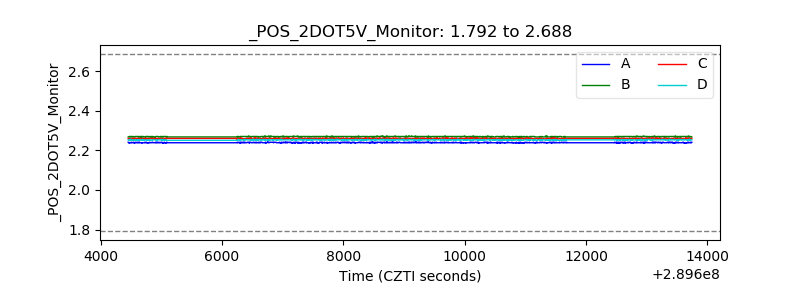 |
| +5 Volts monitor |  |
| _ROLL_ROT | 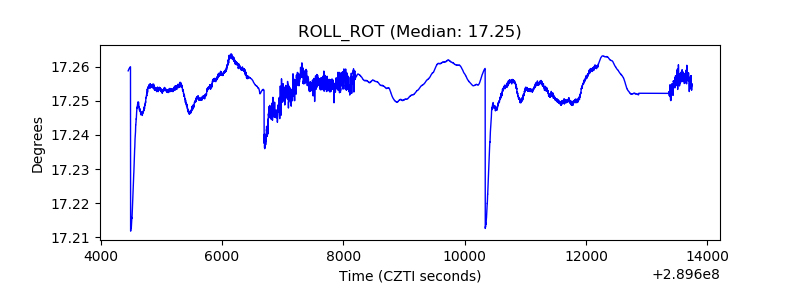 |
| _Roll_DEC | 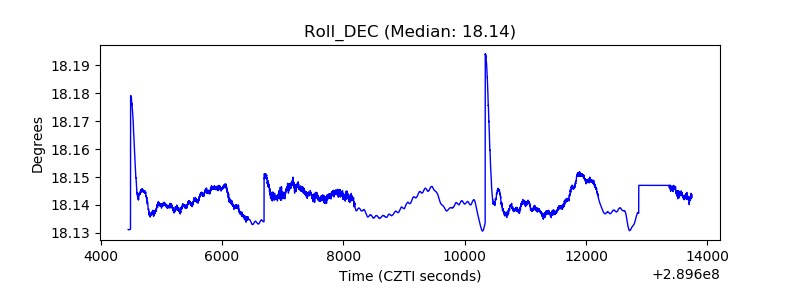 |
| _Roll_RA | 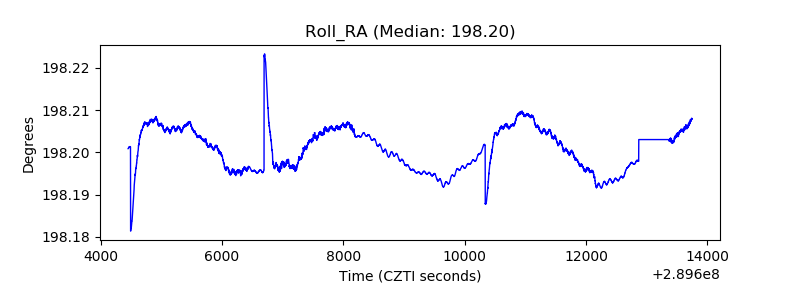 |
| Veto Counter | 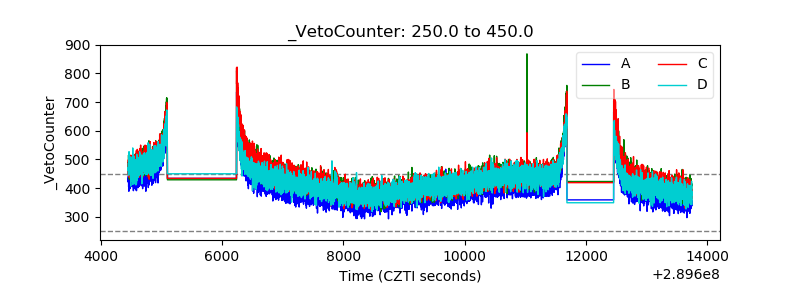 |